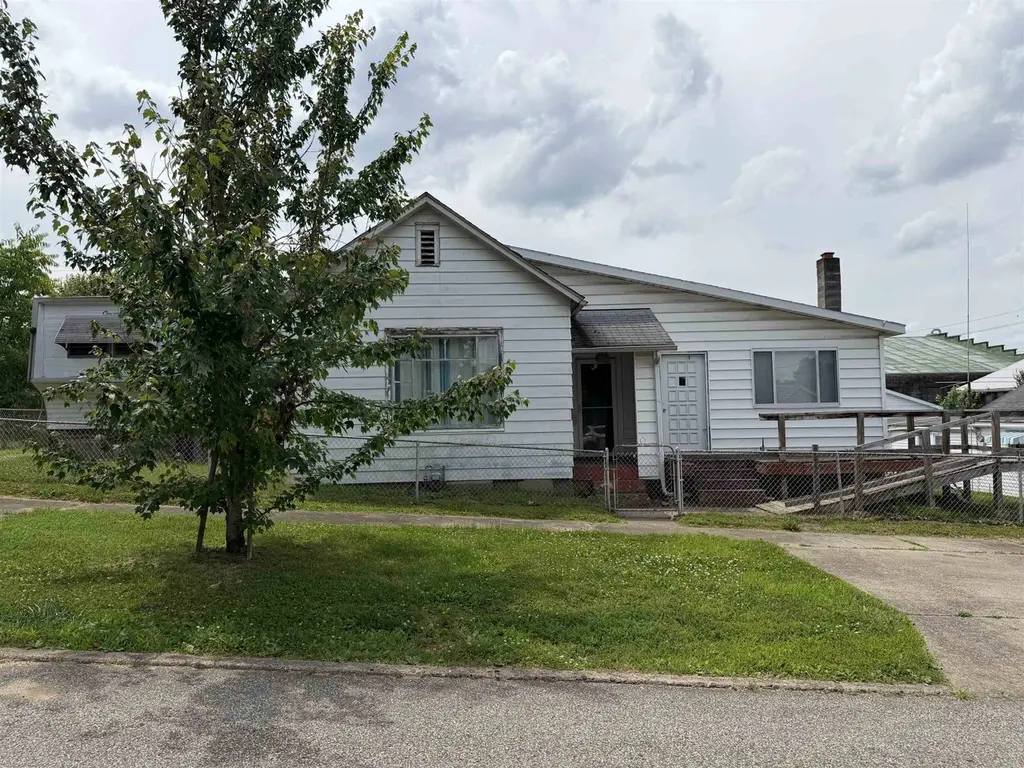
141 E 2nd St · Ceredo, WV
Flood risk 1/10 · Minimal
- FEMA flood zone
- X
- Chance of flooding over 30 yrs
- 0.0%
- Est. flood insurance / yr
- $507 – $1,088
Fire risk 3/10 · Minor
- Est. fire insurance / yr
- $787 – $1,461
Heat risk 5/10 · Moderate
- Hot days now (above 101°F)
- 7 days/yr
- Hot days in 30 yrs
- 20 days/yr
Wind risk 2/10 · Minimal
- Chance of severe wind over 30 yrs
- 1.0%
Air-quality risk 2/10 · Minimal
- Unhealthy air days now
- 0 days/yr
- Unhealthy air days in 30 yrs
- 1 days/yr
Risk factors via First Street. Map © Google.
Why this score? — see what drove the B+ grade
The composite is a weighted blend of 9 inputs, each scored 0–100. Each bar is that input's sub-score; the figure is the points it added to the 100-point composite (weight × sub-score).
- Cash flow +30.0/30.0
- DSCR +10.0/10.0
- Appreciation +10.0/10.0
- 1% rule +8.1/10.0
- ARV discount +7.5/15.0
- Livability +4.0/5.0
- Schools +2.6/10.0
- Rent growth +2.5/5.0
- Condition / age +2.5/5.0
$70,000
🖨 Deal sheet 📄 Offer letter ✓ Due diligence
Listing remarks
Excellent investment opportunity for a rental, flip, or primary residence. Single story home with 2 bedrooms, office or potential 3rd bedroom, 2 full baths, spacious kitchen, and a large garage for off street parking. Additional lot with mobile home that could be repaired and rented or removed to make room for outdoor living. Conveniently located in desirable Ceredo, WV.
Key facts
- Large garage
- Spacious kitchen
- Outdoor living
Tags
Property features AI
Exterior
- Parking: Detached off-street garage (1 car)
- Utilities: Public water; Public sewer
- Home design: Single-family residence; Single-story
- Construction: Wood siding; Shingle roof; Crawl space foundation; Built on a 0.17-acre lot
- Exterior features: Chain link fencing; Level lot
Interior
- Kitchen: Refrigerator; Oven
- Flooring: Vinyl; Carpet; Wood
- Bathrooms: 2 full bathrooms
- Heating & cooling: Central heating (Natural Gas); Central air conditioning
- Interior features: Refrigerator; Oven
Neighborhood map
What this means for you Summary
Snapshot
- This is a 2-bed/2.0-bath single-family listed at $70k.
Deal economics
- At list price, monthly cash flow is $274 ($3k/yr) — positive.
- The deal already cash-flows at list — no discount required.
- Meets the 1% rule at list price ($920 rent vs $70k).
Location & tenants
- Location reads 79/100 on livability (#18 in WV, #2,195 nationally) — a middle-class / working-renter tenant base. Strengths: crime A+, cost of living A+, housing A+; Watch: amenities F, employment F.
- Wayne County Schools (rural): math 25% / reading 38% proficiency, ranked #25 of 55 in WV (top 46%) — families likely to look elsewhere, expect single-tenant / working-renter base with shorter leases.
- Zoned schools: Spring Valley High School (math 17% / reading 47%, grade F, #55 of 110 statewide, top 59%, 910 students, 0% FRL) — zoned schools average 0% FRL vs 46% district-wide (46 pts lower); this property's tenant base skews higher-income than the district average.
- Market conditions: 25 active listings in the ZIP; 67 units permitted in Wayne County in 2024 (0 in 5+ unit buildings).
Forward outlook
- In year one you build about $7k of equity ($484 loan paydown + $7k appreciation (10.0% local appreciation)).
- Wayne County population projected at -22% by 2050 — secular population decline; favor cash flow + early exit over multi-decade hold.
- At projected returns (10.0% appreciation + 3.0% rent growth), your $20k cash investment doubles in ~2 years — after that, you're playing with house money.
- By year 5, paydown + projected appreciation supports a ~$35k cash-out refi (75% LTV) — recoverable capital for the next deal without selling this one.
Negotiation context
- Only 10 days on market — expect competitive offers; lowballing is unlikely to land.
Risks & watch-outs
- Watch-outs: built in 1937 — expect roof / HVAC / electrical / plumbing capex.
- Climate carrying-cost: extreme-heat days projected 7→20/yr by 2055 (HVAC capex compounding) — expect insurance premiums to compound above CPI over the hold.
Questions for the listing agent
- Built in 1937 — when were the roof, HVAC, electrical panel, plumbing, and water heater last replaced?
- Is there a deadline driving the sale (1031 exchange, divorce, estate, relocation)? That informs how much negotiation room exists.
- Schools are F-rated, which usually means shorter tenancies and higher turnover. Who's the typical renter profile here, and what's been the actual vacancy rate?
- What's the average days-on-market for RENTAL listings here right now (not sales)? A rising rental-DOM trend means longer vacancies and softer asking-rent achievability than the comps imply.
- What's the recent tenant-quality profile in this submarket — average credit score on applications, eviction rate, late-payment / NSF rate, and stable-employment percentage? A property-management company in the area should have these aggregated.
- How much new for-sale + rental construction is in the pipeline within 1–3 miles? Heavy new supply typically softens prices + rents 12–24 months out; constrained supply supports both.
Investment metrics
- 1% rule
- 1.31% ✓
- Cap rate
- 10.99%
- Cash-on-cash
- 16.79%
- DSCR
- 1.75
- GRM
- 6.3
CMA / ARV
- ARV (on-the-fly)
- $201,240
- Comps found
- 6
Show comp detail 6 sales within ~0.75 mi
| Address | Dist | Beds/Ba | Sqft | Sold | Price | $/sf | Match |
|---|---|---|---|---|---|---|---|
| 138 2nd Street St W | 0.19mi | 3/2.0 (+1) | 1,512 (-3%) | 24mo | $160,000 | $106 | 61 |
| 135 Park Ter | 0.34mi | 2/2.0 | 1,457 (-7%) | 19mo | $195,000 | $134 | 57 |
| 6478 County Road 1 | 0.74mi | 2/1.5 | 1,485 (-5%) | 7mo | $200,000 | $135 | 50 |
| 772 1st Street West | 0.46mi | 2/1.0 | 1,389 (-11%) | 9mo | $84,900 | $61 | 48 |
| 148 B St | 0.38mi | 3/2.0 (+1) | 1,664 (+7%) | 24mo | $215,000 | $129 | 46 |
| 60 Goodwill Rd | 0.53mi | 3/1.0 (+1) | 1,776 (+14%) | 3mo | $118,300 | $67 | 41 |
Match score weights: distance 35% · size 25% · config 20% · recency 20%. Top-matched comps best support the ARV.
Projected returns pro-forma
10.0% appreciation · 3.0% rent growth · sell at horizon
- IRR
- 36.7%
- Equity multiple
- 3.84×
- Total profit
- $55,587
- Equity at exit
- $63,062
- IRR
- 31.6%
- Equity multiple
- 8.65×
- Total profit
- $149,946
- Equity at exit
- $135,995
Cash invested: $19,600 (down + closing). Projections, not guarantees.
Landlord ↔ Tenant lean methodology
- Overall (STATE)
- 83 Strongly Landlord-Friendly
- State West Virginia
- 83 Strongly Landlord-Friendly · R+22
- County
- — inherits STATE
- City
- — inherits STATE
ZIP-level market 25530
- Home prices YoY
- 7.7%
- Active inventory
- 25
- Price-to-rent
- 6.3×
Monthly cashflow live
- Estimated rent
- $920 medium interval (Pro) →
- Mortgage (P&I)
- −$367
- Tax from tax record
- −$56 /mo · $673/yr
- Insurance
- −$29
- HOA
- −$0
- Vacancy / Maint / Mgmt
- −$193
- Net cashflow
- $274
Break-even live
UW: 25.0% down · 7.5% · 30yr · 1.5% tax · 5.0% vac · 8.0% maint · 8.0% mgmt
Financing live
Cash to close
- Down payment
- $17,500
- Closing costs
- $2,100
- Reserves months
- —
- Total cash needed
- —
Loan-product check · same deal, 3 products live
Conventional
25% down · 7.5% · 30yr
- Down + closing
- —
- Monthly P&I
- —
- Monthly cashflow
- —
- DSCR
- —
- Eligible?
- —
Personal DTI + credit; lowest rate.
DSCR
20% down · 8.5% · 30yr
- Down + closing
- —
- Monthly P&I
- —
- Monthly cashflow
- —
- DSCR
- —
- Eligible?
- —
No personal income docs; deal must DSCR.
Hard money
10% down · 12.0% · 12mo
- Down + closing
- —
- Monthly P&I
- —
- Monthly cashflow
- —
- DSCR
- —
- Eligible?
- —
Short-term bridge; refi at stabilization.
Listing history 8 events
-
2026-06-19days on market $70,000 Active 10 DOM
-
2026-06-18days on market $70,000 Active 9 DOM
-
2026-06-17days on market $70,000 Active 8 DOM
-
2026-06-16days on market $70,000 Active 7 DOM
-
2026-06-15days on market $70,000 Active 6 DOM
-
2026-06-14days on market $70,000 Active 4 DOM
-
2026-06-12remarks 373-char remark
-
2026-06-12$70,000 Active 3 DOM
ⓘ Source: listings_history table (triggers on properties + properties_extension) + one-shot
backfill from property_details.listing_events for pre-trigger history.
Tax reassessment forecast WV · Resets to sale price
- Current annual tax
- $673 · $56/mo
- Projected year-2 tax
- $673 · $56/mo
- Expected delta
- $0/yr ($0/mo · 0.0%)
ⓘ Screening estimate from a state-policy table — verify with the county assessor before closing.
Climate risk First Street
- Flood 1/10 Low FEMA zone X · 0% chance over 30 yrs
- Wildfire 3/10 Moderate
- Heat 5/10 Major 7 d/yr ≥101°F today · 20 d/yr by 30 yrs out
- Wind 2/10 Low 100% chance of damaging wind over 30 yrs
- Air quality 2/10 Low 0 unhealthy d/yr today · 1 by 30 yrs out
Nearby sold comps map
Loading sold comps map…
Walkable amenities ~0.75 mi
Loading nearby amenities…
Taxation est. · year 1
- Rental income
- $11,037
- − Mortgage interest
- −$3,921
- − Property taxes
- −$673
- − Insurance
- −$350
- − Repairs & maintenance
- −$883
- − Management
- −$883
- − Depreciation
- −$2,036
- Taxable income
- $2,291
- Est. tax owed @ 24.0%
- −$550
- After-tax cash flow
- $2,741/yr
For passive investors: Depreciation is non-cash, so a rental often shows a tax loss while cash-flowing — sheltering income. Rental losses are passive: they offset passive income freely, and up to $25,000/yr can offset ordinary (W-2) income if you actively participate and your MAGI is under $100k (phasing out to $0 by $150k); unused losses carry forward. On sale, claimed depreciation is recaptured at up to 25%, and gains may owe capital-gains tax (a 1031 exchange can defer both). Figures are a year-1 estimate at your 24.0% rate — not tax advice; consult a CPA.
Schools (NCES district)
- District
- Wayne County Schools
- NCES district ID
- 5401500
- Math proficiency
- 25% ▼ -15.00%
- Reading proficiency
- 38% ▼ -10.00%
- Median HH income
- $36,283
- Composite
- 26.08/100
- National rank
- #7297
- State rank
- #25 of 55 in WV
Livability — Ceredo
- Score
- 79/100
- State rank
- #18
- US rank
- #2195
Category grades
Schools grade is shown separately in the Schools card above.
Census & demographics
- Census place
- Ceredo, WV
- City population
- 1,180
- Population (ZIP)
- 6,642
Population outlook (Wayne County) Hauer SSP2
- Today (2025)
- 38,267 people
- By 2030
- 36,578 · -4.4%
- By 2040
- 33,034 · -13.7%
- By 2050
- 29,671 · -22.5%
- By 2075
- 22,901 · -40.2%
- By 2100
- 17,421 · -54.5%
Race, ethnicity, and origin ACS 2023
- Neighborhood character
- Predominantly White (94%)
- Race & ethnicity
- White 94% Two or more races 4% Black 2%
- Common ancestry
- Scottish 4% Italian 4% Serbian 2%
Political lean MEDSL · Wayne
- 2024 margin
- Solid R (+53.4) · D 22.4% · R 75.8% · Other 1.8%
- 2008→2024 swing
- -35.1pp toward R · 2008: -18.2pp · 2024: -53.4pp
- All cycles
- 2024: R+53.4 2020: R+50.1 2016: R+51.3 2012: R+27.0 2008: R+18.2
Not yet ingested
- Civics
- —
Market trends
- HPI YoY
- ▲ 14.35%
- Current HPI
- 201.9673
- Rent YoY
- —
- Metro
- —
- State GDP YoY
- —
- F500 in state
- 0
Price history
1 event — show timeline
- 2026-06-09 Listed $70,000 HBRMLS
Property tax history
+2.3%/yrLatest (2025): $673 · +7.0% YoY. Source: county tax records.
Cash-flow waterfall
monthlySold comps — $/sqft
last 12 mo · ≤1 miLoading sold comps…