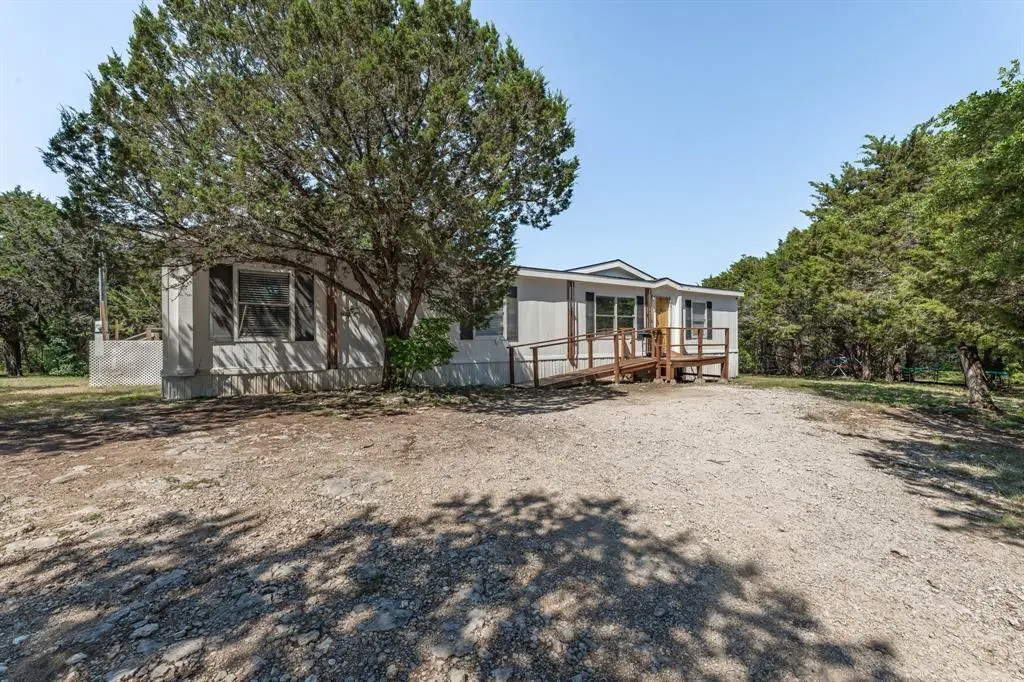
4810 Orange Blossom St · Oak Trail Shores, TX
Flood risk 1/10 · Minimal
- FEMA flood zone
- X (unshaded)
- Chance of flooding over 30 yrs
- 0.0%
- Est. flood insurance / yr
- $507 – $1,088
Fire risk 6/10 · Moderate
- Est. fire insurance / yr
- $1,222 – $2,270
Heat risk 7/10 · Major
- Hot days now (above 108°F)
- 7 days/yr
- Hot days in 30 yrs
- 21 days/yr
Wind risk 4/10 · Minor
- Chance of severe wind over 30 yrs
- 21.0%
Air-quality risk 2/10 · Minimal
- Unhealthy air days now
- 1 days/yr
- Unhealthy air days in 30 yrs
- 2 days/yr
Risk factors via First Street. Map © Google.
Why this score? — see what drove the C+ grade
The composite is a weighted blend of 9 inputs, each scored 0–100. Each bar is that input's sub-score; the figure is the points it added to the 100-point composite (weight × sub-score).
- Cash flow +24.9/30.0
- ARV discount +11.7/15.0
- DSCR +8.1/10.0
- 1% rule +6.3/10.0
- Schools +4.0/10.0
- Livability +2.9/5.0
- Rent growth +2.8/5.0
- Condition / age +2.5/5.0
- Appreciation +0.0/10.0
$174,000
🖨 Deal sheet 📄 Offer letter ✓ Due diligence
Listing remarks MLS
This one is a very nice mobile home located on an oversized lot!! This home has a ton of room, the rooms are all very good sized! It features 4 bedrooms, 3 full baths and an open living, kitchen and dining room area! This home is move in ready and priced to sell! The lot is oversized and has a lot of room to run around and enjoy it! Its located towards the end of a quiet Cul de sac street. If you are looking for a home that will not break the bank, then come take a look at this one as see if its the one for you!! The HOA community has a boat ramp, community dock and pool that included with the required membership!
Key facts
- Community dock
- Pool
- Oversized lot
Tags
Neighborhood map
What this means for you Summary
Snapshot
- This is a 4-bed/3.0-bath manufactured listed at $174k.
Deal economics
- At list price, monthly cash flow is $374 ($4k/yr) — positive.
- The deal already cash-flows at list — no discount required.
- Meets the 1% rule at list price ($2k rent vs $174k).
- Recommended offer: $153k (12.0% below list) — sets the bar for market timing.
- Cap rate 8.9% vs local median 5.9% in Oak Trail Shores — top-decile yield for the area; either an underpriced asset or a hidden risk that comps aren't pricing in. Stress-test before assuming the spread holds.
Location & tenants
- Location reads 58/100 on livability (#1,187 in TX) — a working-class tenant base; expect higher turnover. Strengths: cost of living A+, housing A+, crime B+; Watch: health & safety D+, schools F, amenities F.
- Granbury ISD (town): math 46% / reading 46% proficiency, ranked #237 of 826 in TX (top 29%) — families likely to look elsewhere, expect single-tenant / working-renter base with shorter leases.
- Market conditions: Rents rising (+1.1%/yr); 929 active listings in the ZIP; 3 comparable units currently listed for rent nearby; rentals leasing fast (median 1d on market — plan ~1-2 weeks tenant-placement turnaround); 125 units permitted in Hood County in 2024 (0 in 5+ unit buildings).
- This rent runs 34% of the median local income ($70k/yr) — at the standard rent-burdened threshold; future hikes will face affordability resistance.
Forward outlook
- Local home prices are declining (-3.0%/yr); year-one equity from $1k of loan paydown is wiped out by about $5k of value loss. Plan a longer hold.
- Hood County population projected at +29% by 2050 — long-run rental-demand tailwind backs the buy-and-hold thesis.
Negotiation context
- It's been on market 422 days — a 12% lower offer ($153k) is reasonable based on typical stale-listing flexibility.
- 2 sale attempts since 10y ago; this cycle's ask has dropped $25k (13%) from the opening price — seller is motivated, your offer sets the floor, not the list.
Risks & watch-outs
- Climate carrying-cost: major wildfire risk; extreme-heat days projected 7→21/yr by 2055 (HVAC capex compounding) — expect insurance premiums to compound above CPI over the hold.
Questions for the listing agent
- It's been on market 422 days. Have you received any prior offers? Is the seller open to a 12% concession, seller financing, or rate buy-down credit?
- What does the HOA fee cover, when was the last increase, and are there any pending special assessments or reserve-fund shortfalls?
- Why hasn't it sold? Are there any deal-killer items the seller is aware of (foundation, flood, title, zoning, code violations)?
- Is there a deadline driving the sale (1031 exchange, divorce, estate, relocation)? That informs how much negotiation room exists.
- Schools are F-rated, which usually means shorter tenancies and higher turnover. Who's the typical renter profile here, and what's been the actual vacancy rate?
- What's the average days-on-market for RENTAL listings here right now (not sales)? A rising rental-DOM trend means longer vacancies and softer asking-rent achievability than the comps imply.
- What's the recent tenant-quality profile in this submarket — average credit score on applications, eviction rate, late-payment / NSF rate, and stable-employment percentage? A property-management company in the area should have these aggregated.
- How much new for-sale + rental construction is in the pipeline within 1–3 miles? Heavy new supply typically softens prices + rents 12–24 months out; constrained supply supports both.
Investment metrics
- 1% rule
- 1.13% ✓
- Cap rate
- 8.87%
- Cash-on-cash
- 9.20%
- DSCR
- 1.41
- GRM
- 7.4
CMA / ARV
- ARV (median comp)
- $191,946
- List price
- $174,000
- Delta
- -9.35%
- Verdict
- FAIR
- Comps
- 8 within 1.0 mi
Show comp detail 7 sales within ~0.75 mi
| Address | Dist | Beds/Ba | Sqft | Sold | Price | $/sf | Match |
|---|---|---|---|---|---|---|---|
| 4813 Peachtree St | 0.14mi | 4/2.0 | 1,768 (-8%) | 2mo | $335,000 | $189 | 75 |
| 3101 Hilltop Rd | 0.37mi | 4/2.0 | 1,768 (-8%) | 0mo | $199,000 | $113 | 65 |
| 2806 Hilltop Rd | 0.40mi | 4/2.0 | 2,015 (+5%) | 13mo | $260,000 | $129 | 58 |
| 5357 Chief Ct | 0.50mi | 3/2.0 (-1) | 2,048 (+7%) | 2mo | $390,000 | $190 | 55 |
| 4505 Appletree Ct | 0.47mi | 3/2.0 (-1) | 1,736 (-10%) | 0mo | $249,900 | $144 | 53 |
| 3211 Evergreen Dr | 0.38mi | 3/2.0 (-1) | 1,706 (-11%) | 7mo | $179,900 | $105 | 49 |
| 5425 Lake View Dr | 0.68mi | 3/2.0 (-1) | 1,736 (-10%) | 11mo | $187,000 | $108 | 34 |
Match score weights: distance 35% · size 25% · config 20% · recency 20%. Top-matched comps best support the ARV.
Projected returns pro-forma
-3.0% appreciation · 1.1% rent growth · sell at horizon
- IRR
- -4.5%
- Equity multiple
- 0.83×
- Total profit
- $-8,075
- Equity at exit
- $25,944
- IRR
- 2.8%
- Equity multiple
- 1.19×
- Total profit
- $9,105
- Equity at exit
- $15,044
Cash invested: $48,720 (down + closing). Projections, not guarantees.
Landlord ↔ Tenant lean methodology
- Overall (STATE)
- 87 Strongly Landlord-Friendly
- State Texas
- 87 Strongly Landlord-Friendly · R+5
- County
- — inherits STATE
- City
- — inherits STATE
ZIP-level market 76048
- Home prices YoY
- -23.4%
- Rents YoY
- 1.1%
- Active inventory
- 929
- Price-to-rent
- 7.4×
Monthly cashflow live
- Estimated rent
- $1,965 medium interval (Pro) →
- Mortgage (P&I)
- −$912
- Tax from tax record
- −$186 /mo · $2,229/yr
- Insurance
- −$72
- HOA
- −$8
- Vacancy / Maint / Mgmt
- −$413
- Net cashflow
- $374
Break-even live
UW: 25.0% down · 7.5% · 30yr · 1.5% tax · 5.0% vac · 8.0% maint · 8.0% mgmt
Financing live
Cash to close
- Down payment
- $43,500
- Closing costs
- $5,220
- Reserves months
- —
- Total cash needed
- —
Loan-product check · same deal, 3 products live
Conventional
25% down · 7.5% · 30yr
- Down + closing
- —
- Monthly P&I
- —
- Monthly cashflow
- —
- DSCR
- —
- Eligible?
- —
Personal DTI + credit; lowest rate.
DSCR
20% down · 8.5% · 30yr
- Down + closing
- —
- Monthly P&I
- —
- Monthly cashflow
- —
- DSCR
- —
- Eligible?
- —
No personal income docs; deal must DSCR.
Hard money
10% down · 12.0% · 12mo
- Down + closing
- —
- Monthly P&I
- —
- Monthly cashflow
- —
- DSCR
- —
- Eligible?
- —
Short-term bridge; refi at stabilization.
Rent comps 3 comps
| Address | Beds | Baths | Sqft | Rent | $/sqft | DOM | Units | Dist |
|---|---|---|---|---|---|---|---|---|
| 5418 Lake View Dr Granbury, TX | 3.0 | 2.0 | 1284 | $1,300 | $1.01 | 43d | 1 | 0.62mi |
| 4321 Terri Lee Ln Granbury, TX | 4.0 | 2.0 | 1387 | $2,075 | $1.50 | 1d | 1 | 0.71mi |
| 5609 Arkansas Trl Granbury, TX | 3.0 | 2.0 | 1920 | $1,950 | $1.02 | 1d | 1 | 0.95mi |
HOA detail
- Monthly dues
- $8 · $96/yr
- Likely covers
- pool
Listing history 19 events
-
2026-06-18days on market $174,000 Active 422 DOM
-
2026-06-17days on market $174,000 Active 421 DOM
-
2026-06-16days on market $174,000 Active 420 DOM
-
2026-06-15days on market $174,000 Active 419 DOM
-
2026-06-13days on market $174,000 Active 417 DOM
-
2026-06-09days on market $174,000 Active 413 DOM
-
2026-06-08days on market $174,000 Active 412 DOM
-
2026-06-07days on market $174,000 Active 411 DOM
-
2026-06-04days on market $174,000 Active 408 DOM
-
2026-06-03days on market $174,000 Active 407 DOM
-
2026-06-02days on market $174,000 Active 406 DOM
-
2026-06-02days on market $174,000 Active 405 DOM
-
2026-05-31days on market $174,000 Active 404 DOM
-
2026-04-04price $174,000 621-char remark
Show marketing remark (621 chars)
This one is a very nice mobile home located on an oversized lot!! This home has a ton of room, the rooms are all very good sized! It features 4 bedrooms, 3 full baths and an open living, kitchen and dining room area! This home is move in ready and priced to sell! The lot is oversized and has a lot of room to run around and enjoy it! Its located towards the end of a quiet Cul de sac street. If you are looking for a home that will not break the bank, then come take a look at this one as see if its the one for you!! The HOA community has a boat ramp, community dock and pool that included with the required membership!
-
2025-08-29price $189,000 621-char remark
Show marketing remark (621 chars)
This one is a very nice mobile home located on an oversized lot!! This home has a ton of room, the rooms are all very good sized! It features 4 bedrooms, 3 full baths and an open living, kitchen and dining room area! This home is move in ready and priced to sell! The lot is oversized and has a lot of room to run around and enjoy it! Its located towards the end of a quiet Cul de sac street. If you are looking for a home that will not break the bank, then come take a look at this one as see if its the one for you!! The HOA community has a boat ramp, community dock and pool that included with the required membership!
-
2025-04-22$199,000 Active 621-char remark
Show marketing remark (621 chars)
This one is a very nice mobile home located on an oversized lot!! This home has a ton of room, the rooms are all very good sized! It features 4 bedrooms, 3 full baths and an open living, kitchen and dining room area! This home is move in ready and priced to sell! The lot is oversized and has a lot of room to run around and enjoy it! Its located towards the end of a quiet Cul de sac street. If you are looking for a home that will not break the bank, then come take a look at this one as see if its the one for you!! The HOA community has a boat ramp, community dock and pool that included with the required membership!
-
2016-03-23soldstatus Sold 405-char remark
Show marketing remark (405 chars)
Great location near Brazos River. Large storage bldg. Open concept living, dining and kitchen floor plan with island. Master suite features walk-in closet, dual sinks, separate tub-shower. All info deemed reliable but not guaranteed - it shall be incumbent upon Buyer to independently verify all info that may impact their purchase decision. HUD owned property, case #492-800453. HUD Homes are sold AS IS.
-
2016-02-29status Pending 405-char remark
Show marketing remark (405 chars)
Great location near Brazos River. Large storage bldg. Open concept living, dining and kitchen floor plan with island. Master suite features walk-in closet, dual sinks, separate tub-shower. All info deemed reliable but not guaranteed - it shall be incumbent upon Buyer to independently verify all info that may impact their purchase decision. HUD owned property, case #492-800453. HUD Homes are sold AS IS.
-
2016-01-30$70,000 Active 405-char remark
Show marketing remark (405 chars)
Great location near Brazos River. Large storage bldg. Open concept living, dining and kitchen floor plan with island. Master suite features walk-in closet, dual sinks, separate tub-shower. All info deemed reliable but not guaranteed - it shall be incumbent upon Buyer to independently verify all info that may impact their purchase decision. HUD owned property, case #492-800453. HUD Homes are sold AS IS.
ⓘ Source: listings_history table (triggers on properties + properties_extension) + one-shot
backfill from property_details.listing_events for pre-trigger history.
Tax reassessment forecast TX · Resets to sale price
- Current annual tax
- $2,229 · $186/mo
- Projected year-2 tax
- $3,184 · $265/mo
- Expected delta
- +$955/yr (+$80/mo · 42.9%)
ⓘ Screening estimate from a state-policy table — verify with the county assessor before closing.
Climate risk First Street
- Flood 1/10 Low FEMA zone X (unshaded) · 0% chance over 30 yrs
- Wildfire 6/10 Major
- Heat 7/10 Severe 7 d/yr ≥108°F today · 21 d/yr by 30 yrs out
- Wind 4/10 Moderate 21% chance of damaging wind over 30 yrs
- Air quality 2/10 Low 1 unhealthy d/yr today · 2 by 30 yrs out
Nearby sold comps map
Loading sold comps map…
Walkable amenities ~0.75 mi
Loading nearby amenities…
Taxation est. · year 1
- Rental income
- $23,579
- − Mortgage interest
- −$9,747
- − Property taxes
- −$2,229
- − Insurance
- −$870
- − Repairs & maintenance
- −$1,886
- − Management
- −$1,886
- − HOA
- −$96
- − Depreciation
- −$5,062
- Taxable income
- $1,803
- Est. tax owed @ 24.0%
- −$433
- After-tax cash flow
- $4,050/yr
For passive investors: Depreciation is non-cash, so a rental often shows a tax loss while cash-flowing — sheltering income. Rental losses are passive: they offset passive income freely, and up to $25,000/yr can offset ordinary (W-2) income if you actively participate and your MAGI is under $100k (phasing out to $0 by $150k); unused losses carry forward. On sale, claimed depreciation is recaptured at up to 25%, and gains may owe capital-gains tax (a 1031 exchange can defer both). Figures are a year-1 estimate at your 24.0% rate — not tax advice; consult a CPA.
Schools (NCES district)
- District
- Granbury ISD
- NCES district ID
- 4821390
- Math proficiency
- 46% ▬ 0.00%
- Reading proficiency
- 46% ▲ 4.00%
- Median HH income
- $55,856
- Composite
- 40.04/100
- National rank
- #3820
- State rank
- #237 of 826 in TX
Livability — Oak Trail Shores
- Score
- 58/100
- State rank
- #1187
- US rank
- #20758
Category grades
Schools grade is shown separately in the Schools card above.
Census & demographics
- Census place
- Oak Trail Shores, TX
- County
- Hood County · 58,506 people
- Metro
- Granbury, TX
- Population (ZIP)
- 27,000
- Household income
- $70,346
- Rent vs Own
- Severe rent burden
- 612.0
Population outlook (Hood County) Hauer SSP2
- Today (2025)
- 63,502 people
- By 2030
- 67,459 · +6.2%
- By 2040
- 74,958 · +18.0%
- By 2050
- 81,922 · +29.0%
- By 2075
- 98,872 · +55.7%
- By 2100
- 107,796 · +69.8%
Race, ethnicity, and origin ACS 2023
- Neighborhood character
- Predominantly White (80%)
- Race & ethnicity
- White 80% Hispanic / Latino 14% Two or more races 11% Black 1%
- Hispanic origin (detail)
- Mexican 13%
- Common ancestry
- Italian 2% Slovak 2% Portuguese 1%
- Foreign-born
- 4% · Canada
- Languages at home
- 89% English-only · Spanish 10%
Political lean MEDSL · Hood
- 2024 margin
- Solid R (+66.0) · D 16.6% · R 82.6%
- 2008→2024 swing
- -11.9pp toward R · 2008: -54.0pp · 2024: -66.0pp
- All cycles
- 2024: R+66.0 2020: R+64.1 2016: R+66.5 2012: R+64.7 2008: R+54.0
Not yet ingested
- Civics
- —
Market trends
- HPI YoY
- ▼ -83.25%
- Current HPI
- 272.2126
- Rent YoY
- ▲ 1.10%
- Metro
- Granbury, TX
- State GDP YoY
- ▲ 3.95%
- F500 in state
- 110
Industry mix (Fortune 500 HQ in TX)
| Industry | F500 HQs | Revenue |
|---|---|---|
| Energy | 16 | $1,198B |
|
||
| Technology | 5 | $198B |
|
||
| Engineering / Construction | 4 | $72B |
|
||
| Energy Services | 3 | $60B |
|
||
| Utilities | 3 | $41B |
|
||
| Healthcare | 2 | $330B |
|
||
Price history
+148.6% since first listed6 events — show timeline
- 2026-04-04 Price Changed $174,000 NTREIS
- 2025-08-29 Price Changed $189,000 NTREIS
- 2025-04-22 Listed $199,000 NTREIS
- 2016-03-23 Sold (MLS) — NTREIS
- 2016-02-29 Pending — NTREIS
- 2016-01-30 Listed $70,000 NTREIS
Property tax history
+3.1%/yrLatest (2025): $2,229 · -1.5% YoY. Source: county tax records.
Cash-flow waterfall
monthlySold comps — $/sqft
last 12 mo · ≤1 miLoading sold comps…