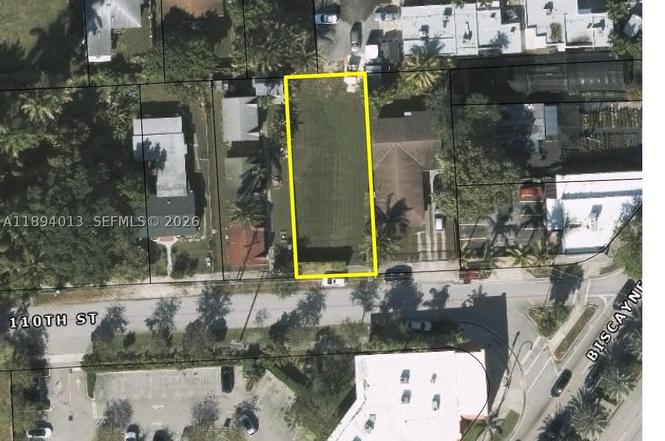
1386 NE 110th Ter · Miami Shores, FL
Flood risk 7/10 · Major
- FEMA flood zone
- AE
- Chance of flooding over 30 yrs
- 0.77%
- Est. flood insurance / yr
- $1,737 – $8,500
Fire risk 1/10 · Minimal
- Est. fire insurance / yr
- $947 – $1,759
Heat risk 10/10 · Severe
- Hot days now (above 103°F)
- 7 days/yr
- Hot days in 30 yrs
- 28 days/yr
Wind risk 10/10 · Severe
- Chance of severe wind over 30 yrs
- 99.0%
Air-quality risk 2/10 · Minimal
- Unhealthy air days now
- 1 days/yr
- Unhealthy air days in 30 yrs
- 2 days/yr
Risk factors via First Street. Map © Google.
Why this score? — see what drove the F grade
The composite is a weighted blend of 9 inputs, each scored 0–100. Each bar is that input's sub-score; the figure is the points it added to the 100-point composite (weight × sub-score).
- ARV discount +7.5/15.0
- Schools +4.2/10.0
- Livability +4.0/5.0
- Cash flow +3.4/30.0
- Condition / age +2.5/5.0
- Rent growth +2.3/5.0
- 1% rule +0.0/10.0
- DSCR +0.0/10.0
- Appreciation +0.0/10.0
$1,299,000
🖨 Deal sheet 📄 Offer letter ✓ Due diligence
Listing remarks
Stunning CUSTOM-BUILT West Miami residence on a rare 6,851 SF CORNER LOT! Built in 1995 and surrounded by charming 1940s homes, this unique property offers modern construction, soaring VAULTED CEILINGS, OPEN-CONCEPT design with NO hallways, and exceptional natural light throughout. Spacious kitchen and dining area ideal for entertaining, oversized MASTER SUITE with 3 closets including TWO WALK-IN CLOSETS, plus PRIVATE IN-LAW SUITE with separate entrance—perfect for guests, extended family, home office or income potential. Enjoy a HUGE 39’ COVERED TERRACE and expansive 40’ SIDE PARKING for BOAT, RV, PICKUP TRUCK or multiple vehicles. Features include CITY WATER & SEWE
Key facts
- Master suite
- Custom-built
- Vaulted ceilings
Tags
Property features AI
Finance
- HOA & community: Street lights in the community
Exterior
- Parking: Circular driveway; Driveway
- Security: Storm/Security shutters
- Utilities: Underground utilities; Electric with fuses; Public sewer; Public water
- Home design: Single-story home; Faces south; Barrel roof; Block construction
- Construction: Block construction; Barrel roof; Resale property
- Exterior features: Balcony; Open porch; Porch; Fence; Outdoor lighting; Awning(s); Storm/Security shutters; Shed(s)
Interior
- Kitchen: Dishwasher; Electric range; Self-cleaning oven; Refrigerator; Garbage disposal; Trash compactor
- Bedrooms: Bedroom 2 (14' x 10'8"); Bedroom 3 (13'5" x 10'); Primary bedroom / Big mass (15'8" x 13'); Guest quarters / In-law suite included
- Flooring: Ceramic tile
- Bathrooms: 2 full bathrooms; Bidet and separate shower noted
- Heating & cooling: Central heating; Central air conditioning
- Interior features: Arched windows with blinds; Furnishing negotiable; Breakfast bar; Bidet; Bedroom on main level; Family/Dining room; First-floor entry; High ceilings; Living/Dining room; Main level primary bedroom; Split bedrooms; Separate shower; Vaulted ceilings; Walk-in closets; Central vacuum
- Laundry & utility: Washer hookup; Dryer hookup; Utility room (7' x 5')
Neighborhood map
What this means for you Summary
Snapshot
- This is a 3-bed/2.0-bath land listed at $1.30M.
Deal economics
- At list price, monthly cash flow is $-4k ($-53k/yr) — negative.
- To cash-flow at today's rent, offer at most $519k (60.1% below list).
- To meet the 1% rule (rent ≥ 1% of price), the offer needs to be $464k (64.3% below list).
- Recommended offer: $464k (64.3% below list) — sets the bar for 1% rule.
Location & tenants
- Location reads 80/100 on livability (#130 in FL, #1,936 nationally) — a professional / high-income tenant draw. Strengths: schools A+, commute A+, employment A+; Watch: crime D, amenities F, cost of living F.
- Miami-Dade (suburban): math 45% / reading 54% proficiency, ranked #40 of 73 in FL (top 55%) — families likely to look elsewhere, expect single-tenant / working-renter base with shorter leases; 64% free/reduced lunch — lower-income household profile, screen leases tightly.
- Market conditions: Rents soft (-0.7%/yr); 338 active listings in the ZIP; 1 comparable units currently listed for rent nearby; 10,051 units permitted in Miami-Dade County in 2024 (7,758 in 5+ unit buildings).
- At $4,641/mo this rent would consume 95% of the median local household income ($58k/yr) (locally 3226% of renters already pay >50% of income on rent) — very limited rent-growth headroom before tenants either downsize or default.
Forward outlook
- Local home prices are declining (-3.0%/yr); year-one equity from $9k of loan paydown is wiped out by about $39k of value loss. Plan a longer hold.
- Miami-Dade County population projected at +28% by 2050 — long-run rental-demand tailwind backs the buy-and-hold thesis.
Negotiation context
- It's been on market 235 days — a 12% lower offer ($1.14M) is reasonable based on typical stale-listing flexibility.
- 5 sale attempts since 12y ago; this cycle's ask is 158% above the opening price — seller raised mid-cycle; expect resistance to lowballs.
- Current owner paid $55k; list at $1.30M implies a 2262% gain — meaningful room to come down on a strong offer.
Risks & watch-outs
- Watch-outs: flood insurance adds $427/mo.
- Climate carrying-cost: in FEMA flood zone AE (mandatory federal flood insurance); severe wind risk, 99% chance of damaging wind over 30y; extreme-heat days projected 7→28/yr by 2055 (HVAC capex compounding) — expect insurance premiums to compound above CPI over the hold.
Questions for the listing agent
- What do current leases actually rent for vs. the listed asking? Can we see a recent rent roll and the last 12 months of T-12 income?
- It's been on market 235 days. Have you received any prior offers? Is the seller open to a 64% concession, seller financing, or rate buy-down credit?
- What's the actual annual flood-insurance premium (NFIP or private), and is the property in a SFHA with mandatory coverage?
- Why hasn't it sold? Are there any deal-killer items the seller is aware of (foundation, flood, title, zoning, code violations)?
- Is there a deadline driving the sale (1031 exchange, divorce, estate, relocation)? That informs how much negotiation room exists.
- Schools are A-rated — typically a magnet for longer-tenancy family renters. What's the average tenant stay here, and is there a school-zone premium baked into asking?
- Crime grade is D in this area — have there been break-ins, vandalism, or insurance claims at this property in the last 3 years? What carrier currently insures it and at what premium?
- The area grade is low — what's the realistic commute time and amenity access for the typical tenant pool here? Any planned neighborhood developments (good or bad) we should know about?
- What's the average days-on-market for RENTAL listings here right now (not sales)? A rising rental-DOM trend means longer vacancies and softer asking-rent achievability than the comps imply.
- What's the recent tenant-quality profile in this submarket — average credit score on applications, eviction rate, late-payment / NSF rate, and stable-employment percentage? A property-management company in the area should have these aggregated.
- How much new for-sale + rental construction is in the pipeline within 1–3 miles? Heavy new supply typically softens prices + rents 12–24 months out; constrained supply supports both.
Investment metrics
- 1% rule
- 0.36% ✗
- Cap rate
- 2.61%
- Cash-on-cash
- -13.16%
- DSCR
- 0.41
- GRM
- 23.3
CMA / ARV
No comps found within radius.
Projected returns pro-forma
-3.0% appreciation · 0.0% rent growth · sell at horizon
- IRR
- -46.7%
- Equity multiple
- -0.39×
- Total profit
- $-505,811
- Equity at exit
- $193,685
- IRR
- —
- Equity multiple
- -1.36×
- Total profit
- $-857,098
- Equity at exit
- $112,314
Cash invested: $363,720 (down + closing). Projections, not guarantees.
Landlord ↔ Tenant lean methodology
- Overall (STATE)
- 87 Strongly Landlord-Friendly
- State Florida
- 87 Strongly Landlord-Friendly · R+3
- County
- — inherits STATE
- City
- — inherits STATE
ZIP-level market 33161
- Rents YoY
- -0.7%
- Active inventory
- 338
- Price-to-rent
- 23.3×
Monthly cashflow live
- Estimated rent
- $4,641 medium interval (Pro) →
- Mortgage (P&I)
- −$6,812
- Tax from tax record
- −$302 /mo · $3,622/yr
- Insurance
- −$541
- Flood insurance flood zone
- −$427 /mo · $5,118/yr
- HOA
- −$0
- Vacancy / Maint / Mgmt
- −$975
- Net cashflow
- $-4,416
Break-even live
UW: 25.0% down · 7.5% · 30yr · 1.5% tax · 5.0% vac · 8.0% maint · 8.0% mgmt
Financing live
Cash to close
- Down payment
- $324,750
- Closing costs
- $38,970
- Reserves months
- —
- Total cash needed
- —
Loan-product check · same deal, 3 products live
Conventional
25% down · 7.5% · 30yr
- Down + closing
- —
- Monthly P&I
- —
- Monthly cashflow
- —
- DSCR
- —
- Eligible?
- —
Personal DTI + credit; lowest rate.
DSCR
20% down · 8.5% · 30yr
- Down + closing
- —
- Monthly P&I
- —
- Monthly cashflow
- —
- DSCR
- —
- Eligible?
- —
No personal income docs; deal must DSCR.
Hard money
10% down · 12.0% · 12mo
- Down + closing
- —
- Monthly P&I
- —
- Monthly cashflow
- —
- DSCR
- —
- Eligible?
- —
Short-term bridge; refi at stabilization.
Rent comps 1 comps
| Address | Beds | Baths | Sqft | Rent | $/sqft | DOM | Units | Dist |
|---|---|---|---|---|---|---|---|---|
| 11445 N Bayshore Dr North Miami, FL | 3.0 | 3.0 | 2388 | $19,900 | $8.33 | 17d | 1 | 0.70mi |
Listing history 11 events
-
2026-06-18days on market $1,299,000 Active 235 DOM
-
2026-06-17days on market $1,299,000 Active 234 DOM
-
2026-06-16days on market $1,299,000 Active 233 DOM
-
2026-06-15days on market $1,299,000 Active 232 DOM
-
2026-06-13days on market $1,299,000 Active 230 DOM
-
2026-06-09days on market $1,299,000 Active 226 DOM
-
2026-06-08days on market $1,299,000 Active 225 DOM
-
2026-06-08days on market $1,299,000 Active 224 DOM
-
2026-06-04days on market $1,299,000 Active 221 DOM
-
2026-06-03remarks 677-char remark
-
2026-06-03$1,299,000 Active 220 DOM
ⓘ Source: listings_history table (triggers on properties + properties_extension) + one-shot
backfill from property_details.listing_events for pre-trigger history.
Tax reassessment forecast FL · Resets to sale price
- Current annual tax
- $3,622 · $302/mo
- Projected year-2 tax
- $10,782 · $898/mo
- Expected delta
- +$7,160/yr (+$597/mo · 197.7%)
ⓘ Screening estimate from a state-policy table — verify with the county assessor before closing.
Climate risk First Street
- Flood 7/10 Severe FEMA zone AE · 77% chance over 30 yrs
- Wildfire 1/10 Low
- Heat 10/10 Extreme 7 d/yr ≥103°F today · 28 d/yr by 30 yrs out
- Wind 10/10 Extreme 99% chance of damaging wind over 30 yrs
- Air quality 2/10 Low 1 unhealthy d/yr today · 2 by 30 yrs out
Nearby sold comps map
Loading sold comps map…
Walkable amenities ~0.75 mi
Loading nearby amenities…
Taxation est. · year 1
- Rental income
- $55,686
- − Mortgage interest
- −$72,764
- − Property taxes
- −$3,622
- − Insurance
- −$11,614
- − Repairs & maintenance
- −$4,455
- − Management
- −$4,455
- − Depreciation
- −$37,789
- Taxable loss
- −$79,012
- Est. tax savings @ 24.0%
- +$18,963
- After-tax cash flow
- $-34,025/yr
For passive investors: Depreciation is non-cash, so a rental often shows a tax loss while cash-flowing — sheltering income. Rental losses are passive: they offset passive income freely, and up to $25,000/yr can offset ordinary (W-2) income if you actively participate and your MAGI is under $100k (phasing out to $0 by $150k); unused losses carry forward. On sale, claimed depreciation is recaptured at up to 25%, and gains may owe capital-gains tax (a 1031 exchange can defer both). Figures are a year-1 estimate at your 24.0% rate — not tax advice; consult a CPA.
Schools (NCES district)
- District
- Miami-Dade
- NCES district ID
- 1200390
- Math proficiency
- 45% ▼ -16.00%
- Reading proficiency
- 54% ▼ -5.00%
- Median HH income
- $43,928
- Composite
- 41.76/100
- National rank
- #3397
- State rank
- #40 of 73 in FL
Livability — Miami Shores
- Score
- 80/100
- State rank
- #130
- US rank
- #1936
Category grades
Schools grade is shown separately in the Schools card above.
Census & demographics
- County
- Miami-Dade County · 2,697,751 people
- Metro
- Miami-Fort Lauderdale-Pompano Beach, FL
- Population (ZIP)
- 54,814
- Household income
- $58,325
- Rent vs Own
- Severe rent burden
- 3226.0
Population outlook (Miami-Dade County) Hauer SSP2
- Today (2025)
- 3,126,439 people
- By 2030
- 3,325,765 · +6.4%
- By 2040
- 3,697,561 · +18.3%
- By 2050
- 4,012,134 · +28.3%
- By 2075
- 4,605,612 · +47.3%
- By 2100
- 4,866,598 · +55.7%
Race, ethnicity, and origin ACS 2023
- Neighborhood character
- Diverse neighborhood (Simpson 0.58)
- Race & ethnicity
- Black 56% Hispanic / Latino 31% Two or more races 18% White 8% Asian 2%
- Hispanic origin (detail)
- Puerto Rican 4% Cuban 7% Dominican 4% Salvadoran 1%
- Common ancestry
- Hispanic 35% Estonian 1% Lithuanian 1%
- Foreign-born
- 51% · Canada, Jamaica, Dominican Republic
- Languages at home
- 25% English-only · French/Haitian/Cajun 41% Spanish 30% Other Indo-European 2%
Political lean MEDSL · Miami-Dade
- 2024 margin
- R (+11.4) · D 43.9% · R 55.4%
- 2008→2024 swing
- -27.6pp toward R · 2008: 16.1pp · 2024: -11.4pp
- All cycles
- 2024: R+11.4 2020: D+7.3 2016: D+29.6 2012: D+23.7 2008: D+16.1
Not yet ingested
- Civics
- —
Market trends
- HPI YoY
- ▼ -492.86%
- Current HPI
- 630.6932
- Rent YoY
- ▼ -0.73%
- Metro
- Miami-Fort Lauderdale-Pompano Beach, FL
- State GDP YoY
- ▲ 3.28%
- F500 in state
- 36
Industry mix (Fortune 500 HQ in FL)
| Industry | F500 HQs | Revenue |
|---|---|---|
| Industrial Technology | 2 | $29B |
|
||
| Insurance | 2 | $17B |
|
||
| Retail | 1 | $60B |
|
||
| Technology Distribution | 1 | $58B |
|
||
| Homebuilding | 1 | $35B |
|
||
| Technology Manufacturing | 1 | $35B |
|
||
Price history
+1523.8% since first listed22 events — show timeline
- 2026-05-18 Price Changed $1,299,000 MARMLS
- 2026-03-14 Price Changed $769,000 MARMLS
- 2026-03-12 Price Changed $1,500,000 MARMLS
- 2026-03-05 Price Changed $769,000 MARMLS
- 2025-12-05 Price Changed $824,900 MARMLS
- 2025-12-02 Relisted — MARMLS
- 2025-12-02 Price Changed $875,000 MARMLS
- 2025-11-21 Pending — MARMLS
- 2025-11-15 Price Changed $899,500 MARMLS
- 2025-11-15 Relisted — MARMLS
- 2025-11-15 Pending — MARMLS
- 2025-11-15 Price Changed $967,000 MARMLS
- 2025-11-10 Relisted — MARMLS
- 2025-11-06 Price Changed $899,500 MARMLS
- 2025-10-14 Listed $503,500 MARMLS
- 2014-09-07 Listing Removed — MARMLS
- 2014-08-13 Sold (Public Records) $55,000 Public Records
- 2014-03-24 Listed $125,000 MARMLS
- 2000-03-01 Sold (Public Records) $113,000 Public Records
- 1999-12-23 Sold (Public Records) $113,000 Public Records
- 1991-08-09 Sold (Public Records) $95,000 Public Records
- 1987-04-01 Sold (Public Records) $80,000 Public Records
Property tax history
+12.6%/yrLatest (2025): $3,622 · +4.1% YoY. Source: county tax records.
Cash-flow waterfall
monthlySold comps — $/sqft
last 12 mo · ≤1 miLoading sold comps…