 🏷️ Likely Rental
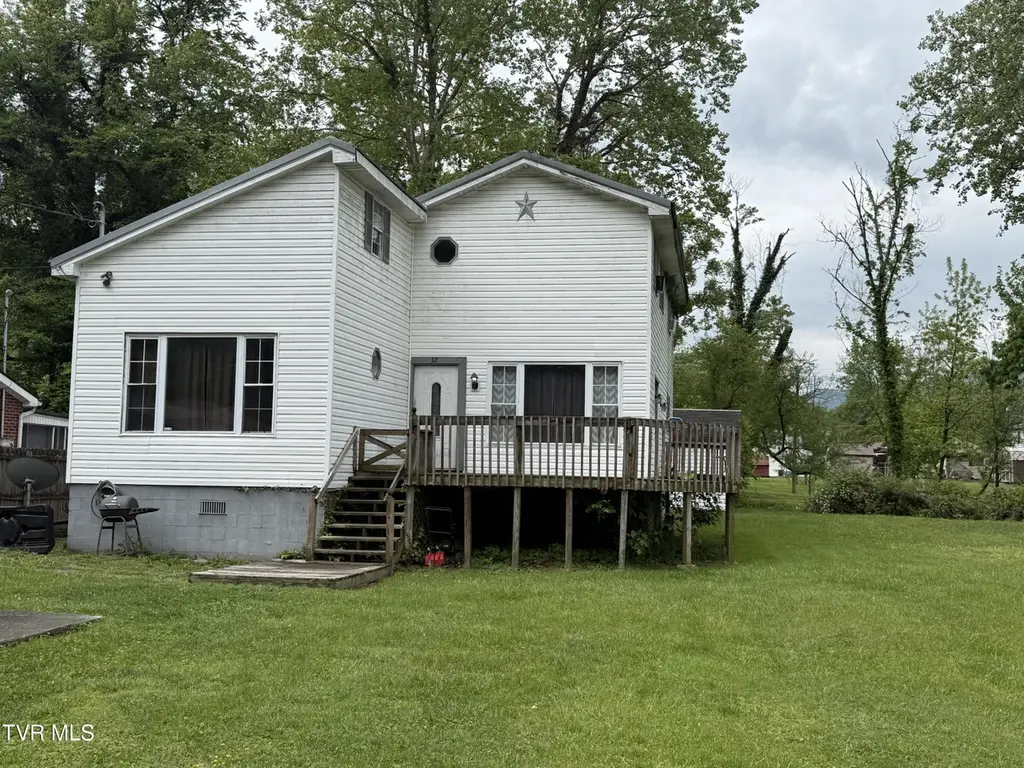
323 Hamblen St · Big Stone Gap, VA
Flood risk 6/10 · Moderate
- FEMA flood zone
- AE
- Chance of flooding over 30 yrs
- 0.73%
- Est. flood insurance / yr
- $2,026 – $9,024
Fire risk 4/10 · Minor
- Est. fire insurance / yr
- $666 – $1,236
Heat risk 4/10 · Minor
- Hot days now (above 97°F)
- 8 days/yr
- Hot days in 30 yrs
- 23 days/yr
Wind risk 2/10 · Minimal
- Chance of severe wind over 30 yrs
- —
Air-quality risk 1/10 · Minimal
- Unhealthy air days now
- 0 days/yr
- Unhealthy air days in 30 yrs
- 0 days/yr
Risk factors via First Street. Map © Google.
Why this score? — see what drove the C+ grade
The composite is a weighted blend of 9 inputs, each scored 0–100. Each bar is that input's sub-score; the figure is the points it added to the 100-point composite (weight × sub-score).
- Cash flow +25.8/30.0
- DSCR +8.6/10.0
- ARV discount +7.5/15.0
- Schools +6.3/10.0
- 1% rule +5.9/10.0
- Livability +3.4/5.0
- Rent growth +2.5/5.0
- Condition / age +2.5/5.0
- Appreciation +0.0/10.0
$99,900
🖨 Deal sheet (PDF) 📄 Offer letter ✓ Due diligence
Listing remarks
Unique investment opportunity in the heart of Big Stone Gap! This 4 bedroom, 2 bathroom home is priced well below tax assessment and already has a current tenant in place, making it an excellent opportunity for investors looking for immediate income potential. Featuring beautiful hardwood floors throughout, this property offers plenty of character and space while also being ideal for first-time home buyers looking to build equity. Enjoy scenic mountain views while still being conveniently located close to shopping, dining, schools, and all of the town's amenities. Inside photos coming soon! Don't miss your chance to own this affordable property with endless potential.
Key facts
- Current tenant
- Hardwood floors
- Conveniently located
Tags
Property features AI
Exterior
- Parking: Asphalt parking
- Utilities: Public water; Public sewer
- Home design: Single-family house; Two levels
- Construction: Vinyl siding; Metal roof; Block foundation; Built as a house
- Exterior features: Deck; Level topography
Interior
- Kitchen: Range; Refrigerator
- Flooring: Carpet; Hardwood; Vinyl
- Bathrooms: Two full bathrooms
- Heating & cooling: Electric heating; Has cooling (type listed as other)
- Interior features: Range and refrigerator included; Block basement; Nine total rooms
Neighborhood map
What this means for you Summary
Snapshot
- This is a 4-bed/1.0-bath single-family listed at $100k.
Deal economics
- At list price, monthly cash flow is $-218 ($-3k/yr) — negative.
- To cash-flow at today's rent, offer at most $61k (38.5% below list).
- Meets the 1% rule at list price ($1k rent vs $100k).
- Recommended offer: $61k (38.5% below list) — sets the bar for cash-flow.
- Cap rate 9.2% vs local median 3.4% in Big Stone Gap — top-decile yield for the area; either an underpriced asset or a hidden risk that comps aren't pricing in. Stress-test before assuming the spread holds.
Location & tenants
- Location reads 68/100 on livability (#279 in VA) — a middle-class / working-renter tenant base. Strengths: cost of living A+, housing A+, crime A-; Watch: amenities F, commute F, employment F.
- Wise County Public School District (town): math 74% / reading 79% proficiency, ranked #11 of 131 in VA (top 8%) — strong family-tenant draw, lease renewals of 3-5y typical.
- Zoned schools: Union Primary (math 72% / reading 79%, grade A, #207 of 1,108 statewide, top 19%, 861 students, 84% FRL); Union Middle (math 58% / reading 70%, grade B+, #127 of 342 statewide, top 37%, 583 students, 89% FRL); Union High (math 57% / reading 77%, grade B, #185 of 319 statewide, top 61%, 601 students, 86% FRL) — zoned schools average 86% FRL vs 55% district-wide (31 pts higher); higher-poverty schools than district average — tighter screening recommended.
- Market conditions: 43 active listings in the ZIP; 17 units permitted in Wise County in 2024 (0 in 5+ unit buildings).
Forward outlook
- Local home prices are declining (-3.0%/yr); year-one equity from $691 of loan paydown is wiped out by about $3k of value loss. Plan a longer hold.
- Wise County population projected at -26% by 2050 — secular population decline; favor cash flow + early exit over multi-decade hold.
Negotiation context
- It's been on market 33 days — a 3% lower offer ($97k) is reasonable based on typical stale-listing flexibility.
- Current owner paid $37k; list at $100k implies a 170% gain — meaningful room to come down on a strong offer.
Risks & watch-outs
- Watch-outs: flood insurance adds $460/mo.
- Climate carrying-cost: in FEMA flood zone AE (mandatory federal flood insurance) — expect insurance premiums to compound above CPI over the hold.
Questions for the listing agent
- What do current leases actually rent for vs. the listed asking? Can we see a recent rent roll and the last 12 months of T-12 income?
- It's been on market 33 days. Have you received any prior offers? Is the seller open to a 38% concession, seller financing, or rate buy-down credit?
- What's the actual annual flood-insurance premium (NFIP or private), and is the property in a SFHA with mandatory coverage?
- Is there a deadline driving the sale (1031 exchange, divorce, estate, relocation)? That informs how much negotiation room exists.
- Schools are B-rated — typically a magnet for longer-tenancy family renters. What's the average tenant stay here, and is there a school-zone premium baked into asking?
- This sits on a lake — are riparian / water-frontage rights deeded with the parcel? Any dock permits, shoreline easements, or HOA water-use restrictions?
- What's the documented flood / surge / shoreline-erosion history here (FEMA AND non-FEMA — e.g., storm surge, creek backup, septic-field saturation)?
- Any water-quality or seasonal algae-bloom issues that affect tenant satisfaction or short-term-rental demand?
- What's the average days-on-market for RENTAL listings here right now (not sales)? A rising rental-DOM trend means longer vacancies and softer asking-rent achievability than the comps imply.
- What's the recent tenant-quality profile in this submarket — average credit score on applications, eviction rate, late-payment / NSF rate, and stable-employment percentage? A property-management company in the area should have these aggregated.
- How much new for-sale + rental construction is in the pipeline within 1–3 miles? Heavy new supply typically softens prices + rents 12–24 months out; constrained supply supports both.
Investment metrics
- 1% rule
- 1.09% ✓
- Cap rate
- 9.21%
- Cash-on-cash
- 10.41%
- DSCR
- 1.46
- GRM
- 7.6
CMA / ARV
- ARV (median comp)
- $215,487
- List price
- $99,900
- Delta
- -53.64%
- Verdict
- UNDERPRICED
- Comps
- 20 within 1.0 mi
Show comp detail 4 sales within ~0.75 mi
| Address | Dist | Beds/Ba | Sqft | Sold | Price | $/sf | Match |
|---|---|---|---|---|---|---|---|
| 15 Proctor Cir | 0.44mi | 4/1.5 | 2,071 (+6%) | 5mo | $275,000 | $133 | 63 |
| 250 Wallens Ridge Blvd | 0.61mi | 4/2.0 | 2,050 (+5%) | 9mo | $220,000 | $107 | 52 |
| 205 Wood Ave | 0.57mi | 3/2.0 (-1) | 1,700 (-13%) | 3mo | $138,300 | $81 | 40 |
| 314 Lexie St | 0.66mi | 4/3.0 | 2,104 (+8%) | 22mo | $245,000 | $116 | 30 |
Match score weights: distance 35% · size 25% · config 20% · recency 20%. Top-matched comps best support the ARV.
Projected returns pro-forma
-3.0% appreciation · 3.0% rent growth · sell at horizon
- IRR
- -32.5%
- Equity multiple
- -0.07×
- Total profit
- $-29,798
- Equity at exit
- $14,895
- IRR
- -36.0%
- Equity multiple
- -0.53×
- Total profit
- $-42,763
- Equity at exit
- $8,638
Cash invested: $27,972 (down + closing). Projections, not guarantees.
Landlord ↔ Tenant lean methodology
- Overall (STATE)
- 55 Moderately Landlord-Leaning
- State Virginia
- 55 Moderately Landlord-Leaning · D+2
- County
- — inherits STATE
- City
- — inherits STATE
ZIP-level market 24219
- Home prices YoY
- -24.6%
- Active inventory
- 43
- Price-to-rent
- 7.6×
Monthly cashflow live
- Estimated rent
- $1,092 medium interval (Pro) →
- Mortgage (P&I)
- −$524
- Tax from tax record
- −$54 /mo · $650/yr
- Insurance
- −$42
- Flood insurance flood zone
- −$460 /mo · $5,525/yr
- HOA
- −$0
- Vacancy / Maint / Mgmt
- −$229
- Net cashflow
- $-218
Break-even live
Sensitivity live
| Price | -10% $-161 | -5% $-189 | +0% $-218 | +5% $-246 | +10% $-274 |
|---|---|---|---|---|---|
| Rent | -10% $-304 | -5% $-261 | +0% $-218 | +5% $-175 | +10% $-131 |
| Rate | -1.0pp $-167 | -0.5pp $-192 | base $-218 | +0.5pp $-244 | +1.0pp $-270 |
UW: 25.0% down · 7.5% · 30yr · 1.5% tax · 5.0% vac · 8.0% maint · 8.0% mgmt
Financing live
Cash to close
- Down payment
- $24,975
- Closing costs
- $2,997
- Reserves months
- —
- Total cash needed
- —
Loan-product check · same deal, 3 products live
Conventional
25% down · 7.5% · 30yr
- Down + closing
- —
- Monthly P&I
- —
- Monthly cashflow
- —
- DSCR
- —
- Eligible?
- —
Personal DTI + credit; lowest rate.
DSCR
20% down · 8.5% · 30yr
- Down + closing
- —
- Monthly P&I
- —
- Monthly cashflow
- —
- DSCR
- —
- Eligible?
- —
No personal income docs; deal must DSCR.
Hard money
10% down · 12.0% · 12mo
- Down + closing
- —
- Monthly P&I
- —
- Monthly cashflow
- —
- DSCR
- —
- Eligible?
- —
Short-term bridge; refi at stabilization.
Listing history 12 events
-
2026-06-12status $99,900 Pending 33 DOM
-
2026-06-09days on market $99,900 Active 33 DOM
-
2026-06-08days on market $99,900 Active 32 DOM
-
2026-06-08days on market $99,900 Active 31 DOM
-
2026-06-07days on market $99,900 Active 30 DOM
-
2026-06-03days on market $99,900 Active 27 DOM
-
2026-06-02days on market $99,900 Active 26 DOM
-
2026-06-01days on market $99,900 Active 25 DOM
-
2026-05-31days on market $99,900 Active 24 DOM
-
2026-05-07$99,900 Active 676-char remark
-
2012-02-10soldstatus $37,000
-
2010-01-22soldstatus $32,000
ⓘ Source: listings_history table (triggers on properties + properties_extension) + one-shot
backfill from property_details.listing_events for pre-trigger history.
Tax reassessment forecast VA · Resets to sale price
- Current annual tax
- $650 · $54/mo
- Projected year-2 tax
- $819 · $68/mo
- Expected delta
- +$169/yr (+$14/mo · 26.0%)
ⓘ Screening estimate from a state-policy table — verify with the county assessor before closing.
Climate risk First Street
- Flood 6/10 Major FEMA zone AE · 73% chance over 30 yrs
- Wildfire 4/10 Moderate
- Heat 4/10 Moderate 8 d/yr ≥97°F today · 23 d/yr by 30 yrs out
- Wind 2/10 Low
- Air quality 1/10 Low 0 unhealthy d/yr today · 0 by 30 yrs out
Nearby sold comps map
Loading sold comps map…
Walkable amenities ~0.75 mi
Loading nearby amenities…
Taxation est. · year 1
- Rental income
- $13,099
- − Mortgage interest
- −$5,596
- − Property taxes
- −$650
- − Insurance
- −$6,024
- − Repairs & maintenance
- −$1,048
- − Management
- −$1,048
- − Depreciation
- −$2,906
- Taxable loss
- −$4,173
- Est. tax savings @ 24.0%
- +$1,002
- After-tax cash flow
- $-1,611/yr
For passive investors: Depreciation is non-cash, so a rental often shows a tax loss while cash-flowing — sheltering income. Rental losses are passive: they offset passive income freely, and up to $25,000/yr can offset ordinary (W-2) income if you actively participate and your MAGI is under $100k (phasing out to $0 by $150k); unused losses carry forward. On sale, claimed depreciation is recaptured at up to 25%, and gains may owe capital-gains tax (a 1031 exchange can defer both). Figures are a year-1 estimate at your 24.0% rate — not tax advice; consult a CPA.
Schools (NCES district)
- District
- Wise County Public School District
- NCES district ID
- 5104080
- Math proficiency
- 74% ▼ -20.00%
- Reading proficiency
- 79% ▼ -7.00%
- Median HH income
- $35,624
- Composite
- 63.37/100
- National rank
- #625
- State rank
- #11 of 131 in VA
Livability — Big Stone Gap
- Score
- 68/100
- State rank
- #279
- US rank
- #10035
Category grades
Schools grade is shown separately in the Schools card above.
Census & demographics
- Census place
- Big Stone Gap, VA
- Population (ZIP)
- 10,416
Population outlook (Wise County) Hauer SSP2
- Today (2025)
- 35,714 people
- By 2030
- 33,742 · -5.5%
- By 2040
- 29,870 · -16.4%
- By 2050
- 26,233 · -26.5%
- By 2075
- 18,296 · -48.8%
- By 2100
- 12,147 · -66.0%
Race, ethnicity, and origin ACS 2023
- Neighborhood character
- Predominantly White (85%)
- Race & ethnicity
- White 85% Black 10% Two or more races 3%
- Common ancestry
- Slovak 3% Serbian 1% Lithuanian 1%
- Foreign-born
- 1% · Canada
- Languages at home
- 98% English-only · Spanish 1%
Political lean MEDSL · Wise
- 2024 margin
- Solid R (+63.3) · D 18.1% · R 81.4%
- 2008→2024 swing
- -35.6pp toward R · 2008: -27.7pp · 2024: -63.3pp
- All cycles
- 2024: R+63.3 2020: R+61.7 2016: R+62.0 2012: R+48.8 2008: R+27.7
Not yet ingested
- Civics
- —
Market trends
- HPI YoY
- ▼ -47.21%
- Current HPI
- 144.2927
- Rent YoY
- —
- Metro
- —
- State GDP YoY
- ▲ 2.40%
- F500 in state
- 50
Industry mix (Fortune 500 HQ in VA)
| Industry | F500 HQs | Revenue |
|---|---|---|
| Aerospace / Defense | 4 | $236B |
|
||
| Technology / Defense | 3 | $32B |
|
||
| Financial Services | 2 | $176B |
|
||
| Utilities | 2 | $27B |
|
||
| Insurance | 2 | $25B |
|
||
| Technology | 2 | $15B |
|
||
Price history
+212.2% since first listed4 events — show timeline
- 2026-06-09 Pending — TVRMLS
- 2026-05-07 Listed $99,900 TVRMLS
- 2012-02-10 Sold (Public Records) $37,000 Public Records
- 2010-01-22 Sold (Public Records) $32,000 Public Records
Property tax history
+2.2%/yrLatest (2025): $650 · +0.0% YoY. Source: county tax records.
Cash-flow waterfall
monthlySold comps — $/sqft
last 12 mo · ≤1 miLoading sold comps…