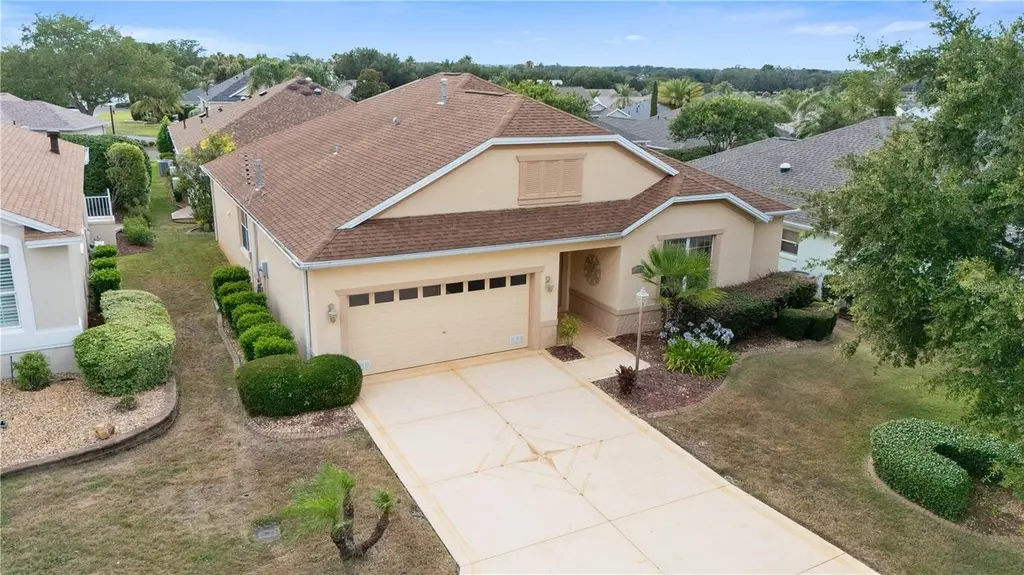
1570 Gifford Ct · The Villages, FL
Flood risk 1/10 · Minimal
- FEMA flood zone
- X (unshaded)
- Chance of flooding over 30 yrs
- 0.0%
- Est. flood insurance / yr
- $507 – $1,088
Fire risk 4/10 · Minor
- Est. fire insurance / yr
- $947 – $1,759
Heat risk 9/10 · Severe
- Hot days now (above 108°F)
- 7 days/yr
- Hot days in 30 yrs
- 23 days/yr
Wind risk 9/10 · Severe
- Chance of severe wind over 30 yrs
- 99.0%
Air-quality risk 3/10 · Minor
- Unhealthy air days now
- 2 days/yr
- Unhealthy air days in 30 yrs
- 3 days/yr
Risk factors via First Street. Map © Google.
Why this score? — see what drove the D grade
The composite is a weighted blend of 9 inputs, each scored 0–100. Each bar is that input's sub-score; the figure is the points it added to the 100-point composite (weight × sub-score).
- Cash flow +11.9/30.0
- ARV discount +11.1/15.0
- Schools +5.2/10.0
- 1% rule +3.5/10.0
- DSCR +3.5/10.0
- Rent growth +3.5/5.0
- Livability +3.5/5.0
- Condition / age +2.5/5.0
- Appreciation +0.0/10.0
$475,000
🖨 Deal sheet (PDF) 📄 Offer letter ✓ Due diligence
Listing remarks MLS
LOCATION, LOCATION AND NO BOND!!! The Bridgeport Model in The Villages of Mallory cannot be beat for all of the amenities you want. Close to Lake Sumter Landing, NO BOND and upgrades in the home. Kitchen has all stainless steel appliances, gas stove and microwave for the love of cooking. Dark cabinets Roll outs in all the kitchen cabinets make storage a breeze. Real Maple wood flooring in living and dining area. Model had slight modifications from the original plan which added extra space in dining and master bedroom. Master bath has double sinks and walk-in shower. New carpet in bedrooms in 2007. Ceramic tile in kitchen and baths. This home boasts the half bath in the gallery and split plan to allow guest privacy. Bedroom 2 has a murphy bed built in which will stay with home. Inside laundry and outside patio space. Can't miss this one. Furnishings are available but not included.
Key facts
- Cul-de-sac location
- Outdoor patio
- New roof
Tags
Property features AI
Finance
- Other: CDD present
- Financial info: Other annual assessment shown; No lease restrictions indicated
- HOA & community: Association amenities include pool, recreation facilities, golf course, pickleball courts; Community features: deed restrictions, golf carts allowed, golf, park, pool, racquetball, tennis courts; Senior community; Pets allowed (cats and dogs); Association fee includes pool and recreational facilities; Total monthly association fees listed as $204; Total annual association fees listed as $2,448
Exterior
- Parking: Attached garage; 2-car garage; Garage door opener
- Utilities: Public water; Public sewer; Natural gas available and connected; Sewer connected; Water connected; Cable available; Underground utilities; Sprinkler meter (irrigation equipment)
- Home design: Single family residence; One story; Faces east; Residential property
- Construction: Block and stucco construction; Shingle roof; Slab foundation; Built as Bridgeport model
- Exterior features: Enclosed patio/porch; Rain gutters; Sprinkler meter; Mature landscaping; Cul-de-sac lot; Asphalt/paved road; Publicly maintained road; Planned unit development
Interior
- Kitchen: Dishwasher; Range; Microwave; Refrigerator; Solid surface counters; Eat-in kitchen
- Bedrooms: 3 bedrooms
- Flooring: Hardwood; Tile; Wood
- Bathrooms: 2 full bathrooms; 1 half bathroom
- Heating & cooling: Central heating (natural gas); Central air conditioning; Electric fireplace
- Interior features: Cathedral ceilings; Coffered ceilings; Tray ceiling; High ceilings; Ceiling fans; Eat-in kitchen; Solid surface counters; Blinds
- Laundry & utility: Inside laundry room; Washer; Dryer
Neighborhood map
What this means for you Summary
Snapshot
- This is a 3-bed/2.5-bath single-family listed at $475k.
Deal economics
- At list price, monthly cash flow is $-120 ($-1k/yr) — negative.
- To cash-flow at today's rent, offer at most $454k (4.5% below list).
- To meet the 1% rule (rent ≥ 1% of price), the offer needs to be $403k (15.2% below list).
- Recommended offer: $403k (15.2% below list) — sets the bar for 1% rule.
- Cap rate 6.0% vs local median 5.0% in The Villages — meaningfully above typical; check what's discounted (condition, days-on-market, listing class) to confirm the premium yield is real.
Location & tenants
- Location reads 70/100 on livability (#431 in FL) — a middle-class / working-renter tenant base. Strengths: crime A+, housing A, employment B+; Watch: amenities F, commute F, health & safety F.
- Sumter (rural): math 61% / reading 61% proficiency, ranked #11 of 73 in FL (top 15%) — acceptable for families but not a draw, mixed tenant base, ~2y average lease.
- Zoned schools: Wildwood Elementary School (math 49% / reading 52%, grade D+, #1,055 of 2,144 statewide, top 50%, 940 students, 76% FRL); South Sumter Middle School (math 55% / reading 54%, grade B-, #183 of 571 statewide, top 34%, 897 students, 61% FRL) — zoned schools average 68% FRL vs 51% district-wide (18 pts higher); higher-poverty schools than district average — tighter screening recommended.
- Market conditions: Rents rising (+3.9%/yr); 551 active listings in the ZIP; 4 comparable units currently listed for rent nearby; rentals at typical pace (median 23d on market — plan ~3-4 weeks tenant-placement turnaround); 3,961 units permitted in Sumter County in 2024 (248 in 5+ unit buildings).
- At $4,026/mo this rent would consume 65% of the median local household income ($74k/yr) (locally 987% of renters already pay >50% of income on rent) — very limited rent-growth headroom before tenants either downsize or default.
Forward outlook
- Local home prices are declining (-3.0%/yr); year-one equity from $3k of loan paydown is wiped out by about $14k of value loss. Plan a longer hold.
- Sumter County population projected at +45% by 2050 — long-run rental-demand tailwind backs the buy-and-hold thesis.
Negotiation context
- Only 10 days on market — expect competitive offers; lowballing is unlikely to land.
- 4 sale attempts since 15y ago with the ask held roughly flat each time — persistent listings suggest the price (not the market) is what's stuck; bring a comps-based counter.
- Current owner paid $290k; list at $475k implies a 64% gain — meaningful room to come down on a strong offer.
Risks & watch-outs
- Climate carrying-cost: severe wind risk, 99% chance of damaging wind over 30y; extreme-heat days projected 7→23/yr by 2055 (HVAC capex compounding) — expect insurance premiums to compound above CPI over the hold.
Questions for the listing agent
- What do current leases actually rent for vs. the listed asking? Can we see a recent rent roll and the last 12 months of T-12 income?
- What does the HOA fee cover, when was the last increase, and are there any pending special assessments or reserve-fund shortfalls?
- Is there a deadline driving the sale (1031 exchange, divorce, estate, relocation)? That informs how much negotiation room exists.
- Schools are A-rated — typically a magnet for longer-tenancy family renters. What's the average tenant stay here, and is there a school-zone premium baked into asking?
- The area grade is low — what's the realistic commute time and amenity access for the typical tenant pool here? Any planned neighborhood developments (good or bad) we should know about?
- What's the average days-on-market for RENTAL listings here right now (not sales)? A rising rental-DOM trend means longer vacancies and softer asking-rent achievability than the comps imply.
- What's the recent tenant-quality profile in this submarket — average credit score on applications, eviction rate, late-payment / NSF rate, and stable-employment percentage? A property-management company in the area should have these aggregated.
- How much new for-sale + rental construction is in the pipeline within 1–3 miles? Heavy new supply typically softens prices + rents 12–24 months out; constrained supply supports both.
Investment metrics
- 1% rule
- 0.85% ✗
- Cap rate
- 5.99%
- Cash-on-cash
- -1.08%
- DSCR
- 0.95
- GRM
- 9.8
CMA / ARV
- ARV (on-the-fly)
- $516,879
- Comps found
- 12
Show comp detail 12 sales within ~0.75 mi
| Address | Dist | Beds/Ba | Sqft | Sold | Price | $/sf | Match |
|---|---|---|---|---|---|---|---|
| 1607 Mount Croghan Trl | 0.11mi | 3/2.5 | 2,075 (+2%) | 1mo | $525,000 | $253 | 91 |
| 1615 Snelling Ave | 0.08mi | 3/2.0 | 1,887 (-8%) | 0mo | $630,000 | $334 | 81 |
| 1485 Dalzell Ct | 0.30mi | 3/2.0 | 2,025 (-1%) | 3mo | $665,000 | $328 | 80 |
| 1637 Mount Croghan Trl | 0.15mi | 3/2.0 | 1,887 (-8%) | 1mo | $457,500 | $242 | 77 |
| 1466 Perry Ln | 0.25mi | 3/2.0 | 1,927 (-6%) | 2mo | $425,000 | $221 | 75 |
| 550 Little River Path | 0.42mi | 3/2.0 | 2,012 (-2%) | 3mo | $720,000 | $358 | 74 |
| 329 Bishopville Loop | 0.53mi | 3/2.5 | 2,075 (+2%) | 1mo | $475,000 | $229 | 72 |
| 565 Society Hill Cir | 0.37mi | 3/2.0 | 1,899 (-7%) | 2mo | $600,000 | $316 | 67 |
| 778 Moore Ter | 0.67mi | 3/2.0 | 2,005 (-2%) | 2mo | $480,000 | $239 | 62 |
| 533 Inner Cir | 0.62mi | 3/2.5 | 2,171 (+6%) | 1mo | $660,000 | $304 | 60 |
| 1348 Honea Path | 0.66mi | 3/2.0 | 1,912 (-6%) | 0mo | $434,000 | $227 | 56 |
| 879 Astor Way | 0.56mi | 3/2.0 | 1,861 (-9%) | 2mo | $335,000 | $180 | 56 |
Match score weights: distance 35% · size 25% · config 20% · recency 20%. Top-matched comps best support the ARV.
Projected returns pro-forma
-3.0% appreciation · 3.92% rent growth · sell at horizon
- IRR
- -17.0%
- Equity multiple
- 0.39×
- Total profit
- $-80,782
- Equity at exit
- $70,824
- IRR
- -7.3%
- Equity multiple
- 0.52×
- Total profit
- $-64,168
- Equity at exit
- $41,069
Cash invested: $133,000 (down + closing). Projections, not guarantees.
Landlord ↔ Tenant lean methodology
- Overall (STATE)
- 87 Strongly Landlord-Friendly
- State Florida
- 87 Strongly Landlord-Friendly · R+3
- County
- — inherits STATE
- City
- — inherits STATE
ZIP-level market 32162
- Home prices YoY
- -6.9%
- Rents YoY
- 3.9%
- Active inventory
- 551
- Price-to-rent
- 9.8×
Monthly cashflow live
- Estimated rent
- $4,026 medium interval (Pro) →
- Mortgage (P&I)
- −$2,491
- Tax from tax record
- −$408 /mo · $4,896/yr
- Insurance
- −$198
- HOA
- −$204
- Vacancy / Maint / Mgmt
- −$846
- Net cashflow
- $-120
Break-even live
Sensitivity live
| Price | -10% $149 | -5% $14 | +0% $-120 | +5% $-254 | +10% $-389 |
|---|---|---|---|---|---|
| Rent | -10% $-438 | -5% $-279 | +0% $-120 | +5% $39 | +10% $198 |
| Rate | -1.0pp $119 | -0.5pp $1 | base $-120 | +0.5pp $-243 | +1.0pp $-368 |
UW: 25.0% down · 7.5% · 30yr · 1.5% tax · 5.0% vac · 8.0% maint · 8.0% mgmt
Financing live
Cash to close
- Down payment
- $118,750
- Closing costs
- $14,250
- Reserves months
- —
- Total cash needed
- —
Loan-product check · same deal, 3 products live
Conventional
25% down · 7.5% · 30yr
- Down + closing
- —
- Monthly P&I
- —
- Monthly cashflow
- —
- DSCR
- —
- Eligible?
- —
Personal DTI + credit; lowest rate.
DSCR
20% down · 8.5% · 30yr
- Down + closing
- —
- Monthly P&I
- —
- Monthly cashflow
- —
- DSCR
- —
- Eligible?
- —
No personal income docs; deal must DSCR.
Hard money
10% down · 12.0% · 12mo
- Down + closing
- —
- Monthly P&I
- —
- Monthly cashflow
- —
- DSCR
- —
- Eligible?
- —
Short-term bridge; refi at stabilization.
Rent comps 4 comps
| Address | Beds | Baths | Sqft | Rent | $/sqft | DOM | Units | Dist |
|---|---|---|---|---|---|---|---|---|
| 898 Moses Loop The Villages, FL | 3.0 | 2.0 | 1911 | $2,600 | $1.36 | 23d | 1 | 0.76mi |
| 2111 Jem Path The Villages, FL | 3.0 | 2.0 | 2000 | $5,800 | $2.90 | 23d | 1 | 0.84mi |
| 731 Baisley Trl The Villages, FL | 2.0 | 2.0 | 1512 | $4,500 | $2.98 | 23d | 1 | 1.14mi |
| 1220 Turtle Island Rd Lady Lake, FL | 3.0 | 2.0 | 1504 | $2,000 | $1.33 | 25d | 1 | 1.31mi |
HOA detail
- Monthly dues
- $204 · $2,448/yr
- Likely covers
- gas
Listing history 9 events
-
2026-06-22days on market $475,000 Active 10 DOM
-
2026-06-19days on market $475,000 Active 8 DOM
-
2026-06-18days on market $475,000 Active 7 DOM
-
2026-06-17days on market $475,000 Active 6 DOM
-
2026-06-16days on market $475,000 Active 5 DOM
-
2026-06-15days on market $475,000 Active 4 DOM
-
2026-06-14days on market $475,000 Active 2 DOM
-
2026-06-13remarks 677-char remark
-
2026-06-13$475,000 Active 1 DOM
ⓘ Source: listings_history table (triggers on properties + properties_extension) + one-shot
backfill from property_details.listing_events for pre-trigger history.
Tax reassessment forecast FL · Resets to sale price
- Current annual tax
- $4,896 · $408/mo
- Projected year-2 tax
- $4,896 · $408/mo
- Expected delta
- $0/yr ($0/mo · 0.0%)
ⓘ Screening estimate from a state-policy table — verify with the county assessor before closing.
Climate risk First Street
- Flood 1/10 Low FEMA zone X (unshaded) · 0% chance over 30 yrs
- Wildfire 4/10 Moderate
- Heat 9/10 Extreme 7 d/yr ≥108°F today · 23 d/yr by 30 yrs out
- Wind 9/10 Extreme 99% chance of damaging wind over 30 yrs
- Air quality 3/10 Moderate 2 unhealthy d/yr today · 3 by 30 yrs out
Nearby sold comps map
Loading sold comps map…
Walkable amenities ~0.75 mi
Loading nearby amenities…
Taxation est. · year 1
- Rental income
- $48,317
- − Mortgage interest
- −$26,607
- − Property taxes
- −$4,896
- − Insurance
- −$2,375
- − Repairs & maintenance
- −$3,865
- − Management
- −$3,865
- − HOA
- −$2,448
- − Depreciation
- −$13,818
- Taxable loss
- −$9,559
- Est. tax savings @ 24.0%
- +$2,294
- After-tax cash flow
- $854/yr
For passive investors: Depreciation is non-cash, so a rental often shows a tax loss while cash-flowing — sheltering income. Rental losses are passive: they offset passive income freely, and up to $25,000/yr can offset ordinary (W-2) income if you actively participate and your MAGI is under $100k (phasing out to $0 by $150k); unused losses carry forward. On sale, claimed depreciation is recaptured at up to 25%, and gains may owe capital-gains tax (a 1031 exchange can defer both). Figures are a year-1 estimate at your 24.0% rate — not tax advice; consult a CPA.
Schools (NCES district)
- District
- Sumter
- NCES district ID
- 1201800
- Math proficiency
- 61% ▼ -4.00%
- Reading proficiency
- 61% ▼ -2.00%
- Median HH income
- $48,240
- Composite
- 51.74/100
- National rank
- #1682
- State rank
- #11 of 73 in FL
Livability — The Villages
- Score
- 70/100
- State rank
- #431
- US rank
- #7363
Category grades
Schools grade is shown separately in the Schools card above.
Census & demographics
- Census place
- The Villages, FL
- County
- Sumter County · 110,591 people
- City population
- 83,973
- Metro
- The Villages, FL
- Population (ZIP)
- 55,424
- Household income
- $74,119
- Rent vs Own
- Severe rent burden
- 987.0
Population outlook (Sumter County) Hauer SSP2
- Today (2025)
- 161,172 people
- By 2030
- 180,083 · +11.7%
- By 2040
- 209,892 · +30.2%
- By 2050
- 234,186 · +45.3%
- By 2075
- 284,602 · +76.6%
- By 2100
- 317,039 · +96.7%
Race, ethnicity, and origin ACS 2023
- Neighborhood character
- Predominantly White (95%)
- Race & ethnicity
- White 95% Two or more races 2% Hispanic / Latino 2% Asian 1% Black 1%
- Common ancestry
- Romanian 7% Slovak 4% Lithuanian 4%
- Foreign-born
- 5% · Canada
- Languages at home
- 96% English-only · Spanish 1% Tagalog/Filipino 1%
Political lean MEDSL · Sumter
- 2024 margin
- Solid R (+37.6) · D 30.9% · R 68.6%
- 2008→2024 swing
- -10.6pp toward R · 2008: -27.0pp · 2024: -37.6pp
- All cycles
- 2024: R+37.6 2020: R+36.1 2016: R+39.2 2012: R+34.9 2008: R+27.0
Not yet ingested
- Civics
- —
Market trends
- HPI YoY
- ▼ -16.16%
- Current HPI
- 218.1956
- Rent YoY
- ▲ 3.92%
- Metro
- The Villages, FL
- State GDP YoY
- ▲ 3.28%
- F500 in state
- 36
Industry mix (Fortune 500 HQ in FL)
| Industry | F500 HQs | Revenue |
|---|---|---|
| Industrial Technology | 2 | $29B |
|
||
| Insurance | 2 | $17B |
|
||
| Retail | 1 | $60B |
|
||
| Technology Distribution | 1 | $58B |
|
||
| Homebuilding | 1 | $35B |
|
||
| Technology Manufacturing | 1 | $35B |
|
||
Price history
+76.0% since first listed10 events — show timeline
- 2026-06-11 Listed $475,000 Stellar MLS as Distributed by MLS Grid
- 2017-07-26 Sold (Public Records) $290,000 Public Records
- 2017-07-17 Sold (MLS) $290,000 Stellar MLS as Distributed by MLS Grid
- 2017-06-04 Pending — Stellar MLS as Distributed by MLS Grid
- 2017-05-11 Price Changed $304,900 Stellar MLS as Distributed by MLS Grid
- 2017-04-09 Listed $309,900 Stellar MLS as Distributed by MLS Grid
- 2011-10-08 Listing Removed — Stellar MLS as Distributed by MLS Grid
- 2011-10-03 Listing Removed — Stellar MLS as Distributed by MLS Grid
- 2011-03-08 Listed $269,900 Stellar MLS as Distributed by MLS Grid
- 2011-03-08 Listed $269,900 Stellar MLS as Distributed by MLS Grid
Property tax history
+3.0%/yrLatest (2025): $4,896 · -0.9% YoY. Source: county tax records.
Cash-flow waterfall
monthlySold comps — $/sqft
last 12 mo · ≤1 miLoading sold comps…