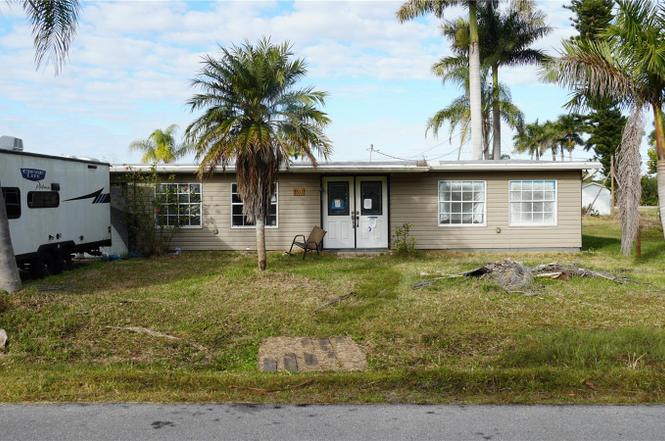
3513 Areca St · Charlotte Park, FL
Flood risk 10/10 · Severe
- FEMA flood zone
- AE
- Chance of flooding over 30 yrs
- 0.99%
- Est. flood insurance / yr
- $1,737 – $8,500
Fire risk 3/10 · Minor
- Est. fire insurance / yr
- $947 – $1,759
Heat risk 10/10 · Severe
- Hot days now (above 107°F)
- 7 days/yr
- Hot days in 30 yrs
- 28 days/yr
Wind risk 10/10 · Severe
- Chance of severe wind over 30 yrs
- 99.0%
Air-quality risk 3/10 · Minor
- Unhealthy air days now
- 2 days/yr
- Unhealthy air days in 30 yrs
- 2 days/yr
Risk factors via First Street. Map © Google.
Why this score? — see what drove the B grade
The composite is a weighted blend of 9 inputs, each scored 0–100. Each bar is that input's sub-score; the figure is the points it added to the 100-point composite (weight × sub-score).
- Cash flow +30.0/30.0
- 1% rule +10.0/10.0
- DSCR +10.0/10.0
- ARV discount +7.5/15.0
- Schools +4.6/10.0
- Livability +3.3/5.0
- Rent growth +2.5/5.0
- Condition / age +2.5/5.0
- Appreciation +0.0/10.0
$129,900
🖨 Deal sheet 📄 Offer letter ✓ Due diligence
Listing remarks
Under contract-accepting backup offers. Short Sale. Value-add opportunity in a centrally located Punta Gorda neighborhood. This 3-bedroom, 2-bath home, built in 1959, offers a 1-car garage, fenced yard, and public water and sewer—an important advantage for renovation projects in this area. The property appears to be mid-rehab and will require substantial additional work to complete, making it best suited for investors, renovators, or buyers seeking a project. Located in Flood Zone AE, buyers should verify insurance requirements. Convenient to downtown Punta Gorda, waterfront parks, shopping, dining, and major roadways, this property presents strong potential for the right buyer lookin
Key facts
- Waterfront parks
- Fenced yard
- Shopping
Tags
Neighborhood map
What this means for you Summary
Snapshot
- This is a 3-bed/1.0-bath single-family listed at $130k.
Deal economics
- At list price, monthly cash flow is $1k ($14k/yr) — positive.
- The deal already cash-flows at list — no discount required.
- Meets the 1% rule at list price ($3k rent vs $130k).
- Recommended offer: $122k (6.0% below list) — sets the bar for market timing.
- Cap rate 21.0% vs local median 4.3% in Charlotte Park — top-decile yield for the area; either an underpriced asset or a hidden risk that comps aren't pricing in. Stress-test before assuming the spread holds.
Location & tenants
- Location reads 66/100 on livability (#624 in FL) — a middle-class / working-renter tenant base. Strengths: crime A+, cost of living A+, housing A+; Watch: amenities F, commute F, health & safety D-.
- Charlotte (suburban): math 54% / reading 54% proficiency, ranked #22 of 73 in FL (top 30%) — acceptable for families but not a draw, mixed tenant base, ~2y average lease.
- Zoned schools: Sallie Jones Elementary School (math 75% / reading 74%, grade A, #230 of 2,144 statewide, top 12%, 694 students, 47% FRL); Charlotte High School (math 44% / reading 46%, grade D-, #228 of 667 statewide, top 35%, 1,994 students, 41% FRL).
- Market conditions: Rents soft (-0.1%/yr); 999 active listings in the ZIP; 23 comparable units currently listed for rent nearby; rentals at typical pace (median 21d on market — plan ~3-4 weeks tenant-placement turnaround); solid renter incomes; 4,585 units permitted in Charlotte County in 2024 (703 in 5+ unit buildings).
- At $3,014/mo this rent would consume 47% of the median local household income ($76k/yr) (locally 608% of renters already pay >50% of income on rent) — very limited rent-growth headroom before tenants either downsize or default.
Forward outlook
- Local home prices are declining (-3.0%/yr); year-one equity from $898 of loan paydown is wiped out by about $4k of value loss. Plan a longer hold.
- Charlotte County population projected at +24% by 2050 — long-run rental-demand tailwind backs the buy-and-hold thesis.
- At projected returns (-3.0% appreciation + 0.0% rent growth), your $36k cash investment doubles in ~4 years — after that, you're playing with house money.
Negotiation context
- It's been on market 72 days — a 6% lower offer ($122k) is reasonable based on typical stale-listing flexibility.
- 14 sale attempts since 22y ago; this cycle's ask has dropped $10k (7%) from the opening price — seller is motivated, your offer sets the floor, not the list.
Risks & watch-outs
- Watch-outs: flood insurance adds $427/mo; built in 1959 — expect roof / HVAC / electrical / plumbing capex.
- Climate carrying-cost: in FEMA flood zone AE (mandatory federal flood insurance); severe wind risk, 99% chance of damaging wind over 30y; extreme-heat days projected 7→28/yr by 2055 (HVAC capex compounding) — expect insurance premiums to compound above CPI over the hold.
Questions for the listing agent
- It's been on market 72 days. Have you received any prior offers? Is the seller open to a 6% concession, seller financing, or rate buy-down credit?
- Built in 1959 — when were the roof, HVAC, electrical panel, plumbing, and water heater last replaced?
- What's the actual annual flood-insurance premium (NFIP or private), and is the property in a SFHA with mandatory coverage?
- Why hasn't it sold? Are there any deal-killer items the seller is aware of (foundation, flood, title, zoning, code violations)?
- Is there a deadline driving the sale (1031 exchange, divorce, estate, relocation)? That informs how much negotiation room exists.
- Schools are F-rated, which usually means shorter tenancies and higher turnover. Who's the typical renter profile here, and what's been the actual vacancy rate?
- What's the average days-on-market for RENTAL listings here right now (not sales)? A rising rental-DOM trend means longer vacancies and softer asking-rent achievability than the comps imply.
- What's the recent tenant-quality profile in this submarket — average credit score on applications, eviction rate, late-payment / NSF rate, and stable-employment percentage? A property-management company in the area should have these aggregated.
- How much new for-sale + rental construction is in the pipeline within 1–3 miles? Heavy new supply typically softens prices + rents 12–24 months out; constrained supply supports both.
Investment metrics
- 1% rule
- 2.32% ✓
- Cap rate
- 20.98%
- Cash-on-cash
- 52.46%
- DSCR
- 3.33
- GRM
- 3.6
CMA / ARV
- ARV (on-the-fly)
- $684,840
- Comps found
- 6
Show comp detail 6 sales within ~0.75 mi
| Address | Dist | Beds/Ba | Sqft | Sold | Price | $/sf | Match |
|---|---|---|---|---|---|---|---|
| 3700 Candia Dr | 0.66mi | 3/2.5 | 2,174 (-1%) | 6mo | $679,000 | $312 | 56 |
| 3824 Colony Ct | 0.55mi | 3/3.0 | 2,052 (-6%) | 7mo | $1,140,000 | $556 | 49 |
| 2901 Palm Dr | 0.54mi | 3/2.0 | 1,889 (-14%) | 2mo | $339,000 | $179 | 46 |
| 521 Peeples Dr | 0.57mi | 3/2.5 | 1,923 (-12%) | 1mo | $735,000 | $382 | 46 |
| 3201 Colony Ct | 0.58mi | 4/3.0 (+1) | 2,412 (+10%) | 10mo | $660,000 | $274 | 35 |
| 3553 Dileuca St | 0.59mi | 2/2.0 (-1) | 1,867 (-15%) | 7mo | $499,100 | $267 | 33 |
Match score weights: distance 35% · size 25% · config 20% · recency 20%. Top-matched comps best support the ARV.
Projected returns pro-forma
-3.0% appreciation · 0.0% rent growth · sell at horizon
- IRR
- 30.6%
- Equity multiple
- 2.22×
- Total profit
- $44,461
- Equity at exit
- $19,369
- IRR
- 35.8%
- Equity multiple
- 3.78×
- Total profit
- $100,983
- Equity at exit
- $11,231
Cash invested: $36,372 (down + closing). Projections, not guarantees.
Landlord ↔ Tenant lean methodology
- Overall (STATE)
- 87 Strongly Landlord-Friendly
- State Florida
- 87 Strongly Landlord-Friendly · R+3
- County
- — inherits STATE
- City
- — inherits STATE
ZIP-level market 33950
- Home prices YoY
- -29.9%
- Rents YoY
- -0.1%
- Active inventory
- 999
- Price-to-rent
- 3.6×
Monthly cashflow live
- Estimated rent
- $3,014 high interval (Pro) →
- Mortgage (P&I)
- −$681
- Tax from tax record
- −$55 /mo · $666/yr
- Insurance
- −$54
- Flood insurance flood zone
- −$427 /mo · $5,118/yr
- HOA
- −$0
- Vacancy / Maint / Mgmt
- −$633
- Net cashflow
- $1,163
Break-even live
UW: 25.0% down · 7.5% · 30yr · 1.5% tax · 5.0% vac · 8.0% maint · 8.0% mgmt
Financing live
Cash to close
- Down payment
- $32,475
- Closing costs
- $3,897
- Reserves months
- —
- Total cash needed
- —
Loan-product check · same deal, 3 products live
Conventional
25% down · 7.5% · 30yr
- Down + closing
- —
- Monthly P&I
- —
- Monthly cashflow
- —
- DSCR
- —
- Eligible?
- —
Personal DTI + credit; lowest rate.
DSCR
20% down · 8.5% · 30yr
- Down + closing
- —
- Monthly P&I
- —
- Monthly cashflow
- —
- DSCR
- —
- Eligible?
- —
No personal income docs; deal must DSCR.
Hard money
10% down · 12.0% · 12mo
- Down + closing
- —
- Monthly P&I
- —
- Monthly cashflow
- —
- DSCR
- —
- Eligible?
- —
Short-term bridge; refi at stabilization.
Rent comps 23 comps
| Address | Beds | Baths | Sqft | Rent | $/sqft | DOM | Units | Dist |
|---|---|---|---|---|---|---|---|---|
| 2 Emden Cir Unit 1 Punta Gorda, FL | 2.0 | 2.0 | 1800 | $3,500 | $1.94 | 21d | 1 | 0.26mi |
| 3320 Palm Dr Punta Gorda, FL | 3.0 | 2.0 | 1703 | $2,400 | $1.41 | 21d | 1 | 0.34mi |
| 67 Windmill Blvd Unit 212O Punta Gorda, FL | 2.0 | 2.0 | 1620 | $1,895 | $1.17 | 21d | 1 | 0.61mi |
| 3500 Mondovi Ct #811 Punta Gorda, FL | 3.0 | 2.0 | 1596 | $3,200 | $2.01 | 21d | 1 | 0.73mi |
| 2811 Poinciana Ct Punta Gorda, FL | 3.0 | 2.0 | 2154 | $2,300 | $1.07 | 13d | 1 | 0.77mi |
| 3004 Banyan Way Punta Gorda, FL | 3.0 | 2.0 | 1522 | $3,390 | $2.23 | 21d | 1 | 0.86mi |
| 255 W End Dr Punta Gorda, FL | 2.0–3.0 | 2.0 | 1559 | $3,500 | $2.24 | 21d | 3 | 0.90mi |
| 2736 Magdalina Dr Punta Gorda, FL | 3.0 | 2.0 | 2004 | $5,000 | $2.50 | 21d | 1 | 0.99mi |
| 3701 Albacete Cir #98 Punta Gorda, FL | 2.0 | 2.0 | 1451 | $3,250 | $2.24 | 21d | 1 | 1.03mi |
| 3836 Paola Dr Punta Gorda, FL | 3.0 | 2.5 | 2558 | $5,000 | $1.95 | 21d | 1 | 1.05mi |
| 1340 Rock Dove Ct #144 Punta Gorda, FL | 3.0 | 2.0 | 1813 | $1,850 | $1.02 | 21d | 1 | 1.07mi |
| 1340 Rock Dove Ct #144 Punta Gorda, FL | 3.0 | 2.0 | 1813 | $1,850 | $1.02 | 13d | 1 | 1.07mi |
| 7836 Mikasa Dr Punta Gorda, FL | 4.0 | 2.0 | 2339 | $2,400 | $1.03 | 21d | 1 | 1.27mi |
| 1431 Aqui Esta Dr #411 Punta Gorda, FL | 3.0 | 2.0 | 1556 | $2,000 | $1.29 | 21d | 1 | 1.28mi |
| 3800 Tripoli Blvd #35 Punta Gorda, FL | 2.0 | 2.0 | 1451 | $4,200 | $2.89 | 21d | 1 | 1.30mi |
| 3845 Albacete Cir #50 Punta Gorda, FL | 2.0 | 2.0 | 1451 | $2,200 | $1.52 | 21d | 1 | 1.36mi |
| 3900 Madrid Ct Punta Gorda, FL | 3.0 | 2.5 | 2362 | $3,000 | $1.27 | 21d | 1 | 1.36mi |
| 3228 Purple Martin Dr #125 Punta Gorda, FL | 3.0 | 2.0 | 1501 | $4,000 | $2.66 | 13d | 1 | 1.36mi |
| 3228 Purple Martin Dr #125 Punta Gorda, FL | 3.0 | 2.0 | 1501 | $4,000 | $2.66 | 21d | 1 | 1.36mi |
| 3334 Purple Martin Dr #211 Punta Gorda, FL | 2.0 | 2.0 | 1851 | $4,500 | $2.43 | 21d | 1 | 1.36mi |
| 3322 Purple Martin Dr Unit Reservation Spot 1 Punta Gorda, FL | 2.0 | 2.0 | 1400 | $3,800 | $2.71 | 21d | 1 | 1.38mi |
| 1001 Mineo Dr Punta Gorda, FL | 3.0 | 2.0 | 1850 | $4,500 | $2.43 | 21d | 1 | 1.42mi |
| 732 Santa Margerita Ln Punta Gorda, FL | 3.0 | 2.0 | 2017 | $3,000 | $1.49 | 21d | 1 | 1.47mi |
Listing history 48 events
-
2026-04-23status Pending
-
2026-03-16price $129,900
-
2026-02-10$139,900 Active
-
2023-06-15soldstatus $225,000
-
2023-04-29historical
-
2023-04-28historical
-
2023-04-18price $267,000
-
2023-04-18price $267,000
-
2023-04-10price $291,999
-
2023-04-06price $299,999
-
2023-04-05price $299,999
-
2023-04-03$310,000 Active
-
2023-03-27$310,000 Active
-
2023-03-01historical
-
2023-02-28status Active
-
2023-02-19status Pending
-
2023-02-08price $289,900
-
2023-01-30status Active
-
2023-01-19status Pending
-
2023-01-05status Active
-
2022-12-24status Pending
-
2022-12-24status Active
-
2022-12-21historical
-
2022-12-19status Active
-
2022-12-19price $299,900
-
2022-10-20status Pending
-
2022-10-14status Active
-
2022-09-28status Pending
-
2022-09-25price $289,000
-
2022-09-20price $315,000
-
2022-09-06price $345,000
-
2022-09-06$315,000 Active
-
2022-08-16soldstatus $210,000
-
2019-10-03soldstatus $150,000
-
2019-10-01soldstatus $150,000 Sold
-
2019-08-20status Pending
-
2019-08-14price $150,000
-
2019-06-29price $164,900
-
2019-06-06price $179,900
-
2019-05-10price $189,900
-
2019-04-17$194,900 Active
-
2013-09-06soldstatus $25,799
-
2013-07-23$30,000
-
2012-10-18historical
-
2012-06-08$30,000
-
2004-11-10historical
-
2004-10-29$62,000
-
1979-11-01soldstatus $28,800
ⓘ Source: listings_history table (triggers on properties + properties_extension) + one-shot
backfill from property_details.listing_events for pre-trigger history.
Tax reassessment forecast FL · Resets to sale price
- Current annual tax
- $666 · $55/mo
- Projected year-2 tax
- $1,078 · $90/mo
- Expected delta
- +$412/yr (+$34/mo · 62.0%)
ⓘ Screening estimate from a state-policy table — verify with the county assessor before closing.
Climate risk First Street
- Flood 10/10 Extreme FEMA zone AE · 99% chance over 30 yrs
- Wildfire 3/10 Moderate
- Heat 10/10 Extreme 7 d/yr ≥107°F today · 28 d/yr by 30 yrs out
- Wind 10/10 Extreme 99% chance of damaging wind over 30 yrs
- Air quality 3/10 Moderate 2 unhealthy d/yr today · 2 by 30 yrs out
Nearby sold comps map
Loading sold comps map…
Walkable amenities ~0.75 mi
Loading nearby amenities…
Taxation est. · year 1
- Rental income
- $36,164
- − Mortgage interest
- −$7,276
- − Property taxes
- −$666
- − Insurance
- −$5,768
- − Repairs & maintenance
- −$2,893
- − Management
- −$2,893
- − Depreciation
- −$3,779
- Taxable income
- $12,889
- Est. tax owed @ 24.0%
- −$3,093
- After-tax cash flow
- $10,868/yr
For passive investors: Depreciation is non-cash, so a rental often shows a tax loss while cash-flowing — sheltering income. Rental losses are passive: they offset passive income freely, and up to $25,000/yr can offset ordinary (W-2) income if you actively participate and your MAGI is under $100k (phasing out to $0 by $150k); unused losses carry forward. On sale, claimed depreciation is recaptured at up to 25%, and gains may owe capital-gains tax (a 1031 exchange can defer both). Figures are a year-1 estimate at your 24.0% rate — not tax advice; consult a CPA.
Schools (NCES district)
- District
- Charlotte
- NCES district ID
- 1200240
- Math proficiency
- 54% ▼ -6.00%
- Reading proficiency
- 54% ▼ -1.00%
- Median HH income
- $44,864
- Composite
- 45.62/100
- National rank
- #2586
- State rank
- #22 of 73 in FL
Livability — Charlotte Park
- Score
- 66/100
- State rank
- #624
- US rank
- #12150
Category grades
Schools grade is shown separately in the Schools card above.
Census & demographics
- Census place
- Charlotte Park, FL
- County
- Charlotte County · 196,994 people
- Metro
- Punta Gorda, FL
- Population (ZIP)
- 24,955
- Household income
- $76,369
- Rent vs Own
- Severe rent burden
- 608.0
Population outlook (Charlotte County) Hauer SSP2
- Today (2025)
- 198,646 people
- By 2030
- 210,507 · +6.0%
- By 2040
- 230,857 · +16.2%
- By 2050
- 247,148 · +24.4%
- By 2075
- 281,777 · +41.8%
- By 2100
- 293,609 · +47.8%
Race, ethnicity, and origin ACS 2023
- Neighborhood character
- Predominantly White (86%)
- Race & ethnicity
- White 86% Two or more races 5% Black 5% Hispanic / Latino 4% Asian 1%
- Common ancestry
- Lithuanian 5% Romanian 4% Italian 2%
- Foreign-born
- 7% · Canada
- Languages at home
- 95% English-only · Spanish 3% Other Indo-European 1% German/W. Germanic 1%
Political lean MEDSL · Charlotte
- 2024 margin
- Solid R (+34.0) · D 32.7% · R 66.7%
- 2008→2024 swing
- -26.7pp toward R · 2008: -7.2pp · 2024: -34.0pp
- All cycles
- 2024: R+34.0 2020: R+26.6 2016: R+27.8 2012: R+14.3 2008: R+7.2
Not yet ingested
- Civics
- —
Market trends
- HPI YoY
- ▼ -111.73%
- Current HPI
- 261.6573
- Rent YoY
- ▼ -0.06%
- Metro
- Punta Gorda, FL
- State GDP YoY
- ▲ 3.28%
- F500 in state
- 36
Industry mix (Fortune 500 HQ in FL)
| Industry | F500 HQs | Revenue |
|---|---|---|
| Industrial Technology | 2 | $29B |
|
||
| Insurance | 2 | $17B |
|
||
| Retail | 1 | $60B |
|
||
| Technology Distribution | 1 | $58B |
|
||
| Homebuilding | 1 | $35B |
|
||
| Technology Manufacturing | 1 | $35B |
|
||
Price history
+351.0% since first listed48 events — show timeline
- 2026-04-23 Pending — Stellar MLS as Distributed by MLS Grid
- 2026-03-16 Price Changed $129,900 Stellar MLS as Distributed by MLS Grid
- 2026-02-10 Listed $139,900 Stellar MLS as Distributed by MLS Grid
- 2023-06-15 Sold (Public Records) $225,000 Public Records
- 2023-04-29 Listing Removed — Stellar MLS as Distributed by MLS Grid
- 2023-04-28 Listing Removed — NAPLESMLS
- 2023-04-18 Price Changed $267,000 NAPLESMLS
- 2023-04-18 Price Changed $267,000 Stellar MLS as Distributed by MLS Grid
- 2023-04-10 Price Changed $291,999 NAPLESMLS
- 2023-04-06 Price Changed $299,999 NAPLESMLS
- 2023-04-05 Price Changed $299,999 Stellar MLS as Distributed by MLS Grid
- 2023-04-03 Listed $310,000 Stellar MLS as Distributed by MLS Grid
- 2023-03-27 Listed $310,000 NAPLESMLS
- 2023-03-01 Listing Removed — Stellar MLS as Distributed by MLS Grid
- 2023-02-28 Relisted — Stellar MLS as Distributed by MLS Grid
- 2023-02-19 Pending — Stellar MLS as Distributed by MLS Grid
- 2023-02-08 Price Changed $289,900 Stellar MLS as Distributed by MLS Grid
- 2023-01-30 Relisted — Stellar MLS as Distributed by MLS Grid
- 2023-01-19 Pending — Stellar MLS as Distributed by MLS Grid
- 2023-01-05 Relisted — Stellar MLS as Distributed by MLS Grid
- 2022-12-24 Pending — Stellar MLS as Distributed by MLS Grid
- 2022-12-24 Relisted — Stellar MLS as Distributed by MLS Grid
- 2022-12-21 Listing Removed — Stellar MLS as Distributed by MLS Grid
- 2022-12-19 Relisted — Stellar MLS as Distributed by MLS Grid
- 2022-12-19 Price Changed $299,900 Stellar MLS as Distributed by MLS Grid
- 2022-10-20 Pending — Stellar MLS as Distributed by MLS Grid
- 2022-10-14 Relisted — Stellar MLS as Distributed by MLS Grid
- 2022-09-28 Pending — Stellar MLS as Distributed by MLS Grid
- 2022-09-25 Price Changed $289,000 Stellar MLS as Distributed by MLS Grid
- 2022-09-20 Price Changed $315,000 Stellar MLS as Distributed by MLS Grid
- 2022-09-06 Price Changed $345,000 Stellar MLS as Distributed by MLS Grid
- 2022-09-06 Listed $315,000 Stellar MLS as Distributed by MLS Grid
- 2022-08-16 Sold (Public Records) $210,000 Public Records
- 2019-10-03 Sold (Public Records) $150,000 Public Records
- 2019-10-01 Sold (MLS) $150,000 Stellar MLS as Distributed by MLS Grid
- 2019-08-20 Pending — Stellar MLS as Distributed by MLS Grid
- 2019-08-14 Price Changed $150,000 Stellar MLS as Distributed by MLS Grid
- 2019-06-29 Price Changed $164,900 Stellar MLS as Distributed by MLS Grid
- 2019-06-06 Price Changed $179,900 Stellar MLS as Distributed by MLS Grid
- 2019-05-10 Price Changed $189,900 Stellar MLS as Distributed by MLS Grid
- 2019-04-17 Listed $194,900 Stellar MLS as Distributed by MLS Grid
- 2013-09-06 Sold (MLS) $25,799 Stellar MLS as Distributed by MLS Grid
- 2013-07-23 Listed $30,000 Stellar MLS as Distributed by MLS Grid
- 2012-10-18 Listing Removed — Stellar MLS as Distributed by MLS Grid
- 2012-06-08 Listed $30,000 Stellar MLS as Distributed by MLS Grid
- 2004-11-10 Listing Removed — Stellar MLS as Distributed by MLS Grid
- 2004-10-29 Listed $62,000 Stellar MLS as Distributed by MLS Grid
- 1979-11-01 Sold (Public Records) $28,800 Public Records
Property tax history
+0.7%/yrLatest (2025): $666 · -83.0% YoY. Source: county tax records.
Cash-flow waterfall
monthlySold comps — $/sqft
last 12 mo · ≤1 miLoading sold comps…