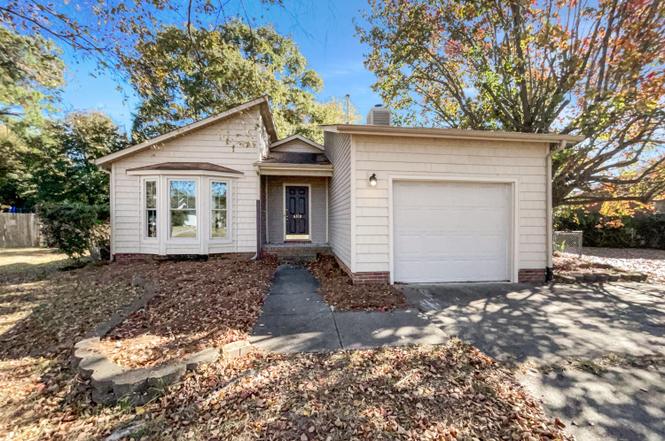
6312 Lake Trail Dr · Fayetteville, NC
Flood risk 3/10 · Minor
- FEMA flood zone
- X (unshaded)
- Chance of flooding over 30 yrs
- 0.12%
- Est. flood insurance / yr
- $507 – $1,088
Fire risk 3/10 · Minor
- Est. fire insurance / yr
- $906 – $1,684
Heat risk 7/10 · Major
- Hot days now (above 107°F)
- 7 days/yr
- Hot days in 30 yrs
- 16 days/yr
Wind risk 8/10 · Major
- Chance of severe wind over 30 yrs
- 80.0%
Air-quality risk 1/10 · Minimal
- Unhealthy air days now
- 0 days/yr
- Unhealthy air days in 30 yrs
- 0 days/yr
Risk factors via First Street. Map © Google.
Why this score? — see what drove the D grade
The composite is a weighted blend of 9 inputs, each scored 0–100. Each bar is that input's sub-score; the figure is the points it added to the 100-point composite (weight × sub-score).
- ARV discount +11.9/15.0
- Cash flow +11.8/30.0
- Livability +3.8/5.0
- DSCR +3.5/10.0
- Rent growth +3.3/5.0
- 1% rule +3.2/10.0
- Schools +3.1/10.0
- Condition / age +2.5/5.0
- Appreciation +0.0/10.0
$199,000
🖨 Deal sheet (PDF) 📄 Offer letter ✓ Due diligence
Listing remarks MLS
Located in Jack Britt district, this beautiful Ranch-Home offers 3 Bedrooms & 2 Baths. Large and bright living room with fireplace, open to formal dining room. Kitchen with stainless steel appliances and eat-in area with bay windows. Master bedroom with doors to patio, perfect for your morning tea! Large backyard to make this one the perfect home!
Key facts
- Cozy fireplace
- Patio
- Accent backsplash
Tags
Property features AI
Finance
- Other: County: Cumberland
- HOA & community: No homeowners association; Not a senior community
Exterior
- Parking: Attached garage (1 garage space); 1 open parking space; 2 total parking spaces
- Utilities: Public water; Septic tank sewer
- Home design: Single-story home; Living area approximately 1,334
- Construction: Vinyl siding; Composition/shingle roof; Other foundation
- Exterior features: Lot is 0.28 acres; Publicly maintained road access; Directions available
Interior
- Bedrooms: 3 bedrooms (all on the main level)
- Flooring: Carpet; Vinyl; Other
- Bathrooms: 2 full bathrooms
- Heating & cooling: Central heating; Central air conditioning
- Interior features: Wood-burning fireplace; One fireplace total
Neighborhood map
What this means for you Summary
Snapshot
- This is a 3-bed/2.0-bath single-family listed at $199k.
Deal economics
- At list price, monthly cash flow is $-54 ($-649/yr) — negative.
- To cash-flow at today's rent, offer at most $189k (4.8% below list).
- To meet the 1% rule (rent ≥ 1% of price), the offer needs to be $163k (17.9% below list).
- Recommended offer: $163k (17.9% below list) — sets the bar for 1% rule.
- Cap rate 6.0% vs local median 4.8% in Fayetteville — meaningfully above typical; check what's discounted (condition, days-on-market, listing class) to confirm the premium yield is real.
Location & tenants
- Location reads 75/100 on livability (#45 in NC, #4,031 nationally) — a middle-class / working-renter tenant base. Strengths: commute A+, cost of living A+, housing A+; Watch: crime F, employment D-.
- Cumberland County Schools (urban): math 32% / reading 41% proficiency, ranked #126 of 178 in NC (top 71%) — families likely to look elsewhere, expect single-tenant / working-renter base with shorter leases.
- Zoned schools: E Melvin Honeycutt Elementary (math 50% / reading 53%, grade C-, #392 of 1,410 statewide, top 28%, 834 students, 50% FRL); John R Griffin Middle (math 43% / reading 53%, grade C-, #134 of 475 statewide, top 29%, 1,091 students, 40% FRL); Jack Britt High (math 58% / reading 72%, grade B, #161 of 535 statewide, top 30%, 1,890 students, 38% FRL).
- Zoned-school proficiency averages 55% at this address vs 36% district-wide (+18 pts) — the actual schools serving this property are materially stronger than the Cumberland County Schools average implies; a family-tenant draw the district grade alone would hide.
- Market conditions: Rents rising (+3.2%/yr); 308 active listings in the ZIP; 32 comparable units currently listed for rent nearby; rentals at typical pace (median 25d on market — plan ~3-4 weeks tenant-placement turnaround); 1,125 units permitted in Cumberland County in 2024 (104 in 5+ unit buildings).
- This rent runs 33% of the median local income ($59k/yr) — at the standard rent-burdened threshold; future hikes will face affordability resistance.
Forward outlook
- Local home prices are declining (-3.0%/yr); year-one equity from $1k of loan paydown is wiped out by about $6k of value loss. Plan a longer hold.
Negotiation context
- It's been on market 184 days — a 12% lower offer ($175k) is reasonable based on typical stale-listing flexibility.
- 5 sale attempts since 11y ago; this cycle's ask has dropped $23k (10%) from the opening price — seller is motivated, your offer sets the floor, not the list.
Risks & watch-outs
- Climate carrying-cost: severe wind risk, 80% chance of damaging wind over 30y; extreme-heat days projected 7→16/yr by 2055 (HVAC capex compounding) — expect insurance premiums to compound above CPI over the hold.
Questions for the listing agent
- What do current leases actually rent for vs. the listed asking? Can we see a recent rent roll and the last 12 months of T-12 income?
- It's been on market 184 days. Have you received any prior offers? Is the seller open to a 18% concession, seller financing, or rate buy-down credit?
- Why hasn't it sold? Are there any deal-killer items the seller is aware of (foundation, flood, title, zoning, code violations)?
- Is there a deadline driving the sale (1031 exchange, divorce, estate, relocation)? That informs how much negotiation room exists.
- Crime grade is F in this area — have there been break-ins, vandalism, or insurance claims at this property in the last 3 years? What carrier currently insures it and at what premium?
- The area grade is low — what's the realistic commute time and amenity access for the typical tenant pool here? Any planned neighborhood developments (good or bad) we should know about?
- What's the average days-on-market for RENTAL listings here right now (not sales)? A rising rental-DOM trend means longer vacancies and softer asking-rent achievability than the comps imply.
- What's the recent tenant-quality profile in this submarket — average credit score on applications, eviction rate, late-payment / NSF rate, and stable-employment percentage? A property-management company in the area should have these aggregated.
- How much new for-sale + rental construction is in the pipeline within 1–3 miles? Heavy new supply typically softens prices + rents 12–24 months out; constrained supply supports both.
Investment metrics
- 1% rule
- 0.82% ✗
- Cap rate
- 5.97%
- Cash-on-cash
- -1.17%
- DSCR
- 0.95
- GRM
- 10.1
CMA / ARV
- ARV (on-the-fly)
- $220,440
- Comps found
- 12
Show comp detail 12 sales within ~0.75 mi
| Address | Dist | Beds/Ba | Sqft | Sold | Price | $/sf | Match |
|---|---|---|---|---|---|---|---|
| 5908 Gosfield Pl | 0.35mi | 3/2.0 | 1,280 (-3%) | 1mo | $237,000 | $185 | 78 |
| 1931 Pumpkin Rd | 0.22mi | 4/2.0 (+1) | 1,363 (+3%) | 2mo | $195,000 | $143 | 78 |
| 2092 Lakeridge Dr | 0.49mi | 3/2.0 | 1,274 (-4%) | 1mo | $184,000 | $144 | 70 |
| 6342 Fisher Dr | 0.23mi | 3/2.0 | 1,208 (-8%) | 7mo | $164,000 | $136 | 70 |
| 1808 Charity Ln | 0.67mi | 3/2.0 | 1,330 (+1%) | 8mo | $245,000 | $184 | 61 |
| 6439 Applewhite Rd | 0.66mi | 3/2.0 | 1,236 (-6%) | 1mo | $210,000 | $170 | 58 |
| 5909 Waterdale Ct | 0.41mi | 3/2.0 | 1,499 (+14%) | 1mo | $250,000 | $167 | 57 |
| 1824 Rivergate Rd | 0.48mi | 3/2.0 | 1,479 (+12%) | 2mo | $257,000 | $174 | 56 |
| 1886 Windlock Dr | 0.59mi | 3/2.0 | 1,455 (+10%) | 7mo | $250,000 | $172 | 50 |
| 5904 Lake Terrace Ct | 0.57mi | 3/2.0 | 1,510 (+14%) | 2mo | $214,000 | $142 | 48 |
| 6419 Green Meadow Rd | 0.67mi | 3/2.0 | 1,173 (-11%) | 3mo | $190,000 | $162 | 47 |
| 2122 Coinjock Cir | 0.55mi | 4/2.5 (+1) | 1,449 (+10%) | 5mo | $242,500 | $167 | 46 |
Match score weights: distance 35% · size 25% · config 20% · recency 20%. Top-matched comps best support the ARV.
Projected returns pro-forma
-3.0% appreciation · 3.17% rent growth · sell at horizon
- IRR
- -18.0%
- Equity multiple
- 0.36×
- Total profit
- $-35,406
- Equity at exit
- $29,672
- IRR
- -9.9%
- Equity multiple
- 0.39×
- Total profit
- $-34,090
- Equity at exit
- $17,206
Cash invested: $55,720 (down + closing). Projections, not guarantees.
Landlord ↔ Tenant lean methodology
- Overall (STATE)
- 85 Strongly Landlord-Friendly
- State North Carolina
- 85 Strongly Landlord-Friendly · R+3
- County
- — inherits STATE
- City
- — inherits STATE
ZIP-level market 28304
- Home prices YoY
- -21.7%
- Rents YoY
- 3.2%
- Active inventory
- 308
- Price-to-rent
- 10.1×
Monthly cashflow live
- Estimated rent
- $1,634 high interval (Pro) →
- Mortgage (P&I)
- −$1,044
- Tax from tax record
- −$219 /mo · $2,625/yr
- Insurance
- −$83
- HOA
- −$0
- Vacancy / Maint / Mgmt
- −$343
- Net cashflow
- $-54
Break-even live
Sensitivity live
| Price | -10% $59 | -5% $2 | +0% $-54 | +5% $-110 | +10% $-167 |
|---|---|---|---|---|---|
| Rent | -10% $-183 | -5% $-119 | +0% $-54 | +5% $10 | +10% $75 |
| Rate | -1.0pp $46 | -0.5pp $-3 | base $-54 | +0.5pp $-106 | +1.0pp $-158 |
UW: 25.0% down · 7.5% · 30yr · 1.5% tax · 5.0% vac · 8.0% maint · 8.0% mgmt
Financing live
Cash to close
- Down payment
- $49,750
- Closing costs
- $5,970
- Reserves months
- —
- Total cash needed
- —
Loan-product check · same deal, 3 products live
Conventional
25% down · 7.5% · 30yr
- Down + closing
- —
- Monthly P&I
- —
- Monthly cashflow
- —
- DSCR
- —
- Eligible?
- —
Personal DTI + credit; lowest rate.
DSCR
20% down · 8.5% · 30yr
- Down + closing
- —
- Monthly P&I
- —
- Monthly cashflow
- —
- DSCR
- —
- Eligible?
- —
No personal income docs; deal must DSCR.
Hard money
10% down · 12.0% · 12mo
- Down + closing
- —
- Monthly P&I
- —
- Monthly cashflow
- —
- DSCR
- —
- Eligible?
- —
Short-term bridge; refi at stabilization.
Rent comps 32 comps
| Address | Beds | Baths | Sqft | Rent | $/sqft | DOM | Units | Dist |
|---|---|---|---|---|---|---|---|---|
| 2514 Gardner Park Dr Fayetteville, NC | 3.0 | 2.5 | 1480 | $1,595 | $1.08 | 25d | 1 | 0.08mi |
| 1948 Nordic Dr Fayetteville, NC | 3.0 | 2.0 | 1131 | $1,400 | $1.24 | 25d | 1 | 0.23mi |
| 6301 Lakehaven Dr Fayetteville, NC | 3.0 | 2.0 | 1514 | $1,700 | $1.12 | 25d | 1 | 0.45mi |
| 2220 Baywater Dr Fayetteville, NC | 3.0 | 2.5 | 1859 | $2,000 | $1.08 | 25d | 1 | 0.45mi |
| 6017 Lakeway Dr Fayetteville, NC | 3.0 | 2.0 | 1709 | $1,750 | $1.02 | 25d | 1 | 0.52mi |
| 2012 Lakemeadow Dr Fayetteville, NC | 3.0 | 2.0 | 1332 | $1,800 | $1.35 | 15d | 1 | 0.64mi |
| 1644 Sweetgum Cir Fayetteville, NC | 3.0 | 2.0 | 1446 | $1,750 | $1.21 | 25d | 1 | 0.88mi |
| 1879 Frankie Ave Fayetteville, NC | 3.0 | 2.0 | 1100 | $1,375 | $1.25 | 25d | 1 | 0.94mi |
| 6716 Sandfield Ct Fayetteville, NC | 3.0 | 2.0 | 1296 | $1,575 | $1.22 | 25d | 1 | 0.95mi |
| 2920 Cosmo Dr Fayetteville, NC | 1.0–3.0 | 1.0–2.0 | 918 | $1,505 | $1.64 | 15d | 9 | 0.96mi |
| 6701 Vaughn Rd Fayetteville, NC | 3.0 | 2.0 | 1236 | $1,700 | $1.38 | 15d | 1 | 1.01mi |
| 1411 Furnish Dr Fayetteville, NC | 3.0 | 2.0 | 1100 | $1,350 | $1.23 | 25d | 1 | 1.03mi |
| 6338 Rhemish Dr Fayetteville, NC | 3.0 | 2.0 | 1201 | $1,500 | $1.25 | 25d | 1 | 1.05mi |
| 1811 Balmoral Dr #202 Fayetteville, NC | 2.0 | 2.0 | 1250 | $1,275 | $1.02 | 15d | 1 | 1.09mi |
| 6658 Vaughn Rd Fayetteville, NC | 3.0 | 2.0 | 1280 | $1,575 | $1.23 | 25d | 1 | 1.11mi |
| 1761 Renwick Dr #204 Fayetteville, NC | 2.0 | 2.0 | 1331 | $1,300 | $0.98 | 15d | 1 | 1.11mi |
| 1800 Balmoral Dr Fayetteville, NC | 2.0 | 2.0 | 1328 | $1,250 | $0.94 | 25d | 1 | 1.12mi |
| 1701 Carter Baron Pl Unit 211 Fayetteville, NC | 3.0 | 2.0 | 1295 | $1,700 | $1.31 | 25d | 1 | 1.12mi |
| 1927 Shiloh Dr Fayetteville, NC | 3.0 | 1.5 | 1606 | $1,600 | $1.00 | 15d | 1 | 1.16mi |
| 2640 Latrobe Ave Fayetteville, NC | 1.0–3.0 | 1.0–2.0 | 1079 | $1,815 | $1.68 | 15d | 30 | 1.17mi |
| 5812 Shenandoah Dr Fayetteville, NC | 4.0 | 2.0 | 1800 | $1,599 | $0.89 | 25d | 1 | 1.20mi |
| 6408 Dunham Dr Fayetteville, NC | 3.0 | 2.0 | 1400 | $1,500 | $1.07 | 15d | 1 | 1.26mi |
| 2513 Owlands Ct Fayetteville, NC | 3.0 | 2.0 | 1643 | $2,245 | $1.37 | 15d | 1 | 1.30mi |
| 1715 Arrow Ridge Way Fayetteville, NC | 3.0 | 2.0 | 1220 | $1,550 | $1.27 | 15d | 1 | 1.34mi |
| 1508 Darvel Ave Fayetteville, NC | 3.0 | 2.0 | 1269 | $1,700 | $1.34 | 25d | 1 | 1.34mi |
| 3001 Stone Carriage Cir Fayetteville, NC | 1.0–3.0 | 1.0–2.0 | 1098 | $1,700 | $1.55 | 15d | 12 | 1.35mi |
| 2161 Bingham Dr Fayetteville, NC | 3.0 | 2.0 | 1300 | $1,325 | $1.02 | 15d | 1 | 1.40mi |
| 2543 Painters Mill Dr Fayetteville, NC | 3.0 | 2.0 | 1154 | $1,600 | $1.39 | 15d | 1 | 1.43mi |
| 5595 Quietwood Pl Fayetteville, NC | 3.0 | 2.0 | 1288 | $1,395 | $1.08 | 25d | 1 | 1.45mi |
| 1583 Winnabow Dr Fayetteville, NC | 3.0 | 2.5 | 1550 | $2,100 | $1.35 | 25d | 1 | 1.46mi |
| 1443 Larkhall Dr Fayetteville, NC | 4.0 | 2.0 | 1382 | $1,600 | $1.16 | 25d | 1 | 1.48mi |
| 5744 Randleman St Fayetteville, NC | 3.0 | 2.0 | 1171 | $1,395 | $1.19 | 25d | 1 | 1.50mi |
Listing history 31 events
-
2026-06-18status $199,000 Pending 184 DOM
-
2026-06-18days on market $199,000 Active 184 DOM
-
2026-06-17days on market $199,000 Active 183 DOM
-
2026-06-16days on market $199,000 Active 182 DOM
-
2026-06-15days on market $199,000 Active 181 DOM
-
2026-06-14days on market $199,000 Active 179 DOM
-
2026-06-13pricedays on market $199,000 Active 178 DOM
-
2026-06-10days on market $205,000 Active 176 DOM
-
2026-06-03days on market $205,000 Active 174 DOM
-
2026-06-02days on market $205,000 Active 173 DOM
-
2026-06-01days on market $205,000 Active 172 DOM
-
2026-05-31days on market $205,000 Active 171 DOM
-
2026-05-30days on market $205,000 Active 170 DOM
-
2026-05-21price $205,000
-
2026-04-30price $210,000
-
2026-04-09price $215,000
-
2026-03-26status Active
-
2026-03-16status Pending
-
2026-03-11status Active
-
2026-02-20status Pending
-
2026-01-15price $219,000
-
2025-11-12$222,000 Active
-
2025-10-28soldstatus $214,000
-
2020-06-02soldstatus $128,500
-
2020-06-01soldstatus $128,500 355-char remark
Show marketing remark (355 chars)
Located in Jack Britt district, this beautiful Ranch-Home offers 3 Bedrooms & 2 Baths. Large and bright living room with fireplace, open to formal dining room. Kitchen with stainless steel appliances and eat-in area with bay windows. Master bedroom with doors to patio, perfect for your morning tea! Large backyard to make this one the perfect home!
-
2020-02-28$128,500 355-char remark
Show marketing remark (355 chars)
Located in Jack Britt district, this beautiful Ranch-Home offers 3 Bedrooms & 2 Baths. Large and bright living room with fireplace, open to formal dining room. Kitchen with stainless steel appliances and eat-in area with bay windows. Master bedroom with doors to patio, perfect for your morning tea! Large backyard to make this one the perfect home!
-
2015-11-12soldstatus $120,000 499-char remark
Show marketing remark (499 chars)
-Lovingly updated 3 bedroom and 2 bathroom home in the Jack Britt school district. Updated vinyl and cedar siding, newly painted garage floor and walls, newly painted interior, updated bathrooms with custom tile work. Be the first to cook in your new kitchen featuring brand new stainless steel appliances, new countertops and tile backsplash. Upgraded windows throughout with lifetime warranty to new buyer. Private backyard offers large shed with electricity and toilet. Imagine the possibilities!
-
2015-11-12soldstatus $120,000
Show marketing remark (499 chars)
-Lovingly updated 3 bedroom and 2 bathroom home in the Jack Britt school district. Updated vinyl and cedar siding, newly painted garage floor and walls, newly painted interior, updated bathrooms with custom tile work. Be the first to cook in your new kitchen featuring brand new stainless steel appliances, new countertops and tile backsplash. Upgraded windows throughout with lifetime warranty to new buyer. Private backyard offers large shed with electricity and toilet. Imagine the possibilities!
-
2015-09-12$120,000 499-char remark
Show marketing remark (499 chars)
-Lovingly updated 3 bedroom and 2 bathroom home in the Jack Britt school district. Updated vinyl and cedar siding, newly painted garage floor and walls, newly painted interior, updated bathrooms with custom tile work. Be the first to cook in your new kitchen featuring brand new stainless steel appliances, new countertops and tile backsplash. Upgraded windows throughout with lifetime warranty to new buyer. Private backyard offers large shed with electricity and toilet. Imagine the possibilities!
-
2003-07-03soldstatus $89,000
-
1998-09-09soldstatus $90,000
ⓘ Source: listings_history table (triggers on properties + properties_extension) + one-shot
backfill from property_details.listing_events for pre-trigger history.
Tax reassessment forecast NC · Resets to sale price
- Current annual tax
- $2,625 · $219/mo
- Projected year-2 tax
- $2,625 · $219/mo
- Expected delta
- $0/yr ($0/mo · 0.0%)
ⓘ Screening estimate from a state-policy table — verify with the county assessor before closing.
Climate risk First Street
- Flood 3/10 Moderate FEMA zone X (unshaded) · 12% chance over 30 yrs
- Wildfire 3/10 Moderate
- Heat 7/10 Severe 7 d/yr ≥107°F today · 16 d/yr by 30 yrs out
- Wind 8/10 Severe 80% chance of damaging wind over 30 yrs
- Air quality 1/10 Low 0 unhealthy d/yr today · 0 by 30 yrs out
Nearby sold comps map
Loading sold comps map…
Walkable amenities ~0.75 mi
Loading nearby amenities…
Taxation est. · year 1
- Rental income
- $19,612
- − Mortgage interest
- −$11,147
- − Property taxes
- −$2,625
- − Insurance
- −$995
- − Repairs & maintenance
- −$1,569
- − Management
- −$1,569
- − Depreciation
- −$5,789
- Taxable loss
- −$4,082
- Est. tax savings @ 24.0%
- +$980
- After-tax cash flow
- $330/yr
For passive investors: Depreciation is non-cash, so a rental often shows a tax loss while cash-flowing — sheltering income. Rental losses are passive: they offset passive income freely, and up to $25,000/yr can offset ordinary (W-2) income if you actively participate and your MAGI is under $100k (phasing out to $0 by $150k); unused losses carry forward. On sale, claimed depreciation is recaptured at up to 25%, and gains may owe capital-gains tax (a 1031 exchange can defer both). Figures are a year-1 estimate at your 24.0% rate — not tax advice; consult a CPA.
Schools (NCES district)
- District
- Cumberland County Schools
- NCES district ID
- 3700011
- Math proficiency
- 32% ▼ -2.00%
- Reading proficiency
- 41% ▼ -1.00%
- Median HH income
- $44,168
- Composite
- 31.0/100
- National rank
- #6096
- State rank
- #126 of 178 in NC
Livability — Fayetteville
- Score
- 75/100
- State rank
- #45
- US rank
- #4031
Category grades
Schools grade is shown separately in the Schools card above.
Census & demographics
- Census place
- Fayetteville, NC
- County
- Cumberland County · 265,314 people
- City population
- 226,118
- Metro
- Fayetteville, NC
- Population (ZIP)
- 37,140
- Household income
- $58,563
- Rent vs Own
- Severe rent burden
- 1667.0
Population outlook (Cumberland County) Hauer SSP2
- Today (2025)
- 330,855 people
- By 2030
- 333,523 · +0.8%
- By 2040
- 335,583 · +1.4%
- By 2050
- 335,325 · +1.4%
- By 2075
- 342,853 · +3.6%
- By 2100
- 340,698 · +3.0%
Race, ethnicity, and origin ACS 2023
- Neighborhood character
- Highly diverse neighborhood (Simpson 0.70)
- Race & ethnicity
- Black 39% White 36% Hispanic / Latino 14% Two or more races 12% Asian 3% Native American 1%
- Hispanic origin (detail)
- Mexican 5% Puerto Rican 5%
- Common ancestry
- Slovak 2% Italian 1% Serbian 1%
- Foreign-born
- 8% · Canada, South Korea, Vietnam
- Languages at home
- 87% English-only · Spanish 9% Tagalog/Filipino 1% French/Haitian/Cajun 1%
Political lean MEDSL · Cumberland
- 2024 margin
- D (+13.4) · D 56.1% · R 42.7% · Other 1.2%
- 2008→2024 swing
- -4.3pp toward R · 2008: 17.7pp · 2024: 13.4pp
- All cycles
- 2024: D+13.4 2020: D+16.6 2016: D+16.0 2012: D+19.7 2008: D+17.7
Not yet ingested
- Civics
- —
Market trends
- HPI YoY
- ▼ -59.90%
- Current HPI
- 215.927
- Rent YoY
- ▲ 3.17%
- Metro
- Fayetteville, NC
- State GDP YoY
- ▲ 3.28%
- F500 in state
- 26
Industry mix (Fortune 500 HQ in NC)
| Industry | F500 HQs | Revenue |
|---|---|---|
| Financial Services | 2 | $213B |
|
||
| Retail | 2 | $95B |
|
||
| Industrial Conglomerate | 1 | $38B |
|
||
| Metals / Steel | 1 | $35B |
|
||
| Utilities | 1 | $30B |
|
||
| Industrial Machinery | 1 | $19B |
|
||
Price history
+127.8% since first listed18 events — show timeline
- 2026-05-21 Price Changed $205,000 TMLS
- 2026-04-30 Price Changed $210,000 TMLS
- 2026-04-09 Price Changed $215,000 TMLS
- 2026-03-26 Relisted — TMLS
- 2026-03-16 Pending — TMLS
- 2026-03-11 Relisted — TMLS
- 2026-02-20 Pending — TMLS
- 2026-01-15 Price Changed $219,000 TMLS
- 2025-11-12 Listed $222,000 TMLS
- 2025-10-28 Sold (Public Records) $214,000 Public Records
- 2020-06-02 Sold (Public Records) $128,500 Public Records
- 2020-06-01 Sold (MLS) $128,500 LPRMLS
- 2020-02-28 Listed $128,500 LPRMLS
- 2015-11-12 Sold (Public Records) $120,000 Public Records
- 2015-11-12 Sold (MLS) $120,000 LPRMLS
- 2015-09-12 Listed $120,000 LPRMLS
- 2003-07-03 Sold (Public Records) $89,000 Public Records
- 1998-09-09 Sold (Public Records) $90,000 Public Records
Property tax history
+5.1%/yrLatest (2025): $2,625 · +22.4% YoY. Source: county tax records.
Cash-flow waterfall
monthlySold comps — $/sqft
last 12 mo · ≤1 miLoading sold comps…