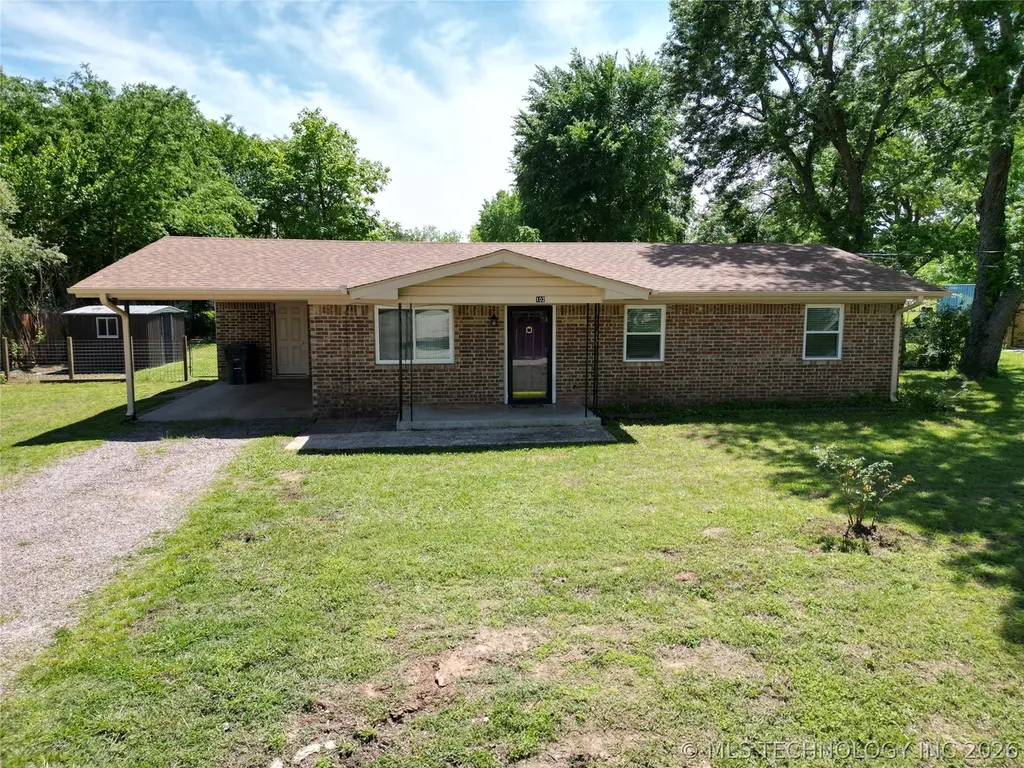
102 South St · Mannsville, OK
Flood risk 1/10 · Minimal
- FEMA flood zone
- X (unshaded)
- Chance of flooding over 30 yrs
- 0.0%
- Est. flood insurance / yr
- $507 – $1,088
Fire risk 6/10 · Moderate
- Est. fire insurance / yr
- $2,463 – $4,575
Heat risk 6/10 · Moderate
- Hot days now (above 110°F)
- 7 days/yr
- Hot days in 30 yrs
- 20 days/yr
Wind risk 4/10 · Minor
- Chance of severe wind over 30 yrs
- 13.0%
Air-quality risk 3/10 · Minor
- Unhealthy air days now
- 2 days/yr
- Unhealthy air days in 30 yrs
- 3 days/yr
Risk factors via First Street. Map © Google.
Why this score? — see what drove the F grade
The composite is a weighted blend of 9 inputs, each scored 0–100. Each bar is that input's sub-score; the figure is the points it added to the 100-point composite (weight × sub-score).
- Appreciation +8.9/10.0
- Cash flow +8.0/30.0
- Schools +3.2/10.0
- Livability +3.2/5.0
- 1% rule +2.5/10.0
- Rent growth +2.5/5.0
- Condition / age +2.5/5.0
- DSCR +2.1/10.0
- ARV discount +0.0/15.0
$145,000
🖨 Deal sheet (PDF) 📄 Offer letter ✓ Due diligence
Listing remarks
Cozy and practical, this 3-Bedroom 1-Bathroom home offers the perfect blend of comfort and functionality. Featuring updated LVP flooring, fresh paint, and water softener. The fully equipped Kitchen boasts hard countertops, ample storage in beautiful oak cabinets and eat-in area. This spacious floorplan is complemented by a fenced backyard-perfect for pets or entertaining-and a covered carport for year-round convenience. Equipment shed in the backyard and additional storage in carport with laundry room. Move-in ready!
Key facts
- Water softener
- Covered carport
- Updated lvp flooring
Tags
Neighborhood map
What this means for you Summary
Snapshot
- This is a 3-bed/1.0-bath single-family listed at $145k.
Deal economics
- At list price, monthly cash flow is $-147 ($-2k/yr) — negative.
- To cash-flow at today's rent, offer at most $124k (14.7% below list).
- To meet the 1% rule (rent ≥ 1% of price), the offer needs to be $108k (25.4% below list).
- Recommended offer: $108k (25.4% below list) — sets the bar for 1% rule.
Location & tenants
- Location reads 63/100 on livability (#216 in OK) — a middle-class / working-renter tenant base. Strengths: cost of living A+, housing A+, crime A-; Watch: employment D, schools F, amenities F.
- Mannsville (rural): math 30% / reading 40% proficiency, ranked #170 of 513 in OK (top 33%) — families likely to look elsewhere, expect single-tenant / working-renter base with shorter leases; 79% free/reduced lunch — lower-income household profile, screen leases tightly.
- Market conditions: 3 active listings in the ZIP; 2 units permitted in Johnston County in 2024 (0 in 5+ unit buildings).
Forward outlook
- In year one you build about $12k of equity ($1k loan paydown + $11k appreciation (7.7% local appreciation)).
- By year 3, paydown + projected appreciation supports a ~$30k cash-out refi (75% LTV) — recoverable capital for the next deal without selling this one.
Negotiation context
- Only 7 days on market — expect competitive offers; lowballing is unlikely to land.
Risks & watch-outs
- Climate carrying-cost: major wildfire risk; extreme-heat days projected 7→20/yr by 2055 (HVAC capex compounding) — expect insurance premiums to compound above CPI over the hold.
Questions for the listing agent
- What do current leases actually rent for vs. the listed asking? Can we see a recent rent roll and the last 12 months of T-12 income?
- Is there a deadline driving the sale (1031 exchange, divorce, estate, relocation)? That informs how much negotiation room exists.
- Schools are F-rated, which usually means shorter tenancies and higher turnover. Who's the typical renter profile here, and what's been the actual vacancy rate?
- The area grade is low — what's the realistic commute time and amenity access for the typical tenant pool here? Any planned neighborhood developments (good or bad) we should know about?
- What's the average days-on-market for RENTAL listings here right now (not sales)? A rising rental-DOM trend means longer vacancies and softer asking-rent achievability than the comps imply.
- What's the recent tenant-quality profile in this submarket — average credit score on applications, eviction rate, late-payment / NSF rate, and stable-employment percentage? A property-management company in the area should have these aggregated.
- How much new for-sale + rental construction is in the pipeline within 1–3 miles? Heavy new supply typically softens prices + rents 12–24 months out; constrained supply supports both.
Investment metrics
- 1% rule
- 0.75% ✗
- Cap rate
- 5.07%
- Cash-on-cash
- -4.36%
- DSCR
- 0.81
- GRM
- 11.2
CMA / ARV
- ARV (on-the-fly)
- $109,080
- Comps found
- 3
Show comp detail 3 sales within ~0.75 mi
| Address | Dist | Beds/Ba | Sqft | Sold | Price | $/sf | Match |
|---|---|---|---|---|---|---|---|
| 16 North St | 0.51mi | 3/1.0 | 1,036 (-4%) | 7mo | $92,499 | $89 | 64 |
| 209 S 16th | 0.23mi | 3/1.0 | 960 (-11%) | 12mo | $97,000 | $101 | 61 |
| 400 E Broadway | 0.32mi | 3/1.0 | 1,008 (-7%) | 21mo | $123,000 | $122 | 57 |
Match score weights: distance 35% · size 25% · config 20% · recency 20%. Top-matched comps best support the ARV.
Projected returns pro-forma
7.72% appreciation · 3.0% rent growth · sell at horizon
- IRR
- 16.1%
- Equity multiple
- 2.18×
- Total profit
- $47,806
- Equity at exit
- $107,443
- IRR
- 15.6%
- Equity multiple
- 4.59×
- Total profit
- $145,662
- Equity at exit
- $210,732
Cash invested: $40,600 (down + closing). Projections, not guarantees.
Landlord ↔ Tenant lean methodology
- Overall (STATE)
- 83 Strongly Landlord-Friendly
- State Oklahoma
- 83 Strongly Landlord-Friendly · R+20
- County
- — inherits STATE
- City
- — inherits STATE
ZIP-level market 73447
- Home prices YoY
- 2.1%
- Active inventory
- 3
- Price-to-rent
- 11.2×
Monthly cashflow live
- Estimated rent
- $1,082 medium interval (Pro) →
- Mortgage (P&I)
- −$760
- Tax est. 1.5%
- −$181 /mo · $2,175/yr
- Insurance
- −$60
- HOA
- −$0
- Vacancy / Maint / Mgmt
- −$227
- Net cashflow
- $-147
Break-even live
Sensitivity live
| Price | -10% $-47 | -5% $-97 | +0% $-147 | +5% $-197 | +10% $-248 |
|---|---|---|---|---|---|
| Rent | -10% $-233 | -5% $-190 | +0% $-147 | +5% $-105 | +10% $-62 |
| Rate | -1.0pp $-74 | -0.5pp $-111 | base $-147 | +0.5pp $-185 | +1.0pp $-223 |
UW: 25.0% down · 7.5% · 30yr · 1.5% tax · 5.0% vac · 8.0% maint · 8.0% mgmt
Financing live
Cash to close
- Down payment
- $36,250
- Closing costs
- $4,350
- Reserves months
- —
- Total cash needed
- —
Loan-product check · same deal, 3 products live
Conventional
25% down · 7.5% · 30yr
- Down + closing
- —
- Monthly P&I
- —
- Monthly cashflow
- —
- DSCR
- —
- Eligible?
- —
Personal DTI + credit; lowest rate.
DSCR
20% down · 8.5% · 30yr
- Down + closing
- —
- Monthly P&I
- —
- Monthly cashflow
- —
- DSCR
- —
- Eligible?
- —
No personal income docs; deal must DSCR.
Hard money
10% down · 12.0% · 12mo
- Down + closing
- —
- Monthly P&I
- —
- Monthly cashflow
- —
- DSCR
- —
- Eligible?
- —
Short-term bridge; refi at stabilization.
Listing history 2 events
-
2026-04-28status Pending
-
2026-04-20$145,000 Active
ⓘ Source: listings_history table (triggers on properties + properties_extension) + one-shot
backfill from property_details.listing_events for pre-trigger history.
Climate risk First Street
- Flood 1/10 Low FEMA zone X (unshaded) · 0% chance over 30 yrs
- Wildfire 6/10 Major
- Heat 6/10 Major 7 d/yr ≥110°F today · 20 d/yr by 30 yrs out
- Wind 4/10 Moderate 13% chance of damaging wind over 30 yrs
- Air quality 3/10 Moderate 2 unhealthy d/yr today · 3 by 30 yrs out
Nearby sold comps map
Loading sold comps map…
Walkable amenities ~0.75 mi
Loading nearby amenities…
Taxation est. · year 1
- Rental income
- $12,982
- − Mortgage interest
- −$8,122
- − Property taxes
- −$2,175
- − Insurance
- −$725
- − Repairs & maintenance
- −$1,039
- − Management
- −$1,039
- − Depreciation
- −$4,218
- Taxable loss
- −$4,335
- Est. tax savings @ 24.0%
- +$1,040
- After-tax cash flow
- $-728/yr
For passive investors: Depreciation is non-cash, so a rental often shows a tax loss while cash-flowing — sheltering income. Rental losses are passive: they offset passive income freely, and up to $25,000/yr can offset ordinary (W-2) income if you actively participate and your MAGI is under $100k (phasing out to $0 by $150k); unused losses carry forward. On sale, claimed depreciation is recaptured at up to 25%, and gains may owe capital-gains tax (a 1031 exchange can defer both). Figures are a year-1 estimate at your 24.0% rate — not tax advice; consult a CPA.
Schools (NCES district)
- District
- Mannsville
- NCES district ID
- 4018870
- Math proficiency
- 30% ▼ -20.00%
- Reading proficiency
- 40% ▼ -20.00%
- Median HH income
- $44,781
- Composite
- 32.46/100
- National rank
- #10855
- State rank
- #170 of 513 in OK
Livability — Mannsville
- Score
- 63/100
- State rank
- #216
- US rank
- #15590
Category grades
Schools grade is shown separately in the Schools card above.
Census & demographics
- Census place
- Mannsville, OK
- Population (ZIP)
- 1,104
Population outlook (Johnston County) Hauer SSP2
- Today (2025)
- 11,201 people
- By 2030
- 11,244 · +0.4%
- By 2040
- 11,212 · +0.1%
- By 2050
- 10,993 · -1.9%
- By 2075
- 10,708 · -4.4%
- By 2100
- 10,764 · -3.9%
Race, ethnicity, and origin ACS 2023
- Neighborhood character
- Diverse neighborhood (Simpson 0.57)
- Race & ethnicity
- White 64% Two or more races 23% Hispanic / Latino 15% Native American 5%
- Hispanic origin (detail)
- Mexican 13%
- Common ancestry
- Slovak 2% European 2% Lithuanian 1%
- Foreign-born
- 5% · Canada
- Languages at home
- 90% English-only · Spanish 10%
Political lean MEDSL · Johnston
- 2024 margin
- Solid R (+65.7) · D 16.2% · R 81.8% · Other 2.0%
- 2008→2024 swing
- -28.8pp toward R · 2008: -36.9pp · 2024: -65.7pp
- All cycles
- 2024: R+65.7 2020: R+63.6 2016: R+57.5 2012: R+40.0 2008: R+36.9
Not yet ingested
- Civics
- —
Market trends
- HPI YoY
- ▲ 7.72%
- Current HPI
- 381.0026
- Rent YoY
- —
- Metro
- —
- State GDP YoY
- ▲ 1.55%
- F500 in state
- 6
Industry mix (Fortune 500 HQ in OK)
| Industry | F500 HQs | Revenue |
|---|---|---|
| Energy | 3 | $48B |
|
||
Price history
2 events — show timeline
- 2026-04-28 Pending — MLS Technology, Inc.
- 2026-04-20 Listed $145,000 MLS Technology, Inc.
Property tax history
-1.5%/yrLatest (2025): $72 · +0.0% YoY. Source: county tax records.
Cash-flow waterfall
monthlySold comps — $/sqft
last 12 mo · ≤1 miLoading sold comps…