9911 Bayou Woods Dr · Baytown, TX
Flood risk 1/10 · Minimal
- FEMA flood zone
- X (unshaded)
- Chance of flooding over 30 yrs
- 0.0%
- Est. flood insurance / yr
- $507 – $1,088
Fire risk 3/10 · Minor
- Est. fire insurance / yr
- $1,222 – $2,270
Heat risk 9/10 · Severe
- Hot days now (above 111°F)
- 7 days/yr
- Hot days in 30 yrs
- 25 days/yr
Wind risk 9/10 · Severe
- Chance of severe wind over 30 yrs
- 99.0%
Air-quality risk 2/10 · Minimal
- Unhealthy air days now
- 1 days/yr
- Unhealthy air days in 30 yrs
- 1 days/yr
Risk factors via First Street. Map © Google.
Why this score? — see what drove the D- grade
The composite is a weighted blend of 9 inputs, each scored 0–100. Each bar is that input's sub-score; the figure is the points it added to the 100-point composite (weight × sub-score).
- Cash flow +12.2/30.0
- ARV discount +6.3/15.0
- 1% rule +4.0/10.0
- DSCR +3.6/10.0
- Livability +3.5/5.0
- Schools +3.2/10.0
- Rent growth +2.9/5.0
- Condition / age +2.5/5.0
- Appreciation +0.0/10.0
$235,000
🖨 Deal sheet 📄 Offer letter ✓ Due diligence
Listing remarks
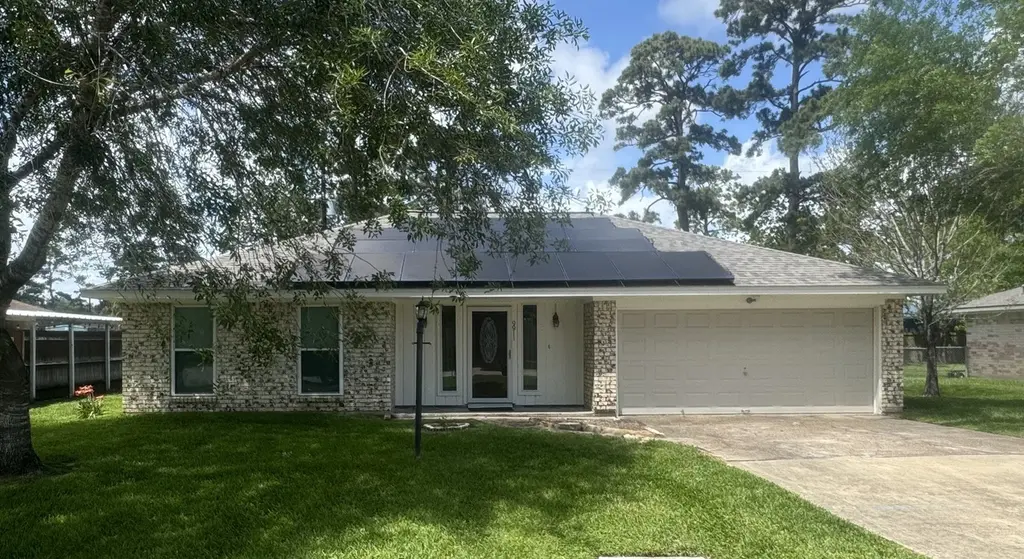
You won't want to miss this unique opportunity in Baytown's Pinehurst subdivision. The home is 1388 sq ft and offers 3 bedrooms and 2 updated full baths, with a spacious living room, cute kitchen, and breakfast nook. There are also solar panels (already paid for) on the main home for energy savings. The additional building is 818 sq ft and offers a large main room with vaulted ceiling, another smaller room, a full bath with shower, and a bonus space upstairs. There are so many possibilities - workshop, guest cottage, pool house - it's up to you! And the yard has plenty of space to add a pool. This property is an estate and is being sold AS IS, so use your imagination and bring your dreams t
Key facts
- Large main room
- Vaulted ceiling
- Guest house
Tags
Property features AI
Finance
- HOA & community: Pinehurst HOA/CMI with an annual fee of $120
Exterior
- Parking: Attached garage; Driveway; Garage (2 spaces total)
- Utilities: Public water; Public sewer
- Home design: Residential property; One-story entry (rooms listed on first floor)
- Construction: Built in 1978; Brick and wood siding exterior; Composition roof; Slab foundation
- Exterior features: Private yard; Cleared lot
Interior
- Kitchen: Electric oven; Electric range; Refrigerator; Water softener (owned and rented noted)
- Bedrooms: Primary bedroom on first floor; Additional bedrooms on first floor (total possible bedrooms: 4)
- Flooring: Vinyl
- Bathrooms: 3 full bathrooms
- Heating & cooling: Central heating (electric); Central air conditioning (electric)
- Interior features: Entrance foyer; High ceilings; Tub with shower; Ceiling fans; Kitchen/dining combo; Ventilation system
- Laundry & utility: Washer hookup; Electric dryer hookup
Neighborhood map
What this means for you Summary
Snapshot
- This is a 3-bed/3.0-bath single-family listed at $235k.
Deal economics
- At list price, monthly cash flow is $-49 ($-588/yr) — negative.
- To cash-flow at today's rent, offer at most $226k (3.7% below list).
- To meet the 1% rule (rent ≥ 1% of price), the offer needs to be $211k (10.1% below list).
- Recommended offer: $211k (10.1% below list) — sets the bar for 1% rule.
- Cap rate 6.0% vs local median 4.2% in Baytown — top-decile yield for the area; either an underpriced asset or a hidden risk that comps aren't pricing in. Stress-test before assuming the spread holds.
Location & tenants
- Location reads 69/100 on livability (#412 in TX) — a middle-class / working-renter tenant base. Strengths: cost of living A+, housing A+; Watch: employment D+, crime F, amenities F.
- Goose Creek CISD (urban): math 37% / reading 36% proficiency, ranked #473 of 826 in TX (top 57%) — families likely to look elsewhere, expect single-tenant / working-renter base with shorter leases; 61% free/reduced lunch — lower-income household profile, screen leases tightly.
- Zoned schools: E F Green Junior School (1,020 students, 67% FRL); High Point School (12 students, 75% FRL).
- Market conditions: Rents rising (+1.5%/yr); 612 active listings in the ZIP; 4 comparable units currently listed for rent nearby; rentals leasing fast (median 1d on market — plan ~1-2 weeks tenant-placement turnaround); 629 units permitted in Chambers County in 2024 (0 in 5+ unit buildings).
- This rent runs 34% of the median local income ($74k/yr) — at the standard rent-burdened threshold; future hikes will face affordability resistance.
Forward outlook
- Local home prices are declining (-3.0%/yr); year-one equity from $2k of loan paydown is wiped out by about $7k of value loss. Plan a longer hold.
- Chambers County population projected at +46% by 2050 — long-run rental-demand tailwind backs the buy-and-hold thesis.
Negotiation context
- It's been on market 24 days — a 2% lower offer ($231k) is reasonable based on typical stale-listing flexibility.
Risks & watch-outs
- Climate carrying-cost: severe wind risk, 99% chance of damaging wind over 30y; extreme-heat days projected 7→25/yr by 2055 (HVAC capex compounding) — expect insurance premiums to compound above CPI over the hold.
Questions for the listing agent
- What do current leases actually rent for vs. the listed asking? Can we see a recent rent roll and the last 12 months of T-12 income?
- Built in 1978 — when were the roof, HVAC, electrical panel, plumbing, and water heater last replaced?
- What does the HOA fee cover, when was the last increase, and are there any pending special assessments or reserve-fund shortfalls?
- Is there a deadline driving the sale (1031 exchange, divorce, estate, relocation)? That informs how much negotiation room exists.
- Schools are D-rated, which usually means shorter tenancies and higher turnover. Who's the typical renter profile here, and what's been the actual vacancy rate?
- Crime grade is F in this area — have there been break-ins, vandalism, or insurance claims at this property in the last 3 years? What carrier currently insures it and at what premium?
- The area grade is low — what's the realistic commute time and amenity access for the typical tenant pool here? Any planned neighborhood developments (good or bad) we should know about?
- What's the average days-on-market for RENTAL listings here right now (not sales)? A rising rental-DOM trend means longer vacancies and softer asking-rent achievability than the comps imply.
- What's the recent tenant-quality profile in this submarket — average credit score on applications, eviction rate, late-payment / NSF rate, and stable-employment percentage? A property-management company in the area should have these aggregated.
- How much new for-sale + rental construction is in the pipeline within 1–3 miles? Heavy new supply typically softens prices + rents 12–24 months out; constrained supply supports both.
Investment metrics
- 1% rule
- 0.90% ✗
- Cap rate
- 6.04%
- Cash-on-cash
- -0.89%
- DSCR
- 0.96
- GRM
- 9.3
CMA / ARV
- ARV (on-the-fly)
- $229,020
- Comps found
- 12
Show comp detail 12 sales within ~0.75 mi
| Address | Dist | Beds/Ba | Sqft | Sold | Price | $/sf | Match |
|---|---|---|---|---|---|---|---|
| 9911 Bayou Woods Dr | 0.00mi | 3/3.0 | 1,388 (0%) | 1mo | $235,000 | $169 | 99 |
| 9802 Bayou Woods Dr | 0.20mi | 3/2.0 | 1,413 (+2%) | 2mo | $239,500 | $169 | 82 |
| 9915 Bayou Woods Dr | 0.02mi | 3/2.0 | 1,484 (+7%) | 3mo | $244,900 | $165 | 81 |
| 9942 Bayou Woods Dr | 0.12mi | 3/2.0 | 1,481 (+7%) | 0mo | $210,000 | $142 | 79 |
| 7319 Willow Oak Dr | 0.14mi | 3/2.0 | 1,488 (+7%) | 5mo | $237,000 | $159 | 73 |
| 9910 El Chaco St | 0.09mi | 3/2.0 | 1,512 (+9%) | 8mo | $254,900 | $169 | 70 |
| 7318 Palmetto Ln | 0.28mi | 3/2.0 | 1,440 (+4%) | 8mo | $234,900 | $163 | 70 |
| 10010 Pinehurst St | 0.18mi | 3/2.5 | 1,546 (+11%) | 8mo | $284,000 | $184 | 64 |
| 7319 Pine Shadows Ln | 0.37mi | 3/2.0 | 1,472 (+6%) | 9mo | $237,000 | $161 | 62 |
| 10014 Bayou Woods Dr | 0.20mi | 3/2.0 | 1,568 (+13%) | 12mo | $250,000 | $159 | 55 |
| 9618 Bayou Woods Dr | 0.46mi | 3/2.0 | 1,481 (+7%) | 12mo | $224,400 | $152 | 53 |
| 7123 Shoshoni St | 0.42mi | 3/2.0 | 1,539 (+11%) | 10mo | $269,900 | $175 | 50 |
Match score weights: distance 35% · size 25% · config 20% · recency 20%. Top-matched comps best support the ARV.
Projected returns pro-forma
-3.0% appreciation · 1.48% rent growth · sell at horizon
- IRR
- -19.5%
- Equity multiple
- 0.33×
- Total profit
- $-44,294
- Equity at exit
- $35,039
- IRR
- -16.0%
- Equity multiple
- 0.17×
- Total profit
- $-54,891
- Equity at exit
- $20,319
Cash invested: $65,800 (down + closing). Projections, not guarantees.
Landlord ↔ Tenant lean methodology
- Overall (STATE)
- 87 Strongly Landlord-Friendly
- State Texas
- 87 Strongly Landlord-Friendly · R+5
- County
- — inherits STATE
- City
- — inherits STATE
ZIP-level market 77521
- Rents YoY
- 1.5%
- Active inventory
- 612
- Price-to-rent
- 9.3×
Monthly cashflow live
- Estimated rent
- $2,112 medium interval (Pro) →
- Mortgage (P&I)
- −$1,232
- Tax from tax record
- −$377 /mo · $4,529/yr
- Insurance
- −$98
- HOA
- −$10
- Vacancy / Maint / Mgmt
- −$444
- Net cashflow
- $-49
Break-even live
UW: 25.0% down · 7.5% · 30yr · 1.5% tax · 5.0% vac · 8.0% maint · 8.0% mgmt
Financing live
Cash to close
- Down payment
- $58,750
- Closing costs
- $7,050
- Reserves months
- —
- Total cash needed
- —
Loan-product check · same deal, 3 products live
Conventional
25% down · 7.5% · 30yr
- Down + closing
- —
- Monthly P&I
- —
- Monthly cashflow
- —
- DSCR
- —
- Eligible?
- —
Personal DTI + credit; lowest rate.
DSCR
20% down · 8.5% · 30yr
- Down + closing
- —
- Monthly P&I
- —
- Monthly cashflow
- —
- DSCR
- —
- Eligible?
- —
No personal income docs; deal must DSCR.
Hard money
10% down · 12.0% · 12mo
- Down + closing
- —
- Monthly P&I
- —
- Monthly cashflow
- —
- DSCR
- —
- Eligible?
- —
Short-term bridge; refi at stabilization.
Rent comps 4 comps
| Address | Beds | Baths | Sqft | Rent | $/sqft | DOM | Units | Dist |
|---|---|---|---|---|---|---|---|---|
| 1716 Sterling Dr Baytown, TX | 3.0 | 2.0 | 1371 | $2,250 | $1.64 | 43d | 1 | 0.81mi |
| 1900 Kilgore Pkwy Baytown, TX | 1.0–2.0 | 1.0–2.0 | 918 | $1,956 | $2.13 | 1d | 17 | 0.93mi |
| 2100 Kilgore Pkwy Baytown, TX | 1.0–2.0 | 1.0–2.0 | 920 | $1,964 | $2.13 | 1d | 13 | 1.18mi |
| 10235 Cedar Crossing St Baytown, TX | 1.0–3.0 | 1.0–2.0 | 1097 | $2,506 | $2.28 | 1d | 27 | 1.22mi |
HOA detail
- Monthly dues
- $10 · $120/yr
- Likely covers
- pool
Listing history 5 events
-
2026-05-06status Pending
-
2026-04-29status Pending
-
2026-04-12$235,000 Active
-
2000-08-23soldstatus
-
1986-10-22soldstatus
ⓘ Source: listings_history table (triggers on properties + properties_extension) + one-shot
backfill from property_details.listing_events for pre-trigger history.
Tax reassessment forecast TX · Resets to sale price
- Current annual tax
- $4,529 · $377/mo
- Projected year-2 tax
- $4,529 · $377/mo
- Expected delta
- $0/yr ($0/mo · 0.0%)
ⓘ Screening estimate from a state-policy table — verify with the county assessor before closing.
Climate risk First Street
- Flood 1/10 Low FEMA zone X (unshaded) · 0% chance over 30 yrs
- Wildfire 3/10 Moderate
- Heat 9/10 Extreme 7 d/yr ≥111°F today · 25 d/yr by 30 yrs out
- Wind 9/10 Extreme 99% chance of damaging wind over 30 yrs
- Air quality 2/10 Low 1 unhealthy d/yr today · 1 by 30 yrs out
Nearby sold comps map
Loading sold comps map…
Walkable amenities ~0.75 mi
Loading nearby amenities…
Taxation est. · year 1
- Rental income
- $25,348
- − Mortgage interest
- −$13,164
- − Property taxes
- −$4,529
- − Insurance
- −$1,175
- − Repairs & maintenance
- −$2,028
- − Management
- −$2,028
- − HOA
- −$120
- − Depreciation
- −$6,836
- Taxable loss
- −$4,532
- Est. tax savings @ 24.0%
- +$1,088
- After-tax cash flow
- $500/yr
For passive investors: Depreciation is non-cash, so a rental often shows a tax loss while cash-flowing — sheltering income. Rental losses are passive: they offset passive income freely, and up to $25,000/yr can offset ordinary (W-2) income if you actively participate and your MAGI is under $100k (phasing out to $0 by $150k); unused losses carry forward. On sale, claimed depreciation is recaptured at up to 25%, and gains may owe capital-gains tax (a 1031 exchange can defer both). Figures are a year-1 estimate at your 24.0% rate — not tax advice; consult a CPA.
Schools (NCES district)
- District
- Goose Creek CISD
- NCES district ID
- 4821150
- Math proficiency
- 37% ▼ -11.00%
- Reading proficiency
- 36% ▼ -4.00%
- Median HH income
- $52,468
- Composite
- 31.84/100
- National rank
- #5877
- State rank
- #473 of 826 in TX
Livability — Baytown
- Score
- 69/100
- State rank
- #412
- US rank
- #8494
Category grades
Schools grade is shown separately in the Schools card above.
Census & demographics
- Census place
- Baytown, TX
- County
- Harris County · 4,702,590 people
- City population
- 135,579
- Metro
- Houston-The Woodlands-Sugar Land, TX
- Population (ZIP)
- 69,038
- Household income
- $73,629
- Rent vs Own
- Severe rent burden
- 2121.0
Population outlook (Chambers County) Hauer SSP2
- Today (2025)
- 46,946 people
- By 2030
- 51,094 · +8.8%
- By 2040
- 59,578 · +26.9%
- By 2050
- 68,318 · +45.5%
- By 2075
- 90,485 · +92.7%
- By 2100
- 104,885 · +123.4%
Race, ethnicity, and origin ACS 2023
- Neighborhood character
- Diverse neighborhood (Simpson 0.64)
- Race & ethnicity
- Hispanic / Latino 50% White 28% Two or more races 18% Black 17% Asian 3%
- Hispanic origin (detail)
- Mexican 42% Puerto Rican 2%
- Common ancestry
- Lithuanian 2% Slovak 1%
- Foreign-born
- 20% · Canada, Vietnam
- Languages at home
- 59% English-only · Spanish 36% French/Haitian/Cajun 1% Other Asian/Pacific 1%
Political lean MEDSL · Chambers
- 2024 margin
- Solid R (+65.6) · D 16.8% · R 82.4%
- 2008→2024 swing
- -14.4pp toward R · 2008: -51.2pp · 2024: -65.6pp
- All cycles
- 2024: R+65.6 2020: R+61.7 2016: R+62.1 2012: R+61.1 2008: R+51.2
Not yet ingested
- Civics
- —
Market trends
- HPI YoY
- ▼ -154.80%
- Current HPI
- 246.1892
- Rent YoY
- ▲ 1.48%
- Metro
- Houston-The Woodlands-Sugar Land, TX
- State GDP YoY
- ▲ 3.95%
- F500 in state
- 110
Industry mix (Fortune 500 HQ in TX)
| Industry | F500 HQs | Revenue |
|---|---|---|
| Energy | 16 | $1,198B |
|
||
| Technology | 5 | $198B |
|
||
| Engineering / Construction | 4 | $72B |
|
||
| Energy Services | 3 | $60B |
|
||
| Utilities | 3 | $41B |
|
||
| Healthcare | 2 | $330B |
|
||
Price history
5 events — show timeline
- 2026-05-06 Pending — HARMLS
- 2026-04-29 Pending — HARMLS
- 2026-04-12 Listed $235,000 HARMLS
- 2000-08-23 Sold (Public Records) — Public Records
- 1986-10-22 Sold (Public Records) — Public Records
Property tax history
+1.2%/yrLatest (2025): $4,529 · +9.9% YoY. Source: county tax records.
Cash-flow waterfall
monthlySold comps — $/sqft
last 12 mo · ≤1 miLoading sold comps…