76 North St · Le Roy, NY
Flood risk 1/10 · Minimal
- FEMA flood zone
- X
- Chance of flooding over 30 yrs
- 0.0%
- Est. flood insurance / yr
- $473 – $860
Fire risk 1/10 · Minimal
- Est. fire insurance / yr
- $691 – $1,283
Heat risk 2/10 · Minimal
- Hot days now (above 94°F)
- 7 days/yr
- Hot days in 30 yrs
- 15 days/yr
Wind risk 1/10 · Minimal
- Chance of severe wind over 30 yrs
- —
Air-quality risk 2/10 · Minimal
- Unhealthy air days now
- 1 days/yr
- Unhealthy air days in 30 yrs
- 2 days/yr
Risk factors via First Street. Map © Google.
Why this score? — see what drove the B grade
The composite is a weighted blend of 9 inputs, each scored 0–100. Each bar is that input's sub-score; the figure is the points it added to the 100-point composite (weight × sub-score).
- Cash flow +30.0/30.0
- 1% rule +10.0/10.0
- DSCR +10.0/10.0
- ARV discount +7.5/15.0
- Schools +4.9/10.0
- Livability +3.5/5.0
- Rent growth +2.5/5.0
- Condition / age +2.5/5.0
- Appreciation +0.0/10.0
$64,000
🖨 Deal sheet (PDF) 📄 Offer letter ✓ Due diligence
Listing remarks MLS
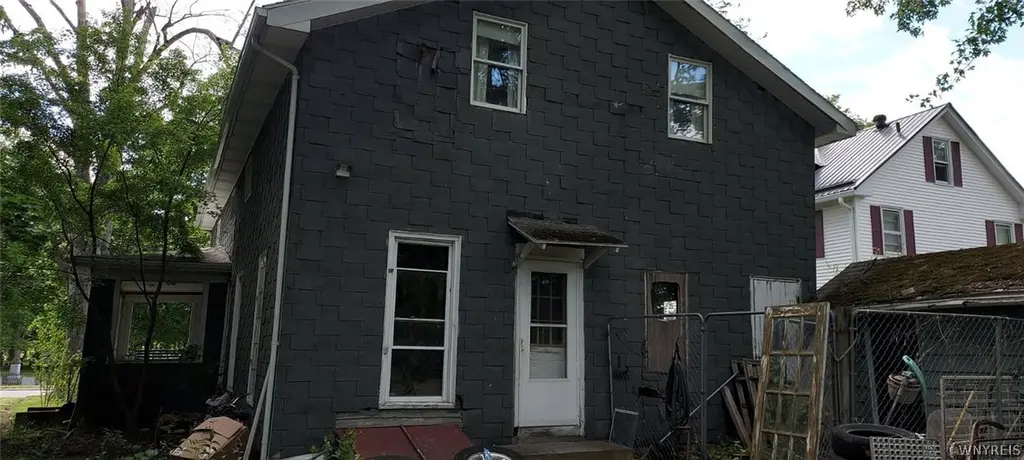
This is a well-cared for 4-bedroom home with charm abounding! Lovely, neutral paint colors on the main floor with a great floor plan! Clean and tidy! Hardwood floors, newer metal roof, new blacktop driveway with a turn-around, nice back deck & a nice, deep lot.
Key facts
- 0.47 acre lot
- Built 1900
- Listed 11 days
Property features AI
Exterior
- Parking: No garage
- Home design: Two-story existing property
- Construction: Construction details: see remarks
- Exterior features: Exterior details: see remarks; Rectangular lot with 75 x 271 dimensions; Main thoroughfare road frontage
Interior
- Bedrooms: One main-level bedroom
- Bathrooms: Two full bathrooms with one on the main level
- Heating & cooling: Heating details: see remarks
- Interior features: Other interior features (see remarks)
- Laundry & utility: Water heater included
Neighborhood map
What this means for you Summary
Snapshot
- This is a 3-bed/2.0-bath single-family listed at $64k.
Deal economics
- At list price, monthly cash flow is $566 ($7k/yr) — positive.
- The deal already cash-flows at list — no discount required.
- Meets the 1% rule at list price ($1k rent vs $64k).
Location & tenants
- Location reads 69/100 on livability (#467 in NY) — a middle-class / working-renter tenant base. Strengths: housing A+, health & safety A+, cost of living A; Watch: employment D+, amenities F, commute F.
- Le Roy Central School District (town): math 56% / reading 59% proficiency, ranked #269 of 590 in NY (top 46%) — acceptable for families but not a draw, mixed tenant base, ~2y average lease.
- Zoned schools: Wolcott Street School (math 55% / reading 61%, grade C+, #833 of 2,108 statewide, top 40%, 609 students, 47% FRL); Le Roy Junior-Senior High School (math 58% / reading 57%, grade C, #884 of 1,100 statewide, top 80%, 543 students, 39% FRL) — zoned schools average 43% FRL vs 24% district-wide (19 pts higher); higher-poverty schools than district average — tighter screening recommended.
- Market conditions: 20 active listings in the ZIP; 55 units permitted in Genesee County in 2024 (0 in 5+ unit buildings).
Forward outlook
- Local home prices are declining (-3.0%/yr); year-one equity from $442 of loan paydown is wiped out by about $2k of value loss. Plan a longer hold.
- Genesee County population projected at -22% by 2050 — secular population decline; favor cash flow + early exit over multi-decade hold.
- At projected returns (-3.0% appreciation + 3.0% rent growth), your $18k cash investment doubles in ~4 years — after that, you're playing with house money.
Negotiation context
- Only 11 days on market — expect competitive offers; lowballing is unlikely to land.
- 2 sale attempts since 6y ago; this cycle's ask has dropped $11k (15%) from the opening price — seller is motivated, your offer sets the floor, not the list.
Risks & watch-outs
- Watch-outs: built in 1900 — expect roof / HVAC / electrical / plumbing capex.
Questions for the listing agent
- Built in 1900 — when were the roof, HVAC, electrical panel, plumbing, and water heater last replaced?
- Is there a deadline driving the sale (1031 exchange, divorce, estate, relocation)? That informs how much negotiation room exists.
- What's the average days-on-market for RENTAL listings here right now (not sales)? A rising rental-DOM trend means longer vacancies and softer asking-rent achievability than the comps imply.
- What's the recent tenant-quality profile in this submarket — average credit score on applications, eviction rate, late-payment / NSF rate, and stable-employment percentage? A property-management company in the area should have these aggregated.
- How much new for-sale + rental construction is in the pipeline within 1–3 miles? Heavy new supply typically softens prices + rents 12–24 months out; constrained supply supports both.
Investment metrics
- 1% rule
- 1.99% ✓
- Cap rate
- 16.90%
- Cash-on-cash
- 37.88%
- DSCR
- 2.69
- GRM
- 4.2
CMA / ARV
- ARV (on-the-fly)
- $283,140
- Comps found
- 4
Show comp detail 4 sales within ~0.75 mi
| Address | Dist | Beds/Ba | Sqft | Sold | Price | $/sf | Match |
|---|---|---|---|---|---|---|---|
| 80 E Main St | 0.50mi | 4/1.5 (+1) | 2,564 (+6%) | 3mo | $300,000 | $117 | 57 |
| 78 E Main St | 0.51mi | 3/2.0 | 2,077 (-14%) | 2mo | $315,000 | $152 | 51 |
| 2 1/2 North St | 0.48mi | 4/2.0 (+1) | 2,140 (-12%) | 19mo | $225,000 | $105 | 37 |
| 4 Garden Ln | 0.62mi | 2/2.5 (-1) | 2,631 (+9%) | 16mo | $265,000 | $101 | 36 |
Match score weights: distance 35% · size 25% · config 20% · recency 20%. Top-matched comps best support the ARV.
Projected returns pro-forma
-3.0% appreciation · 3.0% rent growth · sell at horizon
- IRR
- 33.9%
- Equity multiple
- 2.43×
- Total profit
- $25,680
- Equity at exit
- $9,543
- IRR
- 40.8%
- Equity multiple
- 4.84×
- Total profit
- $68,836
- Equity at exit
- $5,534
Cash invested: $17,920 (down + closing). Projections, not guarantees.
Landlord ↔ Tenant lean methodology
- Overall (STATE)
- 15 Strongly Tenant-Friendly
- State New York
- 15 Strongly Tenant-Friendly · D+10
- County
- — inherits STATE
- City
- — inherits STATE
ZIP-level market 14482
- Home prices YoY
- -13.2%
- Active inventory
- 20
- Price-to-rent
- 4.2×
Monthly cashflow live
- Estimated rent
- $1,276 medium interval (Pro) →
- Mortgage (P&I)
- −$336
- Tax est. 1.5%
- −$80 /mo · $960/yr
- Insurance
- −$27
- HOA
- −$0
- Vacancy / Maint / Mgmt
- −$268
- Net cashflow
- $566
Break-even live
Sensitivity live
| Price | -10% $610 | -5% $588 | +0% $566 | +5% $544 | +10% $521 |
|---|---|---|---|---|---|
| Rent | -10% $465 | -5% $515 | +0% $566 | +5% $616 | +10% $667 |
| Rate | -1.0pp $598 | -0.5pp $582 | base $566 | +0.5pp $549 | +1.0pp $532 |
UW: 25.0% down · 7.5% · 30yr · 1.5% tax · 5.0% vac · 8.0% maint · 8.0% mgmt
Financing live
Cash to close
- Down payment
- $16,000
- Closing costs
- $1,920
- Reserves months
- —
- Total cash needed
- —
Loan-product check · same deal, 3 products live
Conventional
25% down · 7.5% · 30yr
- Down + closing
- —
- Monthly P&I
- —
- Monthly cashflow
- —
- DSCR
- —
- Eligible?
- —
Personal DTI + credit; lowest rate.
DSCR
20% down · 8.5% · 30yr
- Down + closing
- —
- Monthly P&I
- —
- Monthly cashflow
- —
- DSCR
- —
- Eligible?
- —
No personal income docs; deal must DSCR.
Hard money
10% down · 12.0% · 12mo
- Down + closing
- —
- Monthly P&I
- —
- Monthly cashflow
- —
- DSCR
- —
- Eligible?
- —
Short-term bridge; refi at stabilization.
Listing history 10 events
-
2026-06-17status $64,000 Pending 11 DOM
-
2026-06-16days on market $64,000 Active 11 DOM
-
2026-06-15pricedays on market $64,000 Active 10 DOM
-
2026-06-14days on market $74,900 Active 8 DOM
-
2026-06-12days on market $74,900 Active 7 DOM
-
2026-06-09days on market $74,900 Active 4 DOM
-
2026-06-08days on market $74,900 Active 3 DOM
-
2026-06-07days on market $74,900 Active 2 DOM
-
2026-06-07remarks 256-char remark
-
2026-06-07$74,900 Active 1 DOM
ⓘ Source: listings_history table (triggers on properties + properties_extension) + one-shot
backfill from property_details.listing_events for pre-trigger history.
Climate risk First Street
- Flood 1/10 Low FEMA zone X · 0% chance over 30 yrs
- Wildfire 1/10 Low
- Heat 2/10 Low 7 d/yr ≥94°F today · 15 d/yr by 30 yrs out
- Wind 1/10 Low
- Air quality 2/10 Low 1 unhealthy d/yr today · 2 by 30 yrs out
Nearby sold comps map
Loading sold comps map…
Walkable amenities ~0.75 mi
Loading nearby amenities…
Taxation est. · year 1
- Rental income
- $15,312
- − Mortgage interest
- −$3,585
- − Property taxes
- −$960
- − Insurance
- −$320
- − Repairs & maintenance
- −$1,225
- − Management
- −$1,225
- − Depreciation
- −$1,862
- Taxable income
- $6,135
- Est. tax owed @ 24.0%
- −$1,472
- After-tax cash flow
- $5,316/yr
For passive investors: Depreciation is non-cash, so a rental often shows a tax loss while cash-flowing — sheltering income. Rental losses are passive: they offset passive income freely, and up to $25,000/yr can offset ordinary (W-2) income if you actively participate and your MAGI is under $100k (phasing out to $0 by $150k); unused losses carry forward. On sale, claimed depreciation is recaptured at up to 25%, and gains may owe capital-gains tax (a 1031 exchange can defer both). Figures are a year-1 estimate at your 24.0% rate — not tax advice; consult a CPA.
Schools (NCES district)
- District
- Le Roy Central School District
- NCES district ID
- 3616950
- Math proficiency
- 56% ▼ -4.00%
- Reading proficiency
- 59% ▲ 7.00%
- Median HH income
- $53,618
- Composite
- 49.34/100
- National rank
- #2019
- State rank
- #269 of 590 in NY
Livability — Le Roy
- Score
- 69/100
- State rank
- #467
- US rank
- #8160
Category grades
Schools grade is shown separately in the Schools card above.
Census & demographics
- Census place
- Le Roy, NY
- Population (ZIP)
- 8,233
Population outlook (Genesee County) Hauer SSP2
- Today (2025)
- 56,113 people
- By 2030
- 54,140 · -3.5%
- By 2040
- 49,368 · -12.0%
- By 2050
- 43,911 · -21.7%
- By 2075
- 32,511 · -42.1%
- By 2100
- 21,695 · -61.3%
Race, ethnicity, and origin ACS 2023
- Neighborhood character
- Predominantly White (94%)
- Race & ethnicity
- White 94% Two or more races 3% Hispanic / Latino 2% Black 1%
- Common ancestry
- Romanian 8% Serbian 3% Slovak 2%
- Foreign-born
- 1% · Canada
- Languages at home
- 98% English-only · Spanish 1% German/W. Germanic 1%
Political lean MEDSL · Genesee
- 2024 margin
- Solid R (+34.0) · D 33.0% · R 67.0%
- 2008→2024 swing
- -15.6pp toward R · 2008: -18.4pp · 2024: -34.0pp
- All cycles
- 2024: R+34.0 2020: R+31.7 2016: R+37.0 2012: R+20.9 2008: R+18.4
Not yet ingested
- Civics
- —
Market trends
- HPI YoY
- ▼ -40.90%
- Current HPI
- 268.8832
- Rent YoY
- —
- Metro
- —
- State GDP YoY
- ▲ 2.60%
- F500 in state
- 92
Industry mix (Fortune 500 HQ in NY)
| Industry | F500 HQs | Revenue |
|---|---|---|
| Financial Services | 10 | $950B |
|
||
| Consumer Goods | 9 | $162B |
|
||
| Insurance | 4 | $225B |
|
||
| Telecommunications | 2 | $144B |
|
||
| Pharmaceuticals | 2 | $112B |
|
||
| Media / Entertainment | 2 | $69B |
|
||
Price history
+10.1% since first listed7 events — show timeline
- 2026-06-05 Listed $74,900 WNYREIS
- 2020-05-22 Sold (MLS) $130,000 UNYREIS
- 2020-03-30 Pending — UNYREIS
- 2020-03-16 Pending — UNYREIS
- 2020-03-15 Contingent — UNYREIS
- 2020-03-11 Listed $124,900 UNYREIS
- 1998-06-24 Sold (Public Records) $68,000 Public Records
Property tax history
+6.7%/yrLatest (2025): $5,713 · +4.1% YoY. Source: county tax records.
Cash-flow waterfall
monthlySold comps — $/sqft
last 12 mo · ≤1 miLoading sold comps…