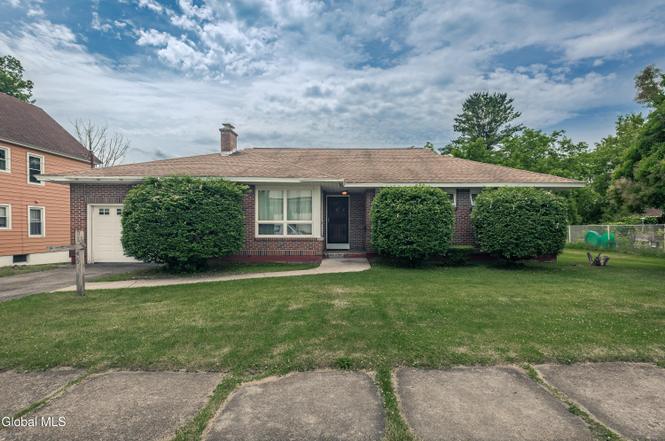
45 Catherine St · Amsterdam, NY
Flood risk 1/10 · Minimal
- FEMA flood zone
- X (unshaded)
- Chance of flooding over 30 yrs
- 0.0%
- Est. flood insurance / yr
- $473 – $860
Fire risk 3/10 · Minor
- Est. fire insurance / yr
- $691 – $1,283
Heat risk 3/10 · Minor
- Hot days now (above 95°F)
- 7 days/yr
- Hot days in 30 yrs
- 17 days/yr
Wind risk 2/10 · Minimal
- Chance of severe wind over 30 yrs
- 4.0%
Air-quality risk 1/10 · Minimal
- Unhealthy air days now
- 0 days/yr
- Unhealthy air days in 30 yrs
- 0 days/yr
Risk factors via First Street. Map © Google.
Why this score? — see what drove the D grade
The composite is a weighted blend of 9 inputs, each scored 0–100. Each bar is that input's sub-score; the figure is the points it added to the 100-point composite (weight × sub-score).
- ARV discount +14.2/15.0
- Appreciation +10.0/10.0
- Cash flow +5.9/30.0
- Livability +3.8/5.0
- Schools +3.2/10.0
- Rent growth +2.5/5.0
- Condition / age +2.5/5.0
- 1% rule +2.0/10.0
- DSCR +0.3/10.0
$199,900
🖨 Deal sheet (PDF) 📄 Offer letter ✓ Due diligence
Listing remarks MLS
NICE FLOOR PLAN/QUIET NEIGHBORHOOD BIGGER THAN IT LOOKS TAXES DO NOT INCLUDE STAR OR ANY EXEMPTIONS
Key facts
- Large living room
- Eat-in kitchen
- Hardwood floors
Tags
Property features AI
Exterior
- Parking: One-car garage; Driveway; Three total parking spaces
- Utilities: Public water; Public sewer; Cable available
- Home design: Single-family residence; Brick construction; Shingle/asphalt roof; Concrete perimeter foundation
- Construction: Brick exterior; Concrete perimeter foundation; Shingle/asphalt roof
- Exterior features: Covered patio/porch; Level, sloped, and landscaped lot
Interior
- Kitchen: Built-in electric oven; Refrigerator
- Bedrooms: Primary bedroom on the first level; Two additional bedrooms on the first level
- Flooring: Tile; Wood
- Bathrooms: One full bathroom on the first level
- Heating & cooling: Baseboard heating; Central air conditioning
- Interior features: Built-in features; Full basement; One fireplace in the living room; Seven total rooms
- Laundry & utility: Dedicated laundry room on the first level
Neighborhood map
What this means for you Summary
Snapshot
- This is a 3-bed/1.0-bath single-family listed at $200k.
Deal economics
- At list price, monthly cash flow is $-389 ($-5k/yr) — negative.
- To cash-flow at today's rent, offer at most $131k (34.4% below list).
- To meet the 1% rule (rent ≥ 1% of price), the offer needs to be $139k (30.3% below list).
- Recommended offer: $131k (34.4% below list) — sets the bar for cash-flow.
- Cap rate 4.0% vs local median 6.3% in Amsterdam — below-typical yield; the buyer is paying a premium for something (appreciation thesis, condition, location) that the cap rate doesn't capture.
Location & tenants
- Location reads 75/100 on livability (#247 in NY, #3,884 nationally) — a middle-class / working-renter tenant base. Strengths: cost of living A+, housing A+, health & safety A+; Watch: crime F, employment F.
- Amsterdam City School District (town): math 35% / reading 41% proficiency, ranked #546 of 590 in NY (top 92%) — families likely to look elsewhere, expect single-tenant / working-renter base with shorter leases.
- Zoned schools: Wilbur H Lynch Literacy Academy (math 9% / reading 37%, grade F, #646 of 729 statewide, top 89%, 817 students, 75% FRL); Amsterdam High School (math 75% / reading 82%, grade A-, #563 of 1,100 statewide, top 52%, 1,179 students, 68% FRL) — zoned schools average 71% FRL vs 40% district-wide (32 pts higher); higher-poverty schools than district average — tighter screening recommended.
- Zoned-school proficiency averages 51% at this address vs 38% district-wide (+13 pts) — the actual schools serving this property are materially stronger than the Amsterdam City School District average implies; a family-tenant draw the district grade alone would hide.
- Market conditions: 165 active listings in the ZIP; 7 comparable units currently listed for rent nearby; rentals at typical pace (median 25d on market — plan ~3-4 weeks tenant-placement turnaround); 210 units permitted in Montgomery County in 2024 (168 in 5+ unit buildings).
Forward outlook
- In year one you build about $21k of equity ($1k loan paydown + $20k appreciation (10.0% local appreciation)).
- Montgomery County population projected at -11% by 2050 — secular population decline; favor cash flow + early exit over multi-decade hold.
- By year 2, paydown + projected appreciation supports a ~$34k cash-out refi (75% LTV) — recoverable capital for the next deal without selling this one.
Negotiation context
- Only 6 days on market — expect competitive offers; lowballing is unlikely to land.
- 2 sale attempts since 23y ago with the ask held roughly flat each time — persistent listings suggest the price (not the market) is what's stuck; bring a comps-based counter.
- Current owner paid $74k; list at $200k implies a 170% gain — meaningful room to come down on a strong offer.
Risks & watch-outs
- Watch-outs: built in 1959 — expect roof / HVAC / electrical / plumbing capex.
Questions for the listing agent
- What do current leases actually rent for vs. the listed asking? Can we see a recent rent roll and the last 12 months of T-12 income?
- Built in 1959 — when were the roof, HVAC, electrical panel, plumbing, and water heater last replaced?
- Is there a deadline driving the sale (1031 exchange, divorce, estate, relocation)? That informs how much negotiation room exists.
- Schools are D-rated, which usually means shorter tenancies and higher turnover. Who's the typical renter profile here, and what's been the actual vacancy rate?
- Crime grade is F in this area — have there been break-ins, vandalism, or insurance claims at this property in the last 3 years? What carrier currently insures it and at what premium?
- The area grade is low — what's the realistic commute time and amenity access for the typical tenant pool here? Any planned neighborhood developments (good or bad) we should know about?
- What's the average days-on-market for RENTAL listings here right now (not sales)? A rising rental-DOM trend means longer vacancies and softer asking-rent achievability than the comps imply.
- What's the recent tenant-quality profile in this submarket — average credit score on applications, eviction rate, late-payment / NSF rate, and stable-employment percentage? A property-management company in the area should have these aggregated.
- How much new for-sale + rental construction is in the pipeline within 1–3 miles? Heavy new supply typically softens prices + rents 12–24 months out; constrained supply supports both.
Investment metrics
- 1% rule
- 0.70% ✗
- Cap rate
- 3.96%
- Cash-on-cash
- -8.35%
- DSCR
- 0.63
- GRM
- 12.0
CMA / ARV
- ARV (on-the-fly)
- $234,576
- Comps found
- 12
Show comp detail 12 sales within ~0.75 mi
| Address | Dist | Beds/Ba | Sqft | Sold | Price | $/sf | Match |
|---|---|---|---|---|---|---|---|
| 42 Edson St | 0.20mi | 3/1.0 | 1,470 (-10%) | 7mo | $225,000 | $153 | 69 |
| 38 Edson St | 0.20mi | 3/1.5 | 1,449 (-11%) | 6mo | $313,000 | $216 | 65 |
| 1 Julia St | 0.24mi | 3/1.0 | 1,421 (-13%) | 5mo | $205,000 | $144 | 63 |
| 13 Hawk St | 0.22mi | 3/2.0 | 1,440 (-12%) | 10mo | $250,000 | $174 | 58 |
| 39 Kreisel Ter | 0.50mi | 4/1.0 (+1) | 1,730 (+6%) | 8mo | $170,000 | $98 | 55 |
| 12 Harrison Ave | 0.74mi | 4/1.5 (+1) | 1,664 (+2%) | 2mo | $200,000 | $120 | 54 |
| 53 Hibbard St | 0.44mi | 3/2.0 | 1,484 (-9%) | 11mo | $188,000 | $127 | 51 |
| 11 Lefferts St | 0.66mi | 3/2.0 | 1,760 (+8%) | 7mo | $115,000 | $65 | 46 |
| 4 Bigelow Ave | 0.73mi | 4/1.5 (+1) | 1,710 (+5%) | 10mo | $270,000 | $158 | 42 |
| 70 Mccleary Ave | 0.74mi | 3/1.5 | 1,482 (-9%) | 11mo | $277,000 | $187 | 39 |
| 331 Chapman Dr | 0.67mi | 3/1.5 | 1,464 (-10%) | 14mo | $187,000 | $128 | 38 |
| 46 Slater St | 0.57mi | 4/2.0 (+1) | 1,392 (-14%) | 9mo | $141,500 | $102 | 33 |
Match score weights: distance 35% · size 25% · config 20% · recency 20%. Top-matched comps best support the ARV.
Projected returns pro-forma
10.0% appreciation · 3.0% rent growth · sell at horizon
- IRR
- 18.4%
- Equity multiple
- 2.50×
- Total profit
- $84,166
- Equity at exit
- $180,086
- IRR
- 17.2%
- Equity multiple
- 5.78×
- Total profit
- $267,527
- Equity at exit
- $388,362
Cash invested: $55,972 (down + closing). Projections, not guarantees.
Landlord ↔ Tenant lean methodology
- Overall (STATE)
- 15 Strongly Tenant-Friendly
- State New York
- 15 Strongly Tenant-Friendly · D+10
- County
- — inherits STATE
- City
- — inherits STATE
ZIP-level market 12010
- Home prices YoY
- 4.0%
- Active inventory
- 165
- Price-to-rent
- 12.0×
Monthly cashflow live
- Estimated rent
- $1,394 high interval (Pro) →
- Mortgage (P&I)
- −$1,048
- Tax from tax record
- −$359 /mo · $4,306/yr
- Insurance
- −$83
- HOA
- −$0
- Vacancy / Maint / Mgmt
- −$293
- Net cashflow
- $-389
Break-even live
Sensitivity live
| Price | -10% $-276 | -5% $-333 | +0% $-389 | +5% $-446 | +10% $-502 |
|---|---|---|---|---|---|
| Rent | -10% $-499 | -5% $-444 | +0% $-389 | +5% $-334 | +10% $-279 |
| Rate | -1.0pp $-289 | -0.5pp $-338 | base $-389 | +0.5pp $-441 | +1.0pp $-494 |
UW: 25.0% down · 7.5% · 30yr · 1.5% tax · 5.0% vac · 8.0% maint · 8.0% mgmt
Financing live
Cash to close
- Down payment
- $49,975
- Closing costs
- $5,997
- Reserves months
- —
- Total cash needed
- —
Loan-product check · same deal, 3 products live
Conventional
25% down · 7.5% · 30yr
- Down + closing
- —
- Monthly P&I
- —
- Monthly cashflow
- —
- DSCR
- —
- Eligible?
- —
Personal DTI + credit; lowest rate.
DSCR
20% down · 8.5% · 30yr
- Down + closing
- —
- Monthly P&I
- —
- Monthly cashflow
- —
- DSCR
- —
- Eligible?
- —
No personal income docs; deal must DSCR.
Hard money
10% down · 12.0% · 12mo
- Down + closing
- —
- Monthly P&I
- —
- Monthly cashflow
- —
- DSCR
- —
- Eligible?
- —
Short-term bridge; refi at stabilization.
Rent comps 7 comps
| Address | Beds | Baths | Sqft | Rent | $/sqft | DOM | Units | Dist |
|---|---|---|---|---|---|---|---|---|
| 17 Grand St Amsterdam, NY | 4.0 | 1.0 | 1098 | $1,400 | $1.28 | 25d | 1 | 0.78mi |
| 49 Elizabeth St Amsterdam, NY | 3.0 | 1.0 | 1300 | $1,450 | $1.12 | 23d | 1 | 0.94mi |
| 214 Market St Amsterdam, NY | 3.0 | 1.5 | 1500 | $1,300 | $0.87 | 25d | 1 | 1.17mi |
| 214 Market St Amsterdam, NY | 3.0 | 1.5 | 1500 | $1,450 | $0.97 | 45d | 1 | 1.17mi |
| 70 Wall St Amsterdam, NY | 3.0 | 1.0 | 1098 | $1,300 | $1.18 | 21d | 1 | 1.22mi |
| 18 Garden St Amsterdam, NY | 3.0 | 1.0 | 1180 | $1,300 | $1.10 | 21d | 1 | 1.30mi |
| 62 Glen Ave Amsterdam, NY | 3.0 | 1.0 | 1115 | $1,550 | $1.39 | 25d | 1 | 1.31mi |
Listing history 6 events
-
2026-06-21statusdays on market $199,900 Pending 6 DOM
-
2026-06-18days on market $199,900 Active 4 DOM
-
2026-06-17days on market $199,900 Active 3 DOM
-
2026-06-16days on market $199,900 Active 2 DOM
-
2026-06-15remarks 699-char remark
-
2026-06-15$199,900 Active 1 DOM
ⓘ Source: listings_history table (triggers on properties + properties_extension) + one-shot
backfill from property_details.listing_events for pre-trigger history.
Tax reassessment forecast NY · Partial reset (capped growth)
- Current annual tax
- $4,306 · $359/mo
- Projected year-2 tax
- $4,306 · $359/mo
- Expected delta
- $0/yr ($0/mo · 0.0%)
ⓘ Screening estimate from a state-policy table — verify with the county assessor before closing.
Climate risk First Street
- Flood 1/10 Low FEMA zone X (unshaded) · 0% chance over 30 yrs
- Wildfire 3/10 Moderate
- Heat 3/10 Moderate 7 d/yr ≥95°F today · 17 d/yr by 30 yrs out
- Wind 2/10 Low 4% chance of damaging wind over 30 yrs
- Air quality 1/10 Low 0 unhealthy d/yr today · 0 by 30 yrs out
Nearby sold comps map
Loading sold comps map…
Walkable amenities ~0.75 mi
Loading nearby amenities…
Taxation est. · year 1
- Rental income
- $16,727
- − Mortgage interest
- −$11,198
- − Property taxes
- −$4,306
- − Insurance
- −$1,000
- − Repairs & maintenance
- −$1,338
- − Management
- −$1,338
- − Depreciation
- −$5,815
- Taxable loss
- −$8,268
- Est. tax savings @ 24.0%
- +$1,984
- After-tax cash flow
- $-2,687/yr
For passive investors: Depreciation is non-cash, so a rental often shows a tax loss while cash-flowing — sheltering income. Rental losses are passive: they offset passive income freely, and up to $25,000/yr can offset ordinary (W-2) income if you actively participate and your MAGI is under $100k (phasing out to $0 by $150k); unused losses carry forward. On sale, claimed depreciation is recaptured at up to 25%, and gains may owe capital-gains tax (a 1031 exchange can defer both). Figures are a year-1 estimate at your 24.0% rate — not tax advice; consult a CPA.
Schools (NCES district)
- District
- Amsterdam City School District
- NCES district ID
- 3602970
- Math proficiency
- 35% ▲ 5.00%
- Reading proficiency
- 41% ▲ 10.00%
- Median HH income
- $41,735
- Composite
- 32.03/100
- National rank
- #5824
- State rank
- #546 of 590 in NY
Livability — Amsterdam
- Score
- 75/100
- State rank
- #247
- US rank
- #3884
Category grades
Schools grade is shown separately in the Schools card above.
Census & demographics
- Census place
- Amsterdam, NY
- City population
- 27,339
- Population (ZIP)
- 27,339
Population outlook (Montgomery County) Hauer SSP2
- Today (2025)
- 48,683 people
- By 2030
- 47,785 · -1.8%
- By 2040
- 45,492 · -6.6%
- By 2050
- 43,161 · -11.3%
- By 2075
- 38,134 · -21.7%
- By 2100
- 32,337 · -33.6%
Race, ethnicity, and origin ACS 2023
- Neighborhood character
- Predominantly White (68%)
- Race & ethnicity
- White 68% Hispanic / Latino 23% Two or more races 9% Black 4% Asian 1%
- Hispanic origin (detail)
- Mexican 2% Puerto Rican 18%
- Common ancestry
- Romanian 12% Lithuanian 2% Iranian 2%
- Foreign-born
- 5% · Canada
- Languages at home
- 86% English-only · Spanish 11% Russian/Polish/Slavic 1% Other Indo-European 1%
Political lean MEDSL · Montgomery
- 2024 margin
- Strong R (+28.7) · D 35.6% · R 64.4%
- 2008→2024 swing
- -20.6pp toward R · 2008: -8.1pp · 2024: -28.7pp
- All cycles
- 2024: R+28.7 2020: R+22.6 2016: R+26.5 2012: R+4.4 2008: R+8.1
Not yet ingested
- Civics
- —
Market trends
- HPI YoY
- ▲ 12.12%
- Current HPI
- 312.4966
- Rent YoY
- —
- Metro
- —
- State GDP YoY
- ▲ 2.60%
- F500 in state
- 92
Industry mix (Fortune 500 HQ in NY)
| Industry | F500 HQs | Revenue |
|---|---|---|
| Financial Services | 10 | $950B |
|
||
| Consumer Goods | 9 | $162B |
|
||
| Insurance | 4 | $225B |
|
||
| Telecommunications | 2 | $144B |
|
||
| Pharmaceuticals | 2 | $112B |
|
||
| Media / Entertainment | 2 | $69B |
|
||
Price history
+139.4% since first listed5 events — show timeline
- 2026-06-13 Listed $199,900 Global MLS
- 2003-07-03 Sold (Public Records) $74,000 Public Records
- 2003-07-02 Sold (MLS) $74,000 Global MLS
- 2003-05-19 Listing Removed — Global MLS
- 2003-04-13 Listed $83,500 Global MLS
Property tax history
+1.1%/yrLatest (2025): $4,306 · -5.4% YoY. Source: county tax records.
Cash-flow waterfall
monthlySold comps — $/sqft
last 12 mo · ≤1 miLoading sold comps…