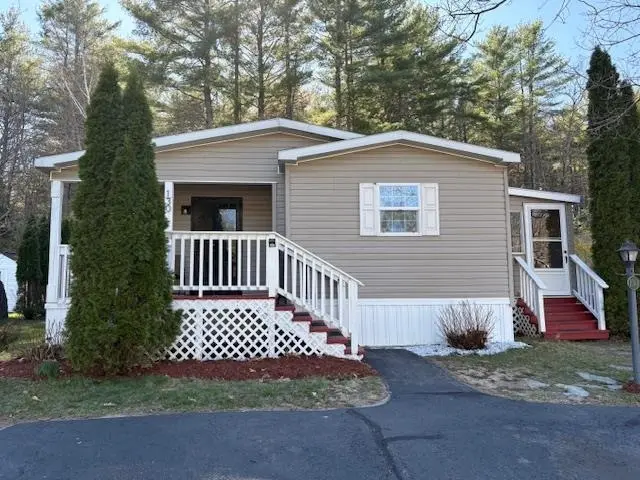
130 Eagle Dr · Rochester, NH
Flood risk 1/10 · Minimal
- FEMA flood zone
- X (unshaded)
- Chance of flooding over 30 yrs
- 0.0%
- Est. flood insurance / yr
- $507 – $1,088
Fire risk 1/10 · Minimal
- Est. fire insurance / yr
- $507 – $941
Heat risk 4/10 · Minor
- Hot days now (above 97°F)
- 7 days/yr
- Hot days in 30 yrs
- 15 days/yr
Wind risk 4/10 · Minor
- Chance of severe wind over 30 yrs
- 17.0%
Air-quality risk 2/10 · Minimal
- Unhealthy air days now
- 1 days/yr
- Unhealthy air days in 30 yrs
- 1 days/yr
Risk factors via First Street. Map © Google.
Why this score? — see what drove the D- grade
The composite is a weighted blend of 9 inputs, each scored 0–100. Each bar is that input's sub-score; the figure is the points it added to the 100-point composite (weight × sub-score).
- ARV discount +15.0/15.0
- 1% rule +4.8/10.0
- Livability +4.2/5.0
- Rent growth +3.6/5.0
- Cash flow +3.3/30.0
- Schools +2.7/10.0
- Condition / age +2.5/5.0
- DSCR +0.0/10.0
- Appreciation +0.0/10.0
$189,900
🖨 Deal sheet (PDF) 📄 Offer letter ✓ Due diligence
Listing remarks
TARA ESTATES AT A GREAT PRICE!! Looking for a private home, where you can enjoy a delightful community 55+ and over? Tara Estates has it for you! This home offers convenient, single level, open concept, kitchen/living room living. Beautifully designed with 3 bedrooms, 2 bathrooms, full tub and walk in shower. Large primary bedroom with private on suite. A recent updated 3 season porch for those quiet mornings or entertaining. A front porch adds charm and curb appeal. Residents enjoy an active clubhouse with a gym, library, shuffleboard courts and space for private gatherings. Weekly community events include bingo, coffee hours, poker, crafting, book club and potluck dinners. Let your new l
Key facts
- Active clubhouse
- Shuffleboard courts
- 3 season porch
Tags
Property features AI
Finance
- Other: Located off Salmon Falls Road
- HOA & community: Association fee of 720 (monthly); One-time fee listed as 720; Association amenities include a clubhouse; Association roads/private road frontage; association handles plowing and trash
Exterior
- Parking: Paved driveway
- Utilities: Public water; Public sewer; 200 amp electric service; High-speed internet available; Cable available
- Home design: Manufactured/Mobile home; Existing construction
- Construction: Built in 2002; Vinyl siding; Shingle roof
- Exterior features: Level lot; Paved driveway; Located in Tara Estates (mobile park) with park approval
Interior
- Kitchen: Microwave; Refrigerator; Electric stove
- Flooring: Carpet; Laminate
- Bathrooms: 1 full bathroom; 1 three-quarter bathroom
- Heating & cooling: Kerosene heating; Hot air heating; Central air conditioning
- Interior features: 6 total rooms; Carpet and laminate flooring
- Laundry & utility: Washer; Dryer; Electric water heater
Neighborhood map
What this means for you Summary
Snapshot
- This is a 2-bed/2.0-bath manufactured listed at $190k.
Deal economics
- At list price, monthly cash flow is $-591 ($-7k/yr) — negative.
- To cash-flow at today's rent, offer at most $86k (55.0% below list).
- To meet the 1% rule (rent ≥ 1% of price), the offer needs to be $186k (2.1% below list).
- Recommended offer: $86k (55.0% below list) — sets the bar for cash-flow.
- Cap rate 2.6% vs local median 3.3% in Rochester — below-typical yield; the buyer is paying a premium for something (appreciation thesis, condition, location) that the cap rate doesn't capture.
Location & tenants
- Location reads 84/100 on livability (#8 in NH, #698 nationally) — a professional / high-income tenant draw. Strengths: crime A+, commute A+, cost of living A+; Watch: amenities C-.
- Rochester School District (suburban): math 27% / reading 35% proficiency, ranked #83 of 98 in NH (top 85%) — families likely to look elsewhere, expect single-tenant / working-renter base with shorter leases.
- Market conditions: Rents rising fast (+4.2%/yr); 109 active listings in the ZIP; 2 comparable units currently listed for rent nearby; solid renter incomes; 951 units permitted in Strafford County in 2024 (551 in 5+ unit buildings).
Forward outlook
- Local home prices are declining (-3.0%/yr); year-one equity from $1k of loan paydown is wiped out by about $6k of value loss. Plan a longer hold.
- Strafford County population projected at +7% by 2050 — modest demand growth; plan on rents tracking national, not racing it.
Negotiation context
- It's been on market 56 days — a 3% lower offer ($184k) is reasonable based on typical stale-listing flexibility.
- 3 sale attempts since 20y ago with the ask held roughly flat each time — persistent listings suggest the price (not the market) is what's stuck; bring a comps-based counter.
- Current owner paid $119k; list at $190k implies a 60% gain — meaningful room to come down on a strong offer.
Risks & watch-outs
- Watch-outs: HOA is 39% of rent.
Questions for the listing agent
- What do current leases actually rent for vs. the listed asking? Can we see a recent rent roll and the last 12 months of T-12 income?
- It's been on market 56 days. Have you received any prior offers? Is the seller open to a 55% concession, seller financing, or rate buy-down credit?
- What does the HOA fee cover, when was the last increase, and are there any pending special assessments or reserve-fund shortfalls?
- Is there a deadline driving the sale (1031 exchange, divorce, estate, relocation)? That informs how much negotiation room exists.
- The area grade is low — what's the realistic commute time and amenity access for the typical tenant pool here? Any planned neighborhood developments (good or bad) we should know about?
- What's the average days-on-market for RENTAL listings here right now (not sales)? A rising rental-DOM trend means longer vacancies and softer asking-rent achievability than the comps imply.
- What's the recent tenant-quality profile in this submarket — average credit score on applications, eviction rate, late-payment / NSF rate, and stable-employment percentage? A property-management company in the area should have these aggregated.
- How much new for-sale + rental construction is in the pipeline within 1–3 miles? Heavy new supply typically softens prices + rents 12–24 months out; constrained supply supports both.
Investment metrics
- 1% rule
- 0.98% ✗
- Cap rate
- 2.56%
- Cash-on-cash
- -13.33%
- DSCR
- 0.41
- GRM
- 8.5
CMA / ARV
- ARV (median comp)
- $253,442
- List price
- $189,900
- Delta
- -25.07%
- Verdict
- UNDERPRICED
- Comps
- 20 within 1.0 mi
Show comp detail 12 sales within ~0.75 mi
| Address | Dist | Beds/Ba | Sqft | Sold | Price | $/sf | Match |
|---|---|---|---|---|---|---|---|
| 7 Diamondback Dr | 0.20mi | 2/2.0 | 1,232 (+2%) | 0mo | $226,000 | $183 | 87 |
| 88 Eagle Dr | 0.19mi | 3/2.0 (+1) | 1,188 (-1%) | 0mo | $192,000 | $162 | 84 |
| 36 Murray Dr | 0.15mi | 2/2.0 | 1,188 (-1%) | 10mo | $170,000 | $143 | 83 |
| 10 Erin Ln | 0.18mi | 3/2.0 (+1) | 1,177 (-2%) | 3mo | $215,000 | $183 | 80 |
| 71 Eagle Dr | 0.25mi | 2/1.5 | 1,152 (-4%) | 0mo | $247,400 | $215 | 79 |
| 24 Murray Dr | 0.16mi | 2/2.0 | 1,260 (+5%) | 13mo | $130,000 | $103 | 74 |
| 132 Eagle Dr | 0.01mi | 2/2.0 | 1,332 (+11%) | 14mo | $287,000 | $215 | 70 |
| 34 Murray Dr | 0.15mi | 2/2.0 | 1,080 (-10%) | 12mo | $170,000 | $157 | 66 |
| 72 Eagle Dr | 0.24mi | 3/2.0 (+1) | 1,296 (+8%) | 9mo | $179,900 | $139 | 64 |
| 29 Eagle Dr | 0.37mi | 3/2.0 (+1) | 1,254 (+4%) | 11mo | $200,000 | $159 | 62 |
| 74 Eagle Dr | 0.23mi | 2/1.5 | 1,080 (-10%) | 10mo | $195,000 | $181 | 62 |
| 8 York Ct | 0.31mi | 2/1.5 | 1,056 (-12%) | 12mo | $160,000 | $152 | 53 |
Match score weights: distance 35% · size 25% · config 20% · recency 20%. Top-matched comps best support the ARV.
Projected returns pro-forma
-3.0% appreciation · 4.22% rent growth · sell at horizon
- IRR
- -38.3%
- Equity multiple
- -0.23×
- Total profit
- $-65,600
- Equity at exit
- $28,315
- IRR
- -40.8%
- Equity multiple
- -0.77×
- Total profit
- $-93,877
- Equity at exit
- $16,419
Cash invested: $53,172 (down + closing). Projections, not guarantees.
Landlord ↔ Tenant lean methodology
- Overall (STATE)
- 56 Moderately Landlord-Leaning
- State New Hampshire
- 56 Moderately Landlord-Leaning · D+1
- County
- — inherits STATE
- City
- — inherits STATE
ZIP-level market 03867
- Home prices YoY
- -22.0%
- Rents YoY
- 4.2%
- Active inventory
- 109
- Price-to-rent
- 8.5×
Monthly cashflow live
- Estimated rent
- $1,859 medium interval (Pro) →
- Mortgage (P&I)
- −$996
- Tax from tax record
- −$264 /mo · $3,173/yr
- Insurance
- −$79
- HOA
- −$720
- Vacancy / Maint / Mgmt
- −$390
- Net cashflow
- $-591
Break-even live
Sensitivity live
| Price | -10% $-483 | -5% $-537 | +0% $-591 | +5% $-644 | +10% $-698 |
|---|---|---|---|---|---|
| Rent | -10% $-738 | -5% $-664 | +0% $-591 | +5% $-517 | +10% $-444 |
| Rate | -1.0pp $-495 | -0.5pp $-542 | base $-591 | +0.5pp $-640 | +1.0pp $-690 |
UW: 25.0% down · 7.5% · 30yr · 1.5% tax · 5.0% vac · 8.0% maint · 8.0% mgmt
Financing live
Cash to close
- Down payment
- $47,475
- Closing costs
- $5,697
- Reserves months
- —
- Total cash needed
- —
Loan-product check · same deal, 3 products live
Conventional
25% down · 7.5% · 30yr
- Down + closing
- —
- Monthly P&I
- —
- Monthly cashflow
- —
- DSCR
- —
- Eligible?
- —
Personal DTI + credit; lowest rate.
DSCR
20% down · 8.5% · 30yr
- Down + closing
- —
- Monthly P&I
- —
- Monthly cashflow
- —
- DSCR
- —
- Eligible?
- —
No personal income docs; deal must DSCR.
Hard money
10% down · 12.0% · 12mo
- Down + closing
- —
- Monthly P&I
- —
- Monthly cashflow
- —
- DSCR
- —
- Eligible?
- —
Short-term bridge; refi at stabilization.
Rent comps 2 comps
| Address | Beds | Baths | Sqft | Rent | $/sqft | DOM | Units | Dist |
|---|---|---|---|---|---|---|---|---|
| 6 Mill St Unit A Rochester, NH | 1.0 | 1.0 | 700 | $1,200 | $1.71 | 25d | 1 | 1.30mi |
| 616 Portland St #69 Rochester, NH | 2.0 | 1.0 | 856 | $2,250 | $2.63 | 25d | 1 | 1.41mi |
HOA detail
- Monthly dues
- $720 · $8,640/yr
- Likely covers
- gym
Listing history 23 events
-
2026-06-21days on market $189,900 Active 56 DOM
-
2026-06-18days on market $189,900 Active 53 DOM
-
2026-06-17days on market $189,900 Active 52 DOM
-
2026-06-16days on market $189,900 Active 51 DOM
-
2026-06-16remarks 699-char remark
-
2026-06-16price $189,900 Active 50 DOM
-
2026-06-15days on market $199,000 Active 50 DOM
-
2026-06-13days on market $199,000 Active 48 DOM
-
2026-06-13days on market $199,000 Active 47 DOM
-
2026-06-09days on market $199,000 Active 44 DOM
-
2026-06-08days on market $199,000 Active 43 DOM
-
2026-06-07days on market $199,000 Active 42 DOM
-
2026-06-04days on market $199,000 Active 39 DOM
-
2026-06-03days on market $199,000 Active 38 DOM
-
2026-06-02days on market $199,000 Active 37 DOM
-
2026-06-01days on market $199,000 Active 36 DOM
-
2026-05-31days on market $199,000 Active 35 DOM
-
2026-04-26$199,000 Active 678-char remark
-
2015-11-19price $79,900
-
2006-05-26soldstatus $119,000
-
2006-05-26soldstatus $119,000
-
2006-05-22historical
-
2006-03-03$129,900
ⓘ Source: listings_history table (triggers on properties + properties_extension) + one-shot
backfill from property_details.listing_events for pre-trigger history.
Tax reassessment forecast NH · Partial reset (capped growth)
- Current annual tax
- $3,173 · $264/mo
- Projected year-2 tax
- $3,656 · $305/mo
- Expected delta
- +$483/yr (+$40/mo · 15.2%)
ⓘ Screening estimate from a state-policy table — verify with the county assessor before closing.
Climate risk First Street
- Flood 1/10 Low FEMA zone X (unshaded) · 0% chance over 30 yrs
- Wildfire 1/10 Low
- Heat 4/10 Moderate 7 d/yr ≥97°F today · 15 d/yr by 30 yrs out
- Wind 4/10 Moderate 17% chance of damaging wind over 30 yrs
- Air quality 2/10 Low 1 unhealthy d/yr today · 1 by 30 yrs out
Nearby sold comps map
Loading sold comps map…
Walkable amenities ~0.75 mi
Loading nearby amenities…
Taxation est. · year 1
- Rental income
- $22,309
- − Mortgage interest
- −$10,637
- − Property taxes
- −$3,173
- − Insurance
- −$950
- − Repairs & maintenance
- −$1,785
- − Management
- −$1,785
- − HOA
- −$8,640
- − Depreciation
- −$5,524
- Taxable loss
- −$10,185
- Est. tax savings @ 24.0%
- +$2,444
- After-tax cash flow
- $-4,645/yr
For passive investors: Depreciation is non-cash, so a rental often shows a tax loss while cash-flowing — sheltering income. Rental losses are passive: they offset passive income freely, and up to $25,000/yr can offset ordinary (W-2) income if you actively participate and your MAGI is under $100k (phasing out to $0 by $150k); unused losses carry forward. On sale, claimed depreciation is recaptured at up to 25%, and gains may owe capital-gains tax (a 1031 exchange can defer both). Figures are a year-1 estimate at your 24.0% rate — not tax advice; consult a CPA.
Schools (NCES district)
- District
- Rochester School District
- NCES district ID
- 3305940
- Math proficiency
- 27% ▼ -15.00%
- Reading proficiency
- 35% ▼ -14.00%
- Median HH income
- $51,080
- Composite
- 27.11/100
- National rank
- #7039
- State rank
- #83 of 98 in NH
Livability — Rochester
- Score
- 84/100
- State rank
- #8
- US rank
- #698
Category grades
Schools grade is shown separately in the Schools card above.
Census & demographics
- Census place
- Rochester, NH
- County
- Strafford County · 75,181 people
- City population
- 22,732
- Metro
- Boston-Cambridge-Newton, MA-NH
- Population (ZIP)
- 22,732
- Household income
- $78,674
- Rent vs Own
- Severe rent burden
- 663.0
Population outlook (Strafford County) Hauer SSP2
- Today (2025)
- 132,503 people
- By 2030
- 135,377 · +2.2%
- By 2040
- 139,609 · +5.4%
- By 2050
- 141,803 · +7.0%
- By 2075
- 149,280 · +12.7%
- By 2100
- 148,667 · +12.2%
Race, ethnicity, and origin ACS 2023
- Neighborhood character
- Predominantly White (93%)
- Race & ethnicity
- White 93% Two or more races 4% Hispanic / Latino 2% Asian 1%
- Common ancestry
- Lithuanian 12% Romanian 2% Serbian 2%
- Foreign-born
- 3% · Canada
- Languages at home
- 96% English-only · Spanish 1% French/Haitian/Cajun 1%
Political lean MEDSL · Strafford
- 2024 margin
- D (+12.1) · D 55.5% · R 43.5% · Other 1.0%
- 2008→2024 swing
- -8.3pp toward R · 2008: 20.4pp · 2024: 12.1pp
- All cycles
- 2024: D+12.1 2020: D+15.2 2016: D+8.6 2012: D+14.5 2008: D+20.4
Not yet ingested
- Civics
- —
Market trends
- HPI YoY
- ▼ -107.34%
- Current HPI
- 379.5755
- Rent YoY
- ▲ 4.22%
- Metro
- Boston-Cambridge-Newton, MA-NH
- State GDP YoY
- —
- F500 in state
- 0
Price history
+46.2% since first listed8 events — show timeline
- 2026-06-16 Price Changed $189,900 PrimeMLS
- 2026-04-26 Listed $199,000 PrimeMLS
- 2015-11-19 Price Changed $79,900 PrimeMLS
- 2009-10-06 Listed $110,000 MREIS
- 2006-05-26 Sold (Public Records) $119,000 Public Records
- 2006-05-26 Sold (MLS) $119,000 PrimeMLS
- 2006-05-22 Delisted — PrimeMLS
- 2006-03-03 Listed $129,900 PrimeMLS
Property tax history
+3.0%/yrLatest (2025): $3,173 · +3.0% YoY. Source: county tax records.
Cash-flow waterfall
monthlySold comps — $/sqft
last 12 mo · ≤1 miLoading sold comps…