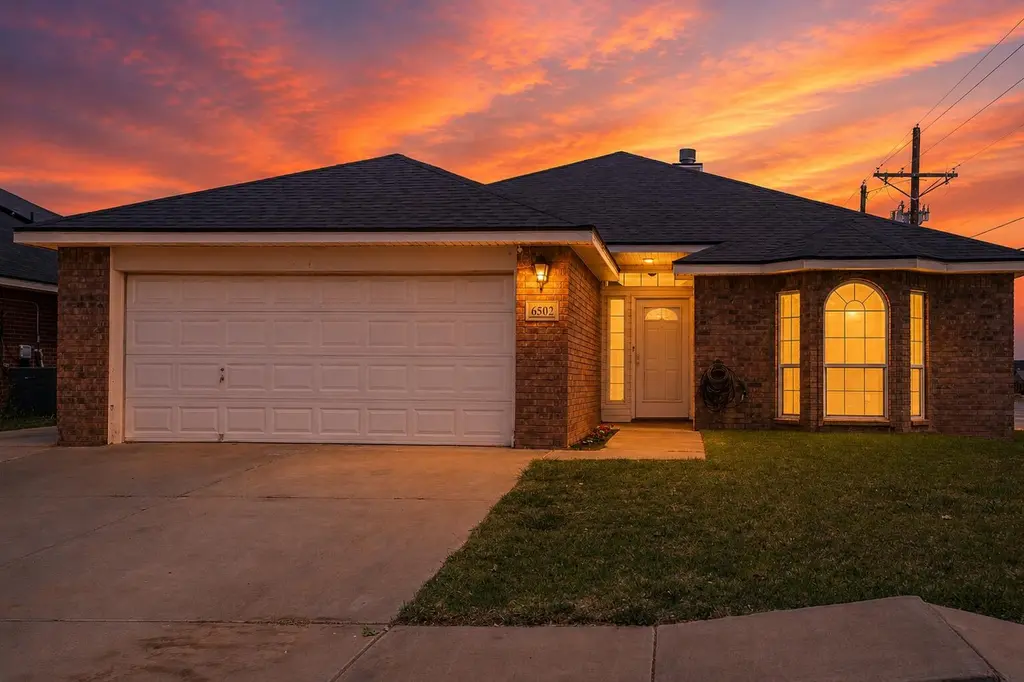
6502 89th St · Lubbock, TX
Flood risk 1/10 · Minimal
- FEMA flood zone
- X (unshaded)
- Chance of flooding over 30 yrs
- 0.0%
- Est. flood insurance / yr
- $507 – $1,088
Fire risk 3/10 · Minor
- Est. fire insurance / yr
- $1,222 – $2,270
Heat risk 5/10 · Moderate
- Hot days now (above 99°F)
- 7 days/yr
- Hot days in 30 yrs
- 19 days/yr
Wind risk 2/10 · Minimal
- Chance of severe wind over 30 yrs
- —
Air-quality risk 2/10 · Minimal
- Unhealthy air days now
- 1 days/yr
- Unhealthy air days in 30 yrs
- 1 days/yr
Risk factors via First Street. Map © Google.
Why this score? — see what drove the D grade
The composite is a weighted blend of 9 inputs, each scored 0–100. Each bar is that input's sub-score; the figure is the points it added to the 100-point composite (weight × sub-score).
- ARV discount +13.9/15.0
- Cash flow +8.1/30.0
- Schools +4.4/10.0
- Livability +4.0/5.0
- Rent growth +3.2/5.0
- 1% rule +2.7/10.0
- Condition / age +2.5/5.0
- DSCR +2.1/10.0
- Appreciation +0.0/10.0
$233,000
🖨 Deal sheet (PDF) 📄 Offer letter ✓ Due diligence
Listing remarks MLS
Incredible price on this Southwest Lubbock Home, featuring 3 Bedrooms, 2 Bathrooms and 2-Car Garage. You'll love the open floor plan, isolated master bedroom, covered patio, large corner lot and so much more! Minutes to Lubbock's most popular shopping, restaurants and entertainment. Frenship Schools and quick access to Brownfield Highway make the neighborhood highly sought after. Don't miss this property. Schedule your appointment today!
Key facts
- Newly built shed
- Open living area
- Ample cabinet space
Tags
Property features AI
Exterior
- Parking: Attached garage with 2 parking spaces; Garage door opener; Off-street parking; On-street parking; Paved driveway/areas
- Utilities: Public water; Public sewer; Sewer connected; Electricity available; Cable available; Phone available; Underground utilities; Water available
- Home design: Single-family residence; Residential property; City lot; Paved city street frontage; Publicly maintained road
- Construction: Brick construction; Composition roof; Slab foundation; Built on slab
- Exterior features: Private backyard; Awnings; Exterior lighting; Covered rear porch; Shed(s); Wood fencing with gate; Back yard fencing
Interior
- Kitchen: Cooktop; Electric oven; Dishwasher; Microwave; Garbage disposal; Pantry; Eat-in kitchen; Breakfast bar
- Bedrooms: Total rooms: 5
- Flooring: Ceramic tile; Tile; Carpet
- Bathrooms: 2 full bathrooms
- Heating & cooling: Central heating; Fireplace heating; Central air; Ductless cooling; Ceiling fans; Electric components
- Interior features: Breakfast bar; Built-in features; Ceiling fans; Double vanity; Eat-in kitchen; Open floorplan; Pantry; Recessed lighting; Storage; Walk-in closets; Electric fireplace (1)
- Laundry & utility: Washer hookup (inside, main level); Electric dryer hookup
Neighborhood map
What this means for you Summary
Snapshot
- This is a 3-bed/2.0-bath single-family listed at $233k.
Deal economics
- At list price, monthly cash flow is $-230 ($-3k/yr) — negative.
- To cash-flow at today's rent, offer at most $192k (17.4% below list).
- To meet the 1% rule (rent ≥ 1% of price), the offer needs to be $180k (23.0% below list).
- Recommended offer: $180k (23.0% below list) — sets the bar for 1% rule.
Location & tenants
- Location reads 80/100 on livability (#37 in TX, #1,749 nationally) — a professional / high-income tenant draw. Strengths: commute A+, cost of living A+, housing A+; Watch: employment C-, crime F.
- Frenship ISD (urban): math 47% / reading 54% proficiency, ranked #162 of 826 in TX (top 20%) — acceptable for families but not a draw, mixed tenant base, ~2y average lease.
- Zoned schools: Crestview El (math 77% / reading 80%, grade A, #48 of 4,322 statewide, top 1%, 583 students, 29% FRL); Heritage Middle (math 47% / reading 59%, grade C+, #281 of 1,662 statewide, top 18%, 766 students, 42% FRL); Frenship H S (math 44% / reading 65%, grade C-, #379 of 1,632 statewide, top 26%, 3,247 students, 46% FRL) — zoned schools at 39% FRL track the district average.
- Market conditions: Rents rising (+2.8%/yr); 712 active listings in the ZIP; 32 comparable units currently listed for rent nearby; rentals at typical pace (median 24d on market — plan ~3-4 weeks tenant-placement turnaround); 41% of comp listings sitting > 30 days — soft ceiling on asking rent; solid renter incomes; 2,219 units permitted in Lubbock County in 2024 (252 in 5+ unit buildings).
Forward outlook
- Local home prices are declining (-3.0%/yr); year-one equity from $2k of loan paydown is wiped out by about $7k of value loss. Plan a longer hold.
- Lubbock County population projected at +39% by 2050 — long-run rental-demand tailwind backs the buy-and-hold thesis.
Negotiation context
- Only 10 days on market — expect competitive offers; lowballing is unlikely to land.
- 3 sale attempts since 12y ago with the ask held roughly flat each time — persistent listings suggest the price (not the market) is what's stuck; bring a comps-based counter.
Risks & watch-outs
- Climate carrying-cost: extreme-heat days projected 7→19/yr by 2055 (HVAC capex compounding) — expect insurance premiums to compound above CPI over the hold.
Questions for the listing agent
- What do current leases actually rent for vs. the listed asking? Can we see a recent rent roll and the last 12 months of T-12 income?
- Is there a deadline driving the sale (1031 exchange, divorce, estate, relocation)? That informs how much negotiation room exists.
- Schools are D-rated, which usually means shorter tenancies and higher turnover. Who's the typical renter profile here, and what's been the actual vacancy rate?
- Crime grade is F in this area — have there been break-ins, vandalism, or insurance claims at this property in the last 3 years? What carrier currently insures it and at what premium?
- The area grade is low — what's the realistic commute time and amenity access for the typical tenant pool here? Any planned neighborhood developments (good or bad) we should know about?
- What's the average days-on-market for RENTAL listings here right now (not sales)? A rising rental-DOM trend means longer vacancies and softer asking-rent achievability than the comps imply.
- What's the recent tenant-quality profile in this submarket — average credit score on applications, eviction rate, late-payment / NSF rate, and stable-employment percentage? A property-management company in the area should have these aggregated.
- How much new for-sale + rental construction is in the pipeline within 1–3 miles? Heavy new supply typically softens prices + rents 12–24 months out; constrained supply supports both.
Investment metrics
- 1% rule
- 0.77% ✗
- Cap rate
- 5.11%
- Cash-on-cash
- -4.23%
- DSCR
- 0.81
- GRM
- 10.8
CMA / ARV
- ARV (median comp)
- $271,611
- List price
- $233,000
- Delta
- -14.22%
- Verdict
- UNDERPRICED
- Comps
- 1 within 2.0 mi
Projected returns pro-forma
-3.0% appreciation · 2.75% rent growth · sell at horizon
- IRR
- -23.7%
- Equity multiple
- 0.19×
- Total profit
- $-52,794
- Equity at exit
- $34,741
- IRR
- -19.3%
- Equity multiple
- -0.02×
- Total profit
- $-66,456
- Equity at exit
- $20,146
Cash invested: $65,240 (down + closing). Projections, not guarantees.
Landlord ↔ Tenant lean methodology
- Overall (STATE)
- 87 Strongly Landlord-Friendly
- State Texas
- 87 Strongly Landlord-Friendly · R+5
- County
- — inherits STATE
- City
- — inherits STATE
ZIP-level market 79424
- Rents YoY
- 2.8%
- Active inventory
- 712
- Price-to-rent
- 10.8×
Monthly cashflow live
- Estimated rent
- $1,795 high interval (Pro) →
- Mortgage (P&I)
- −$1,222
- Tax from tax record
- −$329 /mo · $3,947/yr
- Insurance
- −$97
- HOA
- −$0
- Lot rent
- −$0
- Vacancy / Maint / Mgmt
- −$377
- Net cashflow
- $-230
Break-even live
Sensitivity live
| Price | -10% $-98 | -5% $-164 | +0% $-230 | +5% $-296 | +10% $-362 |
|---|---|---|---|---|---|
| Rent | -10% $-372 | -5% $-301 | +0% $-230 | +5% $-159 | +10% $-88 |
| Rate | -1.0pp $-112 | -0.5pp $-171 | base $-230 | +0.5pp $-290 | +1.0pp $-352 |
UW: 25.0% down · 7.5% · 30yr · 1.5% tax · 5.0% vac · 8.0% maint · 8.0% mgmt
Financing live
Cash to close
- Down payment
- $58,250
- Closing costs
- $6,990
- Reserves months
- —
- Total cash needed
- —
Loan-product check · same deal, 3 products live
Conventional
25% down · 7.5% · 30yr
- Down + closing
- —
- Monthly P&I
- —
- Monthly cashflow
- —
- DSCR
- —
- Eligible?
- —
Personal DTI + credit; lowest rate.
DSCR
20% down · 8.5% · 30yr
- Down + closing
- —
- Monthly P&I
- —
- Monthly cashflow
- —
- DSCR
- —
- Eligible?
- —
No personal income docs; deal must DSCR.
Hard money
10% down · 12.0% · 12mo
- Down + closing
- —
- Monthly P&I
- —
- Monthly cashflow
- —
- DSCR
- —
- Eligible?
- —
Short-term bridge; refi at stabilization.
Rent comps 32 comps
| Address | Beds | Baths | Sqft | Rent | $/sqft | DOM | Units | Dist |
|---|---|---|---|---|---|---|---|---|
| 6553 89th St Lubbock, TX | 3.0 | 2.0 | 1564 | $1,575 | $1.01 | 23d | 1 | 0.27mi |
| 6550 85th St Lubbock, TX | 3.0 | 2.0 | 1711 | $1,700 | $0.99 | 23d | 1 | 0.31mi |
| 6717 89th St Lubbock, TX | 3.0 | 2.0 | 1991 | $1,725 | $0.87 | 23d | 1 | 0.40mi |
| 6906 90th St Lubbock, TX | 4.0 | 2.0 | 2044 | $2,695 | $1.32 | 16d | 1 | 0.56mi |
| 9104 Quincy Ave Lubbock, TX | 3.0 | 2.0 | 1562 | $1,750 | $1.12 | 23d | 1 | 0.58mi |
| 9106 Quincy Ave Lubbock, TX | 3.0 | 2.0 | 1593 | $1,750 | $1.10 | 16d | 1 | 0.58mi |
| 9616 Kline Ave Lubbock, TX | 3.0 | 2.0 | 2198 | $2,150 | $0.98 | 46d | 1 | 0.62mi |
| 9305 Quitman Ave Lubbock, TX | 3.0 | 2.0 | 1560 | $1,650 | $1.06 | 23d | 1 | 0.65mi |
| 9309 Quitman Ave Lubbock, TX | 3.0 | 2.0 | 1577 | $1,575 | $1.00 | 23d | 1 | 0.66mi |
| 9304 Remington Ave Lubbock, TX | 3.0 | 2.0 | 1649 | $1,850 | $1.12 | 46d | 1 | 0.72mi |
| 9806 Genoa Ave Lubbock, TX | 4.0 | 2.0 | 1763 | $2,050 | $1.16 | 46d | 1 | 1.01mi |
| 9706 Ross Ave Lubbock, TX | 3.0 | 2.0 | 1760 | $1,895 | $1.08 | 46d | 1 | 1.01mi |
| 9707 Saratoga Ave Unit A Lubbock, TX | 3.0 | 2.0 | 1350 | $1,499 | $1.11 | 23d | 1 | 1.02mi |
| 7051 96th St Unit A Lubbock, TX | 3.0 | 2.0 | 1500 | $1,450 | $0.97 | 16d | 1 | 1.04mi |
| 5731 90th St Lubbock, TX | 3.0 | 2.0 | 1504 | $1,650 | $1.10 | 23d | 1 | 1.04mi |
| 9710 Saratoga Ave Unit B Lubbock, TX | 3.0 | 2.0 | 1350 | $1,450 | $1.07 | 23d | 1 | 1.05mi |
| 9705 Trenton Ave Lubbock, TX | 3.0 | 2.0 | 1350 | $1,499 | $1.11 | 23d | 1 | 1.06mi |
| 6024 74th St Lubbock, TX | 4.0 | 2.0 | 1997 | $1,999 | $1.00 | 46d | 1 | 1.07mi |
| 9709 Trenton Ave Lubbock, TX | 3.0 | 2.0 | 1350 | $1,499 | $1.11 | 46d | 1 | 1.07mi |
| 9711 Trenton Ave Lubbock, TX | 3.0 | 2.0 | 1267 | $1,499 | $1.18 | 46d | 1 | 1.07mi |
| 9702 Trenton Ave Lubbock, TX | 3.0 | 2.0 | 1350 | $1,499 | $1.11 | 46d | 1 | 1.07mi |
| 9712 Trenton Ave Lubbock, TX | 3.0 | 2.0 | 1350 | $1,499 | $1.11 | 23d | 1 | 1.10mi |
| 9716 Trenton Ave Lubbock, TX | 3.0 | 2.0 | 1300 | $1,499 | $1.15 | 46d | 1 | 1.11mi |
| 5706 87th Pl Lubbock, TX | 3.0 | 2.0 | 1544 | $1,550 | $1.00 | 16d | 1 | 1.13mi |
| 5806 78th St Lubbock, TX | 3.0 | 2.0 | 1985 | $1,800 | $0.91 | 46d | 1 | 1.16mi |
| 10903 Norwich Ave Lubbock, TX | 3.0–4.0 | 2.0–3.0 | 1613 | $2,099 | $1.30 | 16d | 2 | 1.19mi |
| 6140 71st St Lubbock, TX | 3.0 | 2.5 | 1350 | $1,550 | $1.15 | 16d | 1 | 1.23mi |
| 5560 93rd St Lubbock, TX | 3.0 | 2.0 | 1370 | $1,395 | $1.02 | 23d | 1 | 1.31mi |
| 5703 80th St Lubbock, TX | 3.0 | 2.0 | 2133 | $2,295 | $1.08 | 46d | 1 | 1.31mi |
| 5545 93rd St Lubbock, TX | 3.0 | 2.0 | 1370 | $1,450 | $1.06 | 46d | 1 | 1.36mi |
| 5513 95th St Lubbock, TX | 3.0 | 2.0 | 1785 | $1,575 | $0.88 | 23d | 1 | 1.49mi |
| 7350 100th St Lubbock, TX | 3.0 | 2.0 | 1400 | $1,650 | $1.18 | 46d | 1 | 1.50mi |
Listing history 24 events
-
2026-06-22days on market $233,000 Active 10 DOM
-
2026-06-18days on market $233,000 Active 7 DOM
-
2026-06-17days on market $233,000 Active 6 DOM
-
2026-06-16days on market $233,000 Active 5 DOM
-
2026-06-15days on market $233,000 Active 4 DOM
-
2026-06-13days on market $233,000 Active 1 DOM
-
2026-06-10days on market $233,000 Active 34 DOM
-
2026-06-09days on market $233,000 Active 33 DOM
-
2026-06-08days on market $233,000 Active 32 DOM
-
2026-06-07days on market $233,000 Active 31 DOM
-
2026-06-05days on market $233,000 Active 28 DOM
-
2026-06-03days on market $233,000 Active 27 DOM
-
2026-06-02days on market $233,000 Active 26 DOM
-
2026-06-01days on market $233,000 Active 25 DOM
-
2026-05-31days on market $233,000 Active 24 DOM
-
2026-05-30days on market $233,000 Active 23 DOM
-
2026-05-06$233,000 Active 978-char remark
-
2018-11-16soldstatus
-
2018-11-15soldstatus 441-char remark
Show marketing remark (441 chars)
Incredible price on this Southwest Lubbock Home, featuring 3 Bedrooms, 2 Bathrooms and 2-Car Garage. You'll love the open floor plan, isolated master bedroom, covered patio, large corner lot and so much more! Minutes to Lubbock's most popular shopping, restaurants and entertainment. Frenship Schools and quick access to Brownfield Highway make the neighborhood highly sought after. Don't miss this property. Schedule your appointment today!
-
2018-08-13$155,950 441-char remark
Show marketing remark (441 chars)
Incredible price on this Southwest Lubbock Home, featuring 3 Bedrooms, 2 Bathrooms and 2-Car Garage. You'll love the open floor plan, isolated master bedroom, covered patio, large corner lot and so much more! Minutes to Lubbock's most popular shopping, restaurants and entertainment. Frenship Schools and quick access to Brownfield Highway make the neighborhood highly sought after. Don't miss this property. Schedule your appointment today!
-
2014-06-10soldstatus
-
2014-06-09soldstatus
Show marketing remark (467 chars)
One of Lubbock's most popular floor plans. Located among the fast growing Southwest section of the City. Beautiful entrance to open family room, corner fireplace. Nice kitchen with tiled back splash, wood stained cabinets, breakfast bar, large panty and white appliance package. Isolated master. Impressive master bath with garden tub, separate shower, dressing area with his and her closets! Sprinkler system, established lawn, RV parking all on a larger corner lot!
-
2014-04-22$132,500
Show marketing remark (467 chars)
One of Lubbock's most popular floor plans. Located among the fast growing Southwest section of the City. Beautiful entrance to open family room, corner fireplace. Nice kitchen with tiled back splash, wood stained cabinets, breakfast bar, large panty and white appliance package. Isolated master. Impressive master bath with garden tub, separate shower, dressing area with his and her closets! Sprinkler system, established lawn, RV parking all on a larger corner lot!
-
2005-12-12soldstatus
ⓘ Source: listings_history table (triggers on properties + properties_extension) + one-shot
backfill from property_details.listing_events for pre-trigger history.
Tax reassessment forecast TX · Resets to sale price
- Current annual tax
- $3,947 · $329/mo
- Projected year-2 tax
- $4,264 · $355/mo
- Expected delta
- +$316/yr (+$26/mo · 8.0%)
ⓘ Screening estimate from a state-policy table — verify with the county assessor before closing.
Climate risk First Street
- Flood 1/10 Low FEMA zone X (unshaded) · 0% chance over 30 yrs
- Wildfire 3/10 Moderate
- Heat 5/10 Major 7 d/yr ≥99°F today · 19 d/yr by 30 yrs out
- Wind 2/10 Low
- Air quality 2/10 Low 1 unhealthy d/yr today · 1 by 30 yrs out
Nearby sold comps map
Loading sold comps map…
Walkable amenities ~0.75 mi
Loading nearby amenities…
Taxation est. · year 1
- Rental income
- $21,540
- − Mortgage interest
- −$13,052
- − Property taxes
- −$3,947
- − Insurance
- −$1,165
- − Repairs & maintenance
- −$1,723
- − Management
- −$1,723
- − Depreciation
- −$6,778
- Taxable loss
- −$6,848
- Est. tax savings @ 24.0%
- +$1,644
- After-tax cash flow
- $-1,114/yr
For passive investors: Depreciation is non-cash, so a rental often shows a tax loss while cash-flowing — sheltering income. Rental losses are passive: they offset passive income freely, and up to $25,000/yr can offset ordinary (W-2) income if you actively participate and your MAGI is under $100k (phasing out to $0 by $150k); unused losses carry forward. On sale, claimed depreciation is recaptured at up to 25%, and gains may owe capital-gains tax (a 1031 exchange can defer both). Figures are a year-1 estimate at your 24.0% rate — not tax advice; consult a CPA.
Schools (NCES district)
- District
- Frenship ISD
- NCES district ID
- 4819830
- Math proficiency
- 47% ▼ -8.00%
- Reading proficiency
- 54% ▬ 0.00%
- Median HH income
- $54,376
- Composite
- 43.59/100
- National rank
- #2976
- State rank
- #162 of 826 in TX
Livability — Lubbock
- Score
- 80/100
- State rank
- #37
- US rank
- #1749
Category grades
Schools grade is shown separately in the Schools card above.
Census & demographics
- Census place
- Lubbock, TX
- County
- Lubbock County · 293,542 people
- City population
- 283,030
- Metro
- Lubbock, TX
- Population (ZIP)
- 53,478
- Household income
- $97,231
- Rent vs Own
- Severe rent burden
- 1958.0
Population outlook (Lubbock County) Hauer SSP2
- Today (2025)
- 345,960 people
- By 2030
- 371,449 · +7.4%
- By 2040
- 424,539 · +22.7%
- By 2050
- 481,150 · +39.1%
- By 2075
- 633,467 · +83.1%
- By 2100
- 746,853 · +115.9%
Race, ethnicity, and origin ACS 2023
- Neighborhood character
- Predominantly White (71%)
- Race & ethnicity
- White 71% Hispanic / Latino 21% Two or more races 12% Asian 3% Black 2%
- Hispanic origin (detail)
- Mexican 17%
- Common ancestry
- Slovak 2% Italian 2% Lithuanian 1%
- Foreign-born
- 6% · Canada, China
- Languages at home
- 88% English-only · Spanish 8% Chinese 1% Tagalog/Filipino 1%
Political lean MEDSL · Lubbock
- 2024 margin
- Solid R (+39.5) · D 29.7% · R 69.2% · Other 1.0%
- 2008→2024 swing
- -2.8pp toward R · 2008: -36.7pp · 2024: -39.5pp
- All cycles
- 2024: R+39.5 2020: R+32.2 2016: R+38.4 2012: R+40.9 2008: R+36.7
Not yet ingested
- Civics
- —
Market trends
- HPI YoY
- ▼ -146.64%
- Current HPI
- 213.2155
- Rent YoY
- ▲ 2.75%
- Metro
- Lubbock, TX
- State GDP YoY
- ▲ 3.95%
- F500 in state
- 110
Industry mix (Fortune 500 HQ in TX)
| Industry | F500 HQs | Revenue |
|---|---|---|
| Energy | 16 | $1,198B |
|
||
| Technology | 5 | $198B |
|
||
| Engineering / Construction | 4 | $72B |
|
||
| Energy Services | 3 | $60B |
|
||
| Utilities | 3 | $41B |
|
||
| Healthcare | 2 | $330B |
|
||
Price history
+75.8% since first listed8 events — show timeline
- 2026-06-11 Listed $233,000 LARMLS
- 2018-11-16 Sold (Public Records) — Public Records
- 2018-11-15 Sold (MLS) — LARMLS
- 2018-08-13 Listed $155,950 LARMLS
- 2014-06-10 Sold (Public Records) — Public Records
- 2014-06-09 Sold (MLS) — LARMLS
- 2014-04-22 Listed $132,500 LARMLS
- 2005-12-12 Sold (Public Records) — Public Records
Property tax history
+1.9%/yrLatest (2025): $3,947 · -0.3% YoY. Source: county tax records.
Cash-flow waterfall
monthlySold comps — $/sqft
last 12 mo · ≤1 miLoading sold comps…