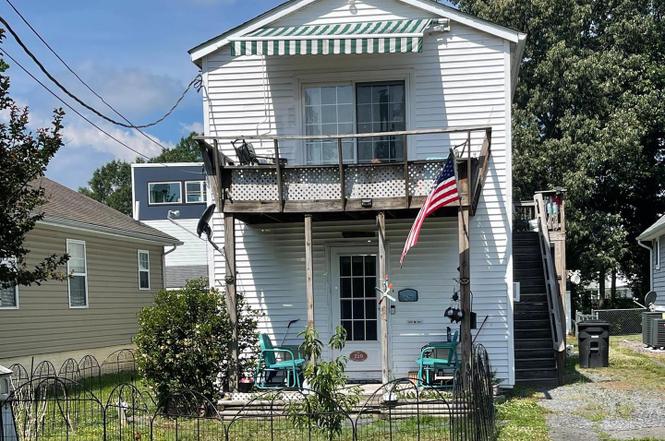
219 Lossing Ave · Colonial Beach, VA
Flood risk 5/10 · Moderate
- FEMA flood zone
- X (unshaded)
- Chance of flooding over 30 yrs
- 0.22%
- Est. flood insurance / yr
- $507 – $1,088
Fire risk 2/10 · Minimal
- Est. fire insurance / yr
- $666 – $1,236
Heat risk 8/10 · Major
- Hot days now (above 108°F)
- 7 days/yr
- Hot days in 30 yrs
- 16 days/yr
Wind risk 6/10 · Moderate
- Chance of severe wind over 30 yrs
- 27.0%
Air-quality risk 2/10 · Minimal
- Unhealthy air days now
- 2 days/yr
- Unhealthy air days in 30 yrs
- 2 days/yr
Risk factors via First Street. Map © Google.
Why this score? — see what drove the D+ grade
The composite is a weighted blend of 9 inputs, each scored 0–100. Each bar is that input's sub-score; the figure is the points it added to the 100-point composite (weight × sub-score).
- ARV discount +15.0/15.0
- Cash flow +13.4/30.0
- Schools +4.6/10.0
- DSCR +4.0/10.0
- Livability +3.0/5.0
- Rent growth +2.5/5.0
- Condition / age +2.5/5.0
- 1% rule +2.4/10.0
- Appreciation +0.0/10.0
$275,000
🖨 Deal sheet (PDF) 📄 Offer letter ✓ Due diligence
Listing remarks
CALLING ALL FIXER UPPERS! RARE OPPORTUNITY ON THE POINT. This home is being sold "As Is. " Each floor has been previously divided to be separate residences. The upper level has a separate entrance via the exterior stairs. Walk, ride your bike or drive your golf cart to town. Colonial Beach has shopping, restaurants, breweries, public beaches, pier and public boat launch. Come on down! Put your toes in the sand!
Key facts
- Separate entrance
- Separate residences
- 5,000 sq ft lot
Tags
Property features AI
Finance
- Other: Fee simple ownership
- Financial info:
- HOA & community:
Exterior
- Parking: Driveway
- Security:
- Utilities: Public water; Public sewer; Electric hot water
- Home design: Detached property; Estimated year built
- Construction: Combination construction; Slab foundation; Above-grade and below-grade structures
- Exterior features: No tidal water
Interior
- Kitchen:
- Bedrooms: Two bedrooms on the main level
- Flooring:
- Bathrooms: Two full bathrooms (both on the main level)
- Heating & cooling: Electric baseboard heating; Ceiling fans; Window air conditioning units (electric)
- Interior features: Partially furnished; Gas/propane fireplace (1)
- Laundry & utility: Washer and dryer in unit
Neighborhood map
What this means for you Summary
Snapshot
- This is a 2-bed/2.0-bath single-family listed at $275k.
Deal economics
- At list price, monthly cash flow is $6 ($75/yr) — positive.
- The deal already cash-flows at list — no discount required.
- To meet the 1% rule (rent ≥ 1% of price), the offer needs to be $205k (25.6% below list).
- Recommended offer: $205k (25.6% below list) — sets the bar for 1% rule.
- Cap rate 6.3% vs local median 4.5% in Colonial Beach — top-decile yield for the area; either an underpriced asset or a hidden risk that comps aren't pricing in. Stress-test before assuming the spread holds.
Location & tenants
- Location reads 59/100 on livability (#460 in VA) — a working-class tenant base; expect higher turnover. Strengths: crime B, cost of living B; Watch: amenities F, commute F, health & safety F.
- Colonial Beach Public School District (town): math 42% / reading 68% proficiency, ranked #82 of 131 in VA (top 63%) — acceptable for families but not a draw, mixed tenant base, ~2y average lease.
- Zoned schools: Colonial Beach Elementary (math 43% / reading 64%, grade C, #684 of 1,108 statewide, top 62%, 360 students, 80% FRL); Colonial Beach High (math 34% / reading 95%, grade B, #212 of 319 statewide, top 66%, 214 students, 85% FRL) — zoned schools average 82% FRL vs 52% district-wide (31 pts higher); higher-poverty schools than district average — tighter screening recommended.
- Market conditions: 195 active listings in the ZIP; 7 comparable units currently listed for rent nearby; rentals at typical pace (median 15d on market — plan ~3-4 weeks tenant-placement turnaround); 220 units permitted in Westmoreland County in 2024 (0 in 5+ unit buildings).
- This rent runs 38% of the median local income ($65k/yr) — at the standard rent-burdened threshold; future hikes will face affordability resistance.
Forward outlook
- Local home prices are declining (-3.0%/yr); year-one equity from $2k of loan paydown is wiped out by about $8k of value loss. Plan a longer hold.
- Westmoreland County population projected to shrink 7% by 2050 — rents likely to lag national; underwrite the cash flow, not the appreciation.
Negotiation context
- Only 6 days on market — expect competitive offers; lowballing is unlikely to land.
- 3 sale attempts since 11y ago with the ask held roughly flat each time — persistent listings suggest the price (not the market) is what's stuck; bring a comps-based counter.
- Current owner paid $60k; list at $275k implies a 358% gain — meaningful room to come down on a strong offer.
Risks & watch-outs
- Climate carrying-cost: moderate flood risk; major wind risk, 27% chance of damaging wind over 30y; extreme-heat days projected 7→16/yr by 2055 (HVAC capex compounding) — expect insurance premiums to compound above CPI over the hold.
Questions for the listing agent
- Built in 1977 — when were the roof, HVAC, electrical panel, plumbing, and water heater last replaced?
- Is there a deadline driving the sale (1031 exchange, divorce, estate, relocation)? That informs how much negotiation room exists.
- Schools are B-rated — typically a magnet for longer-tenancy family renters. What's the average tenant stay here, and is there a school-zone premium baked into asking?
- The area grade is low — what's the realistic commute time and amenity access for the typical tenant pool here? Any planned neighborhood developments (good or bad) we should know about?
- What's the average days-on-market for RENTAL listings here right now (not sales)? A rising rental-DOM trend means longer vacancies and softer asking-rent achievability than the comps imply.
- What's the recent tenant-quality profile in this submarket — average credit score on applications, eviction rate, late-payment / NSF rate, and stable-employment percentage? A property-management company in the area should have these aggregated.
- How much new for-sale + rental construction is in the pipeline within 1–3 miles? Heavy new supply typically softens prices + rents 12–24 months out; constrained supply supports both.
Investment metrics
- 1% rule
- 0.74% ✗
- Cap rate
- 6.32%
- Cash-on-cash
- 0.10%
- DSCR
- 1.00
- GRM
- 11.2
CMA / ARV
- ARV (on-the-fly)
- $438,944
- Comps found
- 12
Show comp detail 12 sales within ~0.75 mi
| Address | Dist | Beds/Ba | Sqft | Sold | Price | $/sf | Match |
|---|---|---|---|---|---|---|---|
| 24 Bancroft Ave | 0.16mi | 3/2.0 (+1) | 1,302 (-5%) | 11mo | $500,000 | $384 | 70 |
| 507 Marshall Ave | 0.17mi | 3/2.0 (+1) | 1,450 (+5%) | 11mo | $397,000 | $274 | 69 |
| 527 Monroe Bay Ave | 0.23mi | 3/2.0 (+1) | 1,424 (+4%) | 12mo | $472,500 | $332 | 68 |
| 1001 Bancroft Ave | 0.54mi | 2/2.0 | 1,335 (-3%) | 9mo | $445,000 | $333 | 62 |
| 308 Washington Ave | 0.41mi | 3/2.0 (+1) | 1,428 (+4%) | 12mo | $390,000 | $273 | 60 |
| 810 Lossing Ave | 0.45mi | 3/2.0 (+1) | 1,488 (+8%) | 10mo | $525,000 | $353 | 52 |
| 711 Jackson St | 0.72mi | 3/2.0 (+1) | 1,354 (-2%) | 8mo | $322,500 | $238 | 52 |
| 1208 Bancroft Ave | 0.71mi | 3/2.0 (+1) | 1,350 (-2%) | 9mo | $400,000 | $296 | 51 |
| 737 Irving Ave | 0.42mi | 2/1.0 | 1,248 (-9%) | 12mo | $525,000 | $421 | 50 |
| 1002 Marshall Ave | 0.53mi | 3/2.0 (+1) | 1,288 (-6%) | 14mo | $395,000 | $307 | 48 |
| 512 Livingstone St | 0.57mi | 3/2.5 (+1) | 1,496 (+9%) | 11mo | $435,000 | $291 | 43 |
| 1225 Lossing Ave | 0.75mi | 3/2.0 (+1) | 1,300 (-6%) | 16mo | $415,000 | $319 | 38 |
Match score weights: distance 35% · size 25% · config 20% · recency 20%. Top-matched comps best support the ARV.
Projected returns pro-forma
-3.0% appreciation · 3.0% rent growth · sell at horizon
- IRR
- -16.2%
- Equity multiple
- 0.42×
- Total profit
- $-44,309
- Equity at exit
- $41,003
- IRR
- -8.0%
- Equity multiple
- 0.50×
- Total profit
- $-38,667
- Equity at exit
- $23,777
Cash invested: $77,000 (down + closing). Projections, not guarantees.
Landlord ↔ Tenant lean methodology
- Overall (STATE)
- 55 Moderately Landlord-Leaning
- State Virginia
- 55 Moderately Landlord-Leaning · D+2
- County
- — inherits STATE
- City
- — inherits STATE
ZIP-level market 22443
- Active inventory
- 195
- Price-to-rent
- 11.2×
Monthly cashflow live
- Estimated rent
- $2,047 high interval (Pro) →
- Mortgage (P&I)
- −$1,442
- Tax from tax record
- −$54 /mo · $647/yr
- Insurance
- −$115
- HOA
- −$0
- Vacancy / Maint / Mgmt
- −$430
- Net cashflow
- $6
Break-even live
Sensitivity live
| Price | -10% $162 | -5% $84 | +0% $6 | +5% $-72 | +10% $-149 |
|---|---|---|---|---|---|
| Rent | -10% $-155 | -5% $-75 | +0% $6 | +5% $87 | +10% $168 |
| Rate | -1.0pp $145 | -0.5pp $76 | base $6 | +0.5pp $-65 | +1.0pp $-137 |
UW: 25.0% down · 7.5% · 30yr · 1.5% tax · 5.0% vac · 8.0% maint · 8.0% mgmt
Financing live
Cash to close
- Down payment
- $68,750
- Closing costs
- $8,250
- Reserves months
- —
- Total cash needed
- —
Loan-product check · same deal, 3 products live
Conventional
25% down · 7.5% · 30yr
- Down + closing
- —
- Monthly P&I
- —
- Monthly cashflow
- —
- DSCR
- —
- Eligible?
- —
Personal DTI + credit; lowest rate.
DSCR
20% down · 8.5% · 30yr
- Down + closing
- —
- Monthly P&I
- —
- Monthly cashflow
- —
- DSCR
- —
- Eligible?
- —
No personal income docs; deal must DSCR.
Hard money
10% down · 12.0% · 12mo
- Down + closing
- —
- Monthly P&I
- —
- Monthly cashflow
- —
- DSCR
- —
- Eligible?
- —
Short-term bridge; refi at stabilization.
Rent comps 7 comps
| Address | Beds | Baths | Sqft | Rent | $/sqft | DOM | Units | Dist |
|---|---|---|---|---|---|---|---|---|
| 1 Monroe Bay Ave Colonial Beach, VA | 3.0 | 2.0 | 1600 | $1,695 | $1.06 | 14d | 1 | 0.32mi |
| 125 Lynnhaven Ct Colonial Beach, VA | 2.0 | 1.5 | 1160 | $1,950 | $1.68 | 16d | 1 | 0.42mi |
| 520 Jackson St Colonial Beach, VA | 3.0 | 2.0 | 1200 | $2,900 | $2.42 | 13d | 1 | 0.68mi |
| 1204 Lossing Ave Colonial Beach, VA | 3.0 | 2.0 | 1655 | $2,100 | $1.27 | 4d | 1 | 0.69mi |
| 715 Washington Ave Colonial Beach, VA | 2.0 | 2.0 | 1100 | $2,200 | $2.00 | 14d | 1 | 0.72mi |
| 223 7th St Colonial Beach, VA | 3.0 | 2.5 | 1540 | $2,300 | $1.49 | 16d | 1 | 1.24mi |
| 588 Wakefield Dr Colonial Beach, VA | 3.0 | 2.0 | 1455 | $2,050 | $1.41 | 45d | 1 | 1.31mi |
Listing history 6 events
-
2026-06-22statusdays on market $275,000 Active Under Contract 6 DOM
-
2026-06-18days on market $275,000 Active 4 DOM
-
2026-06-17days on market $275,000 Active 3 DOM
-
2026-06-16days on market $275,000 Active 2 DOM
-
2026-06-15remarks 414-char remark
-
2026-06-15$275,000 Active 1 DOM
ⓘ Source: listings_history table (triggers on properties + properties_extension) + one-shot
backfill from property_details.listing_events for pre-trigger history.
Tax reassessment forecast VA · Resets to sale price
- Current annual tax
- $647 · $54/mo
- Projected year-2 tax
- $2,255 · $188/mo
- Expected delta
- +$1,608/yr (+$134/mo · 248.4%)
ⓘ Screening estimate from a state-policy table — verify with the county assessor before closing.
Climate risk First Street
- Flood 5/10 Major FEMA zone X (unshaded) · 22% chance over 30 yrs
- Wildfire 2/10 Low
- Heat 8/10 Severe 7 d/yr ≥108°F today · 16 d/yr by 30 yrs out
- Wind 6/10 Major 27% chance of damaging wind over 30 yrs
- Air quality 2/10 Low 2 unhealthy d/yr today · 2 by 30 yrs out
Nearby sold comps map
Loading sold comps map…
Walkable amenities ~0.75 mi
Loading nearby amenities…
Taxation est. · year 1
- Rental income
- $24,561
- − Mortgage interest
- −$15,404
- − Property taxes
- −$647
- − Insurance
- −$1,375
- − Repairs & maintenance
- −$1,965
- − Management
- −$1,965
- − Depreciation
- −$8,000
- Taxable loss
- −$4,795
- Est. tax savings @ 24.0%
- +$1,151
- After-tax cash flow
- $1,226/yr
For passive investors: Depreciation is non-cash, so a rental often shows a tax loss while cash-flowing — sheltering income. Rental losses are passive: they offset passive income freely, and up to $25,000/yr can offset ordinary (W-2) income if you actively participate and your MAGI is under $100k (phasing out to $0 by $150k); unused losses carry forward. On sale, claimed depreciation is recaptured at up to 25%, and gains may owe capital-gains tax (a 1031 exchange can defer both). Figures are a year-1 estimate at your 24.0% rate — not tax advice; consult a CPA.
Schools (NCES district)
- District
- Colonial Beach Public School District
- NCES district ID
- 5100930
- Math proficiency
- 42% ▼ -35.00%
- Reading proficiency
- 68% ▼ -4.00%
- Median HH income
- $45,397
- Composite
- 46.38/100
- National rank
- #2459
- State rank
- #82 of 131 in VA
Livability — Colonial Beach
- Score
- 59/100
- State rank
- #460
- US rank
- #19615
Category grades
Schools grade is shown separately in the Schools card above.
Census & demographics
- Census place
- Colonial Beach, VA
- County
- Westmoreland County · 10,011 people
- City population
- 10,011
- Metro
- nan
- Population (ZIP)
- 10,011
- Household income
- $64,810
- Rent vs Own
- Severe rent burden
- 126.0
Population outlook (Westmoreland County) Hauer SSP2
- Today (2025)
- 17,643 people
- By 2030
- 17,520 · -0.7%
- By 2040
- 17,041 · -3.4%
- By 2050
- 16,397 · -7.1%
- By 2075
- 15,012 · -14.9%
- By 2100
- 12,917 · -26.8%
Race, ethnicity, and origin ACS 2023
- Neighborhood character
- Predominantly White (71%)
- Race & ethnicity
- White 71% Black 15% Two or more races 7% Hispanic / Latino 6% Asian 2%
- Hispanic origin (detail)
- Mexican 5%
- Common ancestry
- Slovak 2% Italian 2% Scotch-Irish 1%
- Foreign-born
- 3% · Canada
- Languages at home
- 96% English-only · Spanish 3%
Political lean MEDSL · Westmoreland
- 2024 margin
- R (+14.3) · D 42.4% · R 56.7%
- 2008→2024 swing
- -24.5pp toward R · 2008: 10.2pp · 2024: -14.3pp
- All cycles
- 2024: R+14.3 2020: R+8.2 2016: R+7.3 2012: D+0.5 2008: D+10.2
Not yet ingested
- Civics
- —
Market trends
- HPI YoY
- ▼ -127.23%
- Current HPI
- 152.1518
- Rent YoY
- —
- Metro
- nan
- State GDP YoY
- ▲ 2.40%
- F500 in state
- 50
Industry mix (Fortune 500 HQ in VA)
| Industry | F500 HQs | Revenue |
|---|---|---|
| Aerospace / Defense | 4 | $236B |
|
||
| Technology / Defense | 3 | $32B |
|
||
| Financial Services | 2 | $176B |
|
||
| Utilities | 2 | $27B |
|
||
| Insurance | 2 | $25B |
|
||
| Technology | 2 | $15B |
|
||
Price history
+358.3% since first listed7 events — show timeline
- 2026-06-14 Listed $275,000 BRIGHT MLS
- 2015-10-11 Delisted — MRIS
- 2015-10-11 Listing Removed — BRIGHT MLS
- 2015-09-11 Price Changed — MRIS
- 2015-08-07 Listed — MRIS
- 2015-08-07 Listed $175,000 BRIGHT MLS
- 1998-05-21 Sold (Public Records) $60,000 Public Records
Property tax history
+5.2%/yrLatest (2025): $647 · +0.0% YoY. Source: county tax records.
Cash-flow waterfall
monthlySold comps — $/sqft
last 12 mo · ≤1 miLoading sold comps…