389 Hilltop Trl · New Fairview, TX
Flood risk 1/10 · Minimal
- FEMA flood zone
- X (unshaded)
- Chance of flooding over 30 yrs
- 0.0%
- Est. flood insurance / yr
- $507 – $1,088
Fire risk 7/10 · Major
- Est. fire insurance / yr
- $1,222 – $2,270
Heat risk 7/10 · Major
- Hot days now (above 109°F)
- 7 days/yr
- Hot days in 30 yrs
- 22 days/yr
Wind risk 6/10 · Moderate
- Chance of severe wind over 30 yrs
- 27.0%
Air-quality risk 2/10 · Minimal
- Unhealthy air days now
- 1 days/yr
- Unhealthy air days in 30 yrs
- 2 days/yr
Risk factors via First Street. Map © Google.
Why this score? — see what drove the C+ grade
The composite is a weighted blend of 9 inputs, each scored 0–100. Each bar is that input's sub-score; the figure is the points it added to the 100-point composite (weight × sub-score).
- Cash flow +15.6/30.0
- ARV discount +14.5/15.0
- Appreciation +10.0/10.0
- DSCR +4.8/10.0
- 1% rule +4.6/10.0
- Schools +3.6/10.0
- Livability +3.1/5.0
- Rent growth +2.5/5.0
- Condition / age +2.5/5.0
$210,000
🖨 Deal sheet 📄 Offer letter ✓ Due diligence
Listing remarks MLS
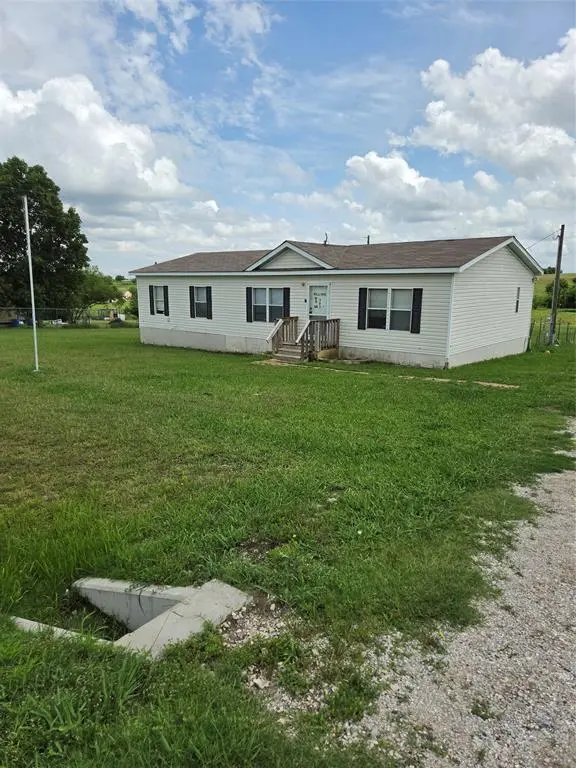
3 bedroom, 2 bath doublewide home on approx. 2 acres. Formal livling area at entry with dining and kitchen beyond divider wall. Family room or playroom by secondary bedrooms and full bath. Master suite has walk-in closet and oversized shower in bath. Kitchen has work island and plenty of cabinets. Buyer to verify schools and room sizes.
Key facts
- 2 acre lot
- Built 2007
- Listed 10 days
Property features AI
Finance
- Financial info: Listing terms: Cash or Conventional
- HOA & community: No association
Exterior
- Parking: No covered parking or carport; no designated parking features indicated
- Utilities: Aerobic septic; Co-op water; Not in a municipal utility district
- Home design: Manufactured home (residential); One level; Property attached
- Construction: Built in 2007; Composition roof
- Exterior features: 2.0-acre lot; Horse permitted; Directions: Use GPS — once on Hilltop property will be on the left; 2 flag poles in the yard
Interior
- Kitchen: Eat-in kitchen with breakfast bar and kitchen island; Electric range; Dishwasher
- Bedrooms: 3 bedrooms (all on main level); Primary bedroom on main level with ensuite bath and walk-in closet; One bedroom on main level with split-bedroom layout and walk-in closet; One bedroom on main level with walk-in closet
- Bathrooms: 2 full bathrooms
- Heating & cooling: Central air conditioning; Electric heating
- Interior features: Kitchen island; Walk-in closets; Two living areas; One dining area; 8 total rooms
- Laundry & utility: Separate utility room
Neighborhood map
What this means for you Summary
Snapshot
- This is a 3-bed/2.0-bath manufactured listed at $210k.
Deal economics
- At list price, monthly cash flow is $87 ($1k/yr) — positive.
- The deal already cash-flows at list — no discount required.
- To meet the 1% rule (rent ≥ 1% of price), the offer needs to be $201k (4.1% below list).
- Recommended offer: $201k (4.1% below list) — sets the bar for 1% rule.
- Cap rate 6.8% vs local median 2.5% in New Fairview — top-decile yield for the area; either an underpriced asset or a hidden risk that comps aren't pricing in. Stress-test before assuming the spread holds.
Location & tenants
- Location reads 62/100 on livability (#901 in TX) — a middle-class / working-renter tenant base. Strengths: employment A+, cost of living A+, housing A+; Watch: amenities F, commute F, health & safety F.
- Decatur ISD (town): math 40% / reading 42% proficiency, ranked #323 of 826 in TX (top 39%) — families likely to look elsewhere, expect single-tenant / working-renter base with shorter leases.
- Zoned schools: Carson El (math 37% / reading 38%, grade F, #1,744 of 4,322 statewide, top 41%, 548 students, 44% FRL) — zoned schools at 44% FRL track the district average.
- Market conditions: 262 active listings in the ZIP; solid renter incomes; 460 units permitted in Wise County in 2024 (243 in 5+ unit buildings).
Forward outlook
- In year one you build about $22k of equity ($1k loan paydown + $21k appreciation (10.0% local appreciation)).
- Wise County population projected at +27% by 2050 — long-run rental-demand tailwind backs the buy-and-hold thesis.
- At projected returns (10.0% appreciation + 3.0% rent growth), your $59k cash investment doubles in ~3 years — after that, you're playing with house money.
- By year 2, paydown + projected appreciation supports a ~$36k cash-out refi (75% LTV) — recoverable capital for the next deal without selling this one.
Negotiation context
- Only 10 days on market — expect competitive offers; lowballing is unlikely to land.
- 2 sale attempts since 17y ago with the ask held roughly flat each time — persistent listings suggest the price (not the market) is what's stuck; bring a comps-based counter.
Risks & watch-outs
- Climate carrying-cost: major wind risk, 27% chance of damaging wind over 30y; major wildfire risk; extreme-heat days projected 7→22/yr by 2055 (HVAC capex compounding) — expect insurance premiums to compound above CPI over the hold.
Questions for the listing agent
- Is there a deadline driving the sale (1031 exchange, divorce, estate, relocation)? That informs how much negotiation room exists.
- Schools are F-rated, which usually means shorter tenancies and higher turnover. Who's the typical renter profile here, and what's been the actual vacancy rate?
- What's the average days-on-market for RENTAL listings here right now (not sales)? A rising rental-DOM trend means longer vacancies and softer asking-rent achievability than the comps imply.
- What's the recent tenant-quality profile in this submarket — average credit score on applications, eviction rate, late-payment / NSF rate, and stable-employment percentage? A property-management company in the area should have these aggregated.
- How much new for-sale + rental construction is in the pipeline within 1–3 miles? Heavy new supply typically softens prices + rents 12–24 months out; constrained supply supports both.
Investment metrics
- 1% rule
- 0.96% ✗
- Cap rate
- 6.79%
- Cash-on-cash
- 1.78%
- DSCR
- 1.08
- GRM
- 8.7
CMA / ARV
- ARV (on-the-fly)
- $248,976
- Comps found
- 3
Show comp detail 3 sales within ~0.75 mi
| Address | Dist | Beds/Ba | Sqft | Sold | Price | $/sf | Match |
|---|---|---|---|---|---|---|---|
| 156 Aydelotte Ct | 0.67mi | 3/2.0 | 1,364 (-6%) | 7mo | $260,000 | $191 | 52 |
| 289 Wilson Ct | 0.71mi | 3/2.0 | 1,568 (+8%) | 23mo | $190,000 | $121 | 34 |
| 153 Aydelotte Ct | 0.69mi | 4/2.0 (+1) | 1,664 (+14%) | 14mo | $285,000 | $171 | 27 |
Match score weights: distance 35% · size 25% · config 20% · recency 20%. Top-matched comps best support the ARV.
Projected returns pro-forma
10.0% appreciation · 3.0% rent growth · sell at horizon
- IRR
- 25.6%
- Equity multiple
- 3.04×
- Total profit
- $119,993
- Equity at exit
- $189,185
- IRR
- 22.5%
- Equity multiple
- 6.94×
- Total profit
- $349,114
- Equity at exit
- $407,984
Cash invested: $58,800 (down + closing). Projections, not guarantees.
Landlord ↔ Tenant lean methodology
- Overall (STATE)
- 87 Strongly Landlord-Friendly
- State Texas
- 87 Strongly Landlord-Friendly · R+5
- County
- — inherits STATE
- City
- — inherits STATE
ZIP-level market 76078
- Home prices YoY
- 6.5%
- Active inventory
- 262
- Price-to-rent
- 8.7×
Monthly cashflow live
- Estimated rent
- $2,015 medium interval (Pro) →
- Mortgage (P&I)
- −$1,101
- Tax from tax record
- −$316 /mo · $3,789/yr
- Insurance
- −$88
- HOA
- −$0
- Vacancy / Maint / Mgmt
- −$423
- Net cashflow
- $87
Break-even live
UW: 25.0% down · 7.5% · 30yr · 1.5% tax · 5.0% vac · 8.0% maint · 8.0% mgmt
Financing live
Cash to close
- Down payment
- $52,500
- Closing costs
- $6,300
- Reserves months
- —
- Total cash needed
- —
Loan-product check · same deal, 3 products live
Conventional
25% down · 7.5% · 30yr
- Down + closing
- —
- Monthly P&I
- —
- Monthly cashflow
- —
- DSCR
- —
- Eligible?
- —
Personal DTI + credit; lowest rate.
DSCR
20% down · 8.5% · 30yr
- Down + closing
- —
- Monthly P&I
- —
- Monthly cashflow
- —
- DSCR
- —
- Eligible?
- —
No personal income docs; deal must DSCR.
Hard money
10% down · 12.0% · 12mo
- Down + closing
- —
- Monthly P&I
- —
- Monthly cashflow
- —
- DSCR
- —
- Eligible?
- —
Short-term bridge; refi at stabilization.
Listing history 8 events
-
2026-06-18days on market $210,000 Active 10 DOM
-
2026-06-17days on market $210,000 Active 9 DOM
-
2026-06-16days on market $210,000 Active 8 DOM
-
2026-06-15days on market $210,000 Active 7 DOM
-
2026-06-13days on market $210,000 Active 5 DOM
-
2026-06-13days on market $210,000 Active 4 DOM
-
2026-06-08remarks 699-char remark
-
2026-06-08$210,000 Active 1 DOM
ⓘ Source: listings_history table (triggers on properties + properties_extension) + one-shot
backfill from property_details.listing_events for pre-trigger history.
Tax reassessment forecast TX · Resets to sale price
- Current annual tax
- $3,789 · $316/mo
- Projected year-2 tax
- $3,843 · $320/mo
- Expected delta
- +$54/yr (+$5/mo · 1.4%)
ⓘ Screening estimate from a state-policy table — verify with the county assessor before closing.
Climate risk First Street
- Flood 1/10 Low FEMA zone X (unshaded) · 0% chance over 30 yrs
- Wildfire 7/10 Severe
- Heat 7/10 Severe 7 d/yr ≥109°F today · 22 d/yr by 30 yrs out
- Wind 6/10 Major 27% chance of damaging wind over 30 yrs
- Air quality 2/10 Low 1 unhealthy d/yr today · 2 by 30 yrs out
Nearby sold comps map
Loading sold comps map…
Walkable amenities ~0.75 mi
Loading nearby amenities…
Taxation est. · year 1
- Rental income
- $24,178
- − Mortgage interest
- −$11,763
- − Property taxes
- −$3,789
- − Insurance
- −$1,050
- − Repairs & maintenance
- −$1,934
- − Management
- −$1,934
- − Depreciation
- −$6,109
- Taxable loss
- −$2,401
- Est. tax savings @ 24.0%
- +$576
- After-tax cash flow
- $1,624/yr
For passive investors: Depreciation is non-cash, so a rental often shows a tax loss while cash-flowing — sheltering income. Rental losses are passive: they offset passive income freely, and up to $25,000/yr can offset ordinary (W-2) income if you actively participate and your MAGI is under $100k (phasing out to $0 by $150k); unused losses carry forward. On sale, claimed depreciation is recaptured at up to 25%, and gains may owe capital-gains tax (a 1031 exchange can defer both). Figures are a year-1 estimate at your 24.0% rate — not tax advice; consult a CPA.
Schools (NCES district)
- District
- Decatur ISD
- NCES district ID
- 4816500
- Math proficiency
- 40% ▼ -7.00%
- Reading proficiency
- 42% ▼ -5.00%
- Median HH income
- $60,504
- Composite
- 36.33/100
- National rank
- #4691
- State rank
- #323 of 826 in TX
Livability — New Fairview
- Score
- 62/100
- State rank
- #901
- US rank
- #16172
Category grades
Schools grade is shown separately in the Schools card above.
Census & demographics
- Census place
- New Fairview, TX
- County
- Wise County · 49,037 people
- Metro
- Dallas-Fort Worth-Arlington, TX
- Population (ZIP)
- 10,828
- Household income
- $99,866
- Rent vs Own
- Severe rent burden
- 10.0
Population outlook (Wise County) Hauer SSP2
- Today (2025)
- 71,620 people
- By 2030
- 75,858 · +5.9%
- By 2040
- 83,908 · +17.2%
- By 2050
- 90,717 · +26.7%
- By 2075
- 107,583 · +50.2%
- By 2100
- 114,996 · +60.6%
Race, ethnicity, and origin ACS 2023
- Neighborhood character
- Predominantly White (69%)
- Race & ethnicity
- White 69% Hispanic / Latino 24% Two or more races 11% Native American 4% Black 2%
- Hispanic origin (detail)
- Mexican 20% Puerto Rican 3%
- Common ancestry
- Slovak 2% Lithuanian 2% Italian 1%
- Foreign-born
- 6% · Canada
- Languages at home
- 85% English-only · Spanish 14% German/W. Germanic 1%
Political lean MEDSL · Wise
- 2024 margin
- Solid R (+70.0) · D 14.7% · R 84.7%
- 2008→2024 swing
- -14.3pp toward R · 2008: -55.7pp · 2024: -70.0pp
- All cycles
- 2024: R+70.0 2020: R+68.2 2016: R+69.9 2012: R+67.5 2008: R+55.7
Not yet ingested
- Civics
- —
Market trends
- HPI YoY
- ▲ 19.94%
- Current HPI
- 325.22
- Rent YoY
- —
- Metro
- Dallas-Fort Worth-Arlington, TX
- State GDP YoY
- ▲ 3.95%
- F500 in state
- 110
Industry mix (Fortune 500 HQ in TX)
| Industry | F500 HQs | Revenue |
|---|---|---|
| Energy | 16 | $1,198B |
|
||
| Technology | 5 | $198B |
|
||
| Engineering / Construction | 4 | $72B |
|
||
| Energy Services | 3 | $60B |
|
||
| Utilities | 3 | $41B |
|
||
| Healthcare | 2 | $330B |
|
||
Price history
+500.0% since first listed8 events — show timeline
- 2026-06-08 Listed $210,000 NTREIS
- 2010-01-20 Sold (MLS) — NTREIS
- 2009-12-29 Listing Removed — NTREIS
- 2009-12-06 Listed $35,000 NTREIS
- 2007-11-07 Sold (Public Records) — Public Records
- 2002-01-08 Sold (Public Records) — Public Records
- 2000-01-10 Sold (Public Records) — Public Records
- 1996-07-24 Sold (Public Records) — Public Records
Property tax history
+7.9%/yrLatest (2025): $3,789 · +17.5% YoY. Source: county tax records.
Cash-flow waterfall
monthlySold comps — $/sqft
last 12 mo · ≤1 miLoading sold comps…