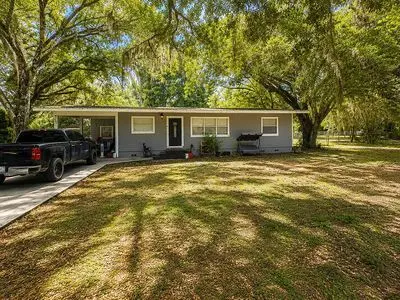
226 Clark St · LaBelle, FL
Flood risk 1/10 · Minimal
- FEMA flood zone
- X (unshaded)
- Chance of flooding over 30 yrs
- 0.0%
- Est. flood insurance / yr
- $507 – $1,088
Fire risk 3/10 · Minor
- Est. fire insurance / yr
- $947 – $1,759
Heat risk 9/10 · Severe
- Hot days now (above 108°F)
- 7 days/yr
- Hot days in 30 yrs
- 24 days/yr
Wind risk 10/10 · Severe
- Chance of severe wind over 30 yrs
- 99.0%
Air-quality risk 2/10 · Minimal
- Unhealthy air days now
- 2 days/yr
- Unhealthy air days in 30 yrs
- 2 days/yr
Risk factors via First Street. Map © Google.
Why this score? — see what drove the C- grade
The composite is a weighted blend of 9 inputs, each scored 0–100. Each bar is that input's sub-score; the figure is the points it added to the 100-point composite (weight × sub-score).
- ARV discount +15.0/15.0
- Appreciation +10.0/10.0
- Cash flow +8.5/30.0
- Livability +3.6/5.0
- Schools +3.1/10.0
- 1% rule +2.6/10.0
- Rent growth +2.5/5.0
- Condition / age +2.5/5.0
- DSCR +2.3/10.0
$255,000
🖨 Deal sheet (PDF) 📄 Offer letter ✓ Due diligence
Listing remarks MLS
Great location in a well established neighborhood in downtown LaBelle! Situated on a great half acre lot adorned with those beautiful LaBelle Oaks. .. This three bedroom one bath home offers a covered carport, newer shingle roof, updated windows, galley kitchen and enclosed laundry area. Adorned with the original hardwood tongue and groove walls, laminate flooring, central a/c, attached carport, storage area, central water and a large oak filled backyard. All this and just minutes to shopping, dining, schools and recreation. Make your appointment today!
Key facts
- Backyard gatherings
- Vintage charm
- Spacious lot
Tags
Neighborhood map
What this means for you Summary
Snapshot
- This is a 3-bed/1.0-bath single-family listed at $255k.
Deal economics
- At list price, monthly cash flow is $-223 ($-3k/yr) — negative.
- To cash-flow at today's rent, offer at most $216k (15.5% below list).
- To meet the 1% rule (rent ≥ 1% of price), the offer needs to be $194k (24.0% below list).
- Recommended offer: $194k (24.0% below list) — sets the bar for 1% rule.
Location & tenants
- Location reads 72/100 on livability (#324 in FL) — a middle-class / working-renter tenant base. Strengths: cost of living A+, housing A+, health & safety A+; Watch: commute F, employment F.
- Hendry (town): math 35% / reading 40% proficiency, ranked #65 of 73 in FL (top 89%) — families likely to look elsewhere, expect single-tenant / working-renter base with shorter leases; 75% free/reduced lunch — lower-income household profile, screen leases tightly.
- Zoned schools: Edward A. Upthegrove Elementary (math 43% / reading 42%, grade F, #1,383 of 2,144 statewide, top 65%, 541 students, 76% FRL); Labelle Middle School (math 37% / reading 38%, grade F, #395 of 571 statewide, top 70%, 817 students, 72% FRL); Labelle High School (math 42% / reading 41%, grade F, #284 of 667 statewide, top 43%, 1,451 students, 62% FRL).
- Market conditions: 950 active listings in the ZIP; 7 comparable units currently listed for rent nearby; rentals at typical pace (median 26d on market — plan ~3-4 weeks tenant-placement turnaround); 557 units permitted in Hendry County in 2024 (45 in 5+ unit buildings).
- This rent runs 41% of the median local income ($57k/yr) — at the standard rent-burdened threshold; future hikes will face affordability resistance.
Forward outlook
- In year one you build about $27k of equity ($2k loan paydown + $26k appreciation (10.0% local appreciation)).
- Hendry County population projected to shrink 7% by 2050 — rents likely to lag national; underwrite the cash flow, not the appreciation.
- By year 2, paydown + projected appreciation supports a ~$44k cash-out refi (75% LTV) — recoverable capital for the next deal without selling this one.
Negotiation context
- It's been on market 16 days — a 2% lower offer ($251k) is reasonable based on typical stale-listing flexibility.
- 4 sale attempts since 19y ago with the ask held roughly flat each time — persistent listings suggest the price (not the market) is what's stuck; bring a comps-based counter.
- Current owner paid $86k; list at $255k implies a 197% gain — meaningful room to come down on a strong offer.
Risks & watch-outs
- Climate carrying-cost: severe wind risk, 99% chance of damaging wind over 30y; extreme-heat days projected 7→24/yr by 2055 (HVAC capex compounding) — expect insurance premiums to compound above CPI over the hold.
Questions for the listing agent
- What do current leases actually rent for vs. the listed asking? Can we see a recent rent roll and the last 12 months of T-12 income?
- Is there a deadline driving the sale (1031 exchange, divorce, estate, relocation)? That informs how much negotiation room exists.
- What's the average days-on-market for RENTAL listings here right now (not sales)? A rising rental-DOM trend means longer vacancies and softer asking-rent achievability than the comps imply.
- What's the recent tenant-quality profile in this submarket — average credit score on applications, eviction rate, late-payment / NSF rate, and stable-employment percentage? A property-management company in the area should have these aggregated.
- How much new for-sale + rental construction is in the pipeline within 1–3 miles? Heavy new supply typically softens prices + rents 12–24 months out; constrained supply supports both.
Investment metrics
- 1% rule
- 0.76% ✗
- Cap rate
- 5.24%
- Cash-on-cash
- -3.75%
- DSCR
- 0.83
- GRM
- 11.0
CMA / ARV
- ARV (on-the-fly)
- $319,000
- Comps found
- 2
Show comp detail 2 sales within ~0.75 mi
| Address | Dist | Beds/Ba | Sqft | Sold | Price | $/sf | Match |
|---|---|---|---|---|---|---|---|
| 687 Fort Thompson Ave | 0.54mi | 2/2.0 (-1) | 1,208 (+10%) | 24mo | $350,000 | $290 | 30 |
| 172 Village Cir Unit Villa 7 | 0.70mi | 2/2.0 (-1) | 1,224 (+11%) | 16mo | $235,000 | $192 | 26 |
Match score weights: distance 35% · size 25% · config 20% · recency 20%. Top-matched comps best support the ARV.
Projected returns pro-forma
10.0% appreciation · 3.0% rent growth · sell at horizon
- IRR
- 21.6%
- Equity multiple
- 2.75×
- Total profit
- $124,674
- Equity at exit
- $229,724
- IRR
- 19.5%
- Equity multiple
- 6.30×
- Total profit
- $378,384
- Equity at exit
- $495,409
Cash invested: $71,400 (down + closing). Projections, not guarantees.
Landlord ↔ Tenant lean methodology
- Overall (STATE)
- 87 Strongly Landlord-Friendly
- State Florida
- 87 Strongly Landlord-Friendly · R+3
- County
- — inherits STATE
- City
- — inherits STATE
ZIP-level market 33935
- Home prices YoY
- 16.3%
- Active inventory
- 950
- Price-to-rent
- 11.0×
Monthly cashflow live
- Estimated rent
- $1,938 high interval (Pro) →
- Mortgage (P&I)
- −$1,337
- Tax from tax record
- −$311 /mo · $3,727/yr
- Insurance
- −$106
- HOA
- −$0
- Vacancy / Maint / Mgmt
- −$407
- Net cashflow
- $-223
Break-even live
Sensitivity live
| Price | -10% $-79 | -5% $-151 | +0% $-223 | +5% $-296 | +10% $-368 |
|---|---|---|---|---|---|
| Rent | -10% $-376 | -5% $-300 | +0% $-223 | +5% $-147 | +10% $-70 |
| Rate | -1.0pp $-95 | -0.5pp $-159 | base $-223 | +0.5pp $-289 | +1.0pp $-357 |
UW: 25.0% down · 7.5% · 30yr · 1.5% tax · 5.0% vac · 8.0% maint · 8.0% mgmt
Financing live
Cash to close
- Down payment
- $63,750
- Closing costs
- $7,650
- Reserves months
- —
- Total cash needed
- —
Loan-product check · same deal, 3 products live
Conventional
25% down · 7.5% · 30yr
- Down + closing
- —
- Monthly P&I
- —
- Monthly cashflow
- —
- DSCR
- —
- Eligible?
- —
Personal DTI + credit; lowest rate.
DSCR
20% down · 8.5% · 30yr
- Down + closing
- —
- Monthly P&I
- —
- Monthly cashflow
- —
- DSCR
- —
- Eligible?
- —
No personal income docs; deal must DSCR.
Hard money
10% down · 12.0% · 12mo
- Down + closing
- —
- Monthly P&I
- —
- Monthly cashflow
- —
- DSCR
- —
- Eligible?
- —
Short-term bridge; refi at stabilization.
Rent comps 7 comps
| Address | Beds | Baths | Sqft | Rent | $/sqft | DOM | Units | Dist |
|---|---|---|---|---|---|---|---|---|
| 174 Village Cir Labelle, FL | 2.0 | 2.0 | 1224 | $1,600 | $1.31 | 25d | 1 | 0.68mi |
| 184 Village Cir Labelle, FL | 2.0 | 2.0 | 1239 | $2,000 | $1.61 | 5d | 1 | 0.68mi |
| 176 E Yeomans Ave Labelle, FL | 3.0 | 2.0 | 1000 | $1,800 | $1.80 | 16d | 1 | 0.76mi |
| 198 Park Ave Unit 198 LaBelle, FL | 2.0 | 2.0 | 1000 | $1,200 | $1.20 | 25d | 1 | 0.91mi |
| 3020 N Lakewood Rd Labelle, FL | 4.0 | 2.0 | 1499 | $1,950 | $1.30 | 25d | 1 | 0.97mi |
| 343 3rd Ave Labelle, FL | 3.0 | 2.0 | 1050 | $1,400 | $1.33 | 25d | 1 | 1.22mi |
| 345 3rd Ave LaBelle, FL | 3.0 | 2.0 | 1050 | $1,400 | $1.33 | 25d | 1 | 1.22mi |
Listing history 11 events
-
2026-06-22days on market $255,000 Active 16 DOM
-
2026-06-18days on market $255,000 Active 13 DOM
-
2026-06-17days on market $255,000 Active 12 DOM
-
2026-06-16days on market $255,000 Active 11 DOM
-
2026-06-15days on market $255,000 Active 10 DOM
-
2026-06-13days on market $255,000 Active 7 DOM
-
2026-06-10days on market $255,000 Active 5 DOM
-
2026-06-09days on market $255,000 Active 4 DOM
-
2026-06-08days on market $255,000 Active 3 DOM
-
2026-06-07remarks 687-char remark
-
2026-06-07$255,000 Active 2 DOM
ⓘ Source: listings_history table (triggers on properties + properties_extension) + one-shot
backfill from property_details.listing_events for pre-trigger history.
Tax reassessment forecast FL · Resets to sale price
- Current annual tax
- $3,727 · $311/mo
- Projected year-2 tax
- $3,727 · $311/mo
- Expected delta
- $0/yr ($0/mo · 0.0%)
ⓘ Screening estimate from a state-policy table — verify with the county assessor before closing.
Climate risk First Street
- Flood 1/10 Low FEMA zone X (unshaded) · 0% chance over 30 yrs
- Wildfire 3/10 Moderate
- Heat 9/10 Extreme 7 d/yr ≥108°F today · 24 d/yr by 30 yrs out
- Wind 10/10 Extreme 99% chance of damaging wind over 30 yrs
- Air quality 2/10 Low 2 unhealthy d/yr today · 2 by 30 yrs out
Nearby sold comps map
Loading sold comps map…
Walkable amenities ~0.75 mi
Loading nearby amenities…
Taxation est. · year 1
- Rental income
- $23,251
- − Mortgage interest
- −$14,284
- − Property taxes
- −$3,727
- − Insurance
- −$1,275
- − Repairs & maintenance
- −$1,860
- − Management
- −$1,860
- − Depreciation
- −$7,418
- Taxable loss
- −$7,174
- Est. tax savings @ 24.0%
- +$1,722
- After-tax cash flow
- $-959/yr
For passive investors: Depreciation is non-cash, so a rental often shows a tax loss while cash-flowing — sheltering income. Rental losses are passive: they offset passive income freely, and up to $25,000/yr can offset ordinary (W-2) income if you actively participate and your MAGI is under $100k (phasing out to $0 by $150k); unused losses carry forward. On sale, claimed depreciation is recaptured at up to 25%, and gains may owe capital-gains tax (a 1031 exchange can defer both). Figures are a year-1 estimate at your 24.0% rate — not tax advice; consult a CPA.
Schools (NCES district)
- District
- Hendry
- NCES district ID
- 1200780
- Math proficiency
- 35% ▼ -11.00%
- Reading proficiency
- 40% ▼ -4.00%
- Median HH income
- $37,043
- Composite
- 31.16/100
- National rank
- #6054
- State rank
- #65 of 73 in FL
Livability — LaBelle
- Score
- 72/100
- State rank
- #324
- US rank
- #5736
Category grades
Schools grade is shown separately in the Schools card above.
Census & demographics
- Census place
- LaBelle, FL
- County
- Hendry County · 23,186 people
- City population
- 23,186
- Metro
- Clewiston, FL
- Population (ZIP)
- 23,186
- Household income
- $57,009
- Rent vs Own
- Severe rent burden
- 498.0
Population outlook (Hendry County) Hauer SSP2
- Today (2025)
- 38,866 people
- By 2030
- 38,558 · -0.8%
- By 2040
- 37,743 · -2.9%
- By 2050
- 36,117 · -7.1%
- By 2075
- 30,070 · -22.6%
- By 2100
- 21,966 · -43.5%
Race, ethnicity, and origin ACS 2023
- Neighborhood character
- Majority Hispanic (56%)
- Race & ethnicity
- Hispanic / Latino 56% White 39% Two or more races 21% Black 2% Native American 2%
- Hispanic origin (detail)
- Mexican 40% Puerto Rican 3% Cuban 5%
- Common ancestry
- Lithuanian 2% Serbian 2% Slovak 1%
- Foreign-born
- 27% · Canada, Jamaica
- Languages at home
- 50% English-only · Spanish 50%
Political lean MEDSL · Hendry
- 2024 margin
- Solid R (+38.3) · D 30.4% · R 68.7%
- 2008→2024 swing
- -31.1pp toward R · 2008: -7.2pp · 2024: -38.3pp
- All cycles
- 2024: R+38.3 2020: R+23.0 2016: R+14.2 2012: R+5.9 2008: R+7.2
Not yet ingested
- Civics
- —
Market trends
- HPI YoY
- ▲ 75.20%
- Current HPI
- 537.4928
- Rent YoY
- —
- Metro
- Clewiston, FL
- State GDP YoY
- ▲ 3.28%
- F500 in state
- 36
Industry mix (Fortune 500 HQ in FL)
| Industry | F500 HQs | Revenue |
|---|---|---|
| Industrial Technology | 2 | $29B |
|
||
| Insurance | 2 | $17B |
|
||
| Retail | 1 | $60B |
|
||
| Technology Distribution | 1 | $58B |
|
||
| Homebuilding | 1 | $35B |
|
||
| Technology Manufacturing | 1 | $35B |
|
||
Price history
+2328.6% since first listed13 events — show timeline
- 2026-06-05 Listed $255,000 FSBO.com
- 2018-11-26 Sold (MLS) $86,000 FORTMLS
- 2018-11-05 Pending — FORTMLS
- 2018-10-26 Relisted — FORTMLS
- 2018-10-22 Pending — FORTMLS
- 2018-10-10 Listed $95,000 FORTMLS
- 2008-01-31 Sold (Public Records) $150,000 Public Records
- 2008-01-30 Price Changed $159,900 FORTMLS
- 2008-01-29 Sold (MLS) $150,000 MARMLS
- 2008-01-29 Sold (MLS) $150,000 FORTMLS
- 2007-03-01 Listed $164,900 MARMLS
- 2003-08-27 Sold (Public Records) $23,100 Public Records
- 1966-01-01 Sold (Public Records) $10,500 Public Records
Property tax history
+8.7%/yrLatest (2025): $3,727 · +9.9% YoY. Source: county tax records.
Cash-flow waterfall
monthlySold comps — $/sqft
last 12 mo · ≤1 miLoading sold comps…