 12-Plex
* SE 5th Ave Unit * · Moultrie, GA
Flood risk No data
- FEMA flood zone
- —
- Chance of flooding over 30 yrs
- —
- Est. flood insurance / yr
- —
Fire risk No data
- Est. fire insurance / yr
- —
Heat risk No data
- Hot days now (above threshold)
- —
- Hot days in 30 yrs
- —
Wind risk No data
- Chance of severe wind over 30 yrs
- —
Air-quality risk No data
- Unhealthy air days now
- —
- Unhealthy air days in 30 yrs
- —
Risk factors via First Street. Map © Google.
Why this score? — see what drove the B- grade
The composite is a weighted blend of 9 inputs, each scored 0–100. Each bar is that input's sub-score; the figure is the points it added to the 100-point composite (weight × sub-score).
- Cash flow +30.0/30.0
- 1% rule +10.0/10.0
- DSCR +10.0/10.0
- ARV discount +7.5/15.0
- Condition / age +3.8/5.0
- Livability +3.0/5.0
- Rent growth +2.5/5.0
- Schools +2.2/10.0
- Appreciation +0.0/10.0
$995,000
🖨 Deal sheet (PDF) 📄 Offer letter ✓ Due diligence
Multi-family units
County records classify this as Multi-Family (2-4 Unit). Listing-text estimate: 12 units. estimate disagrees with records
Listing remarks MLS
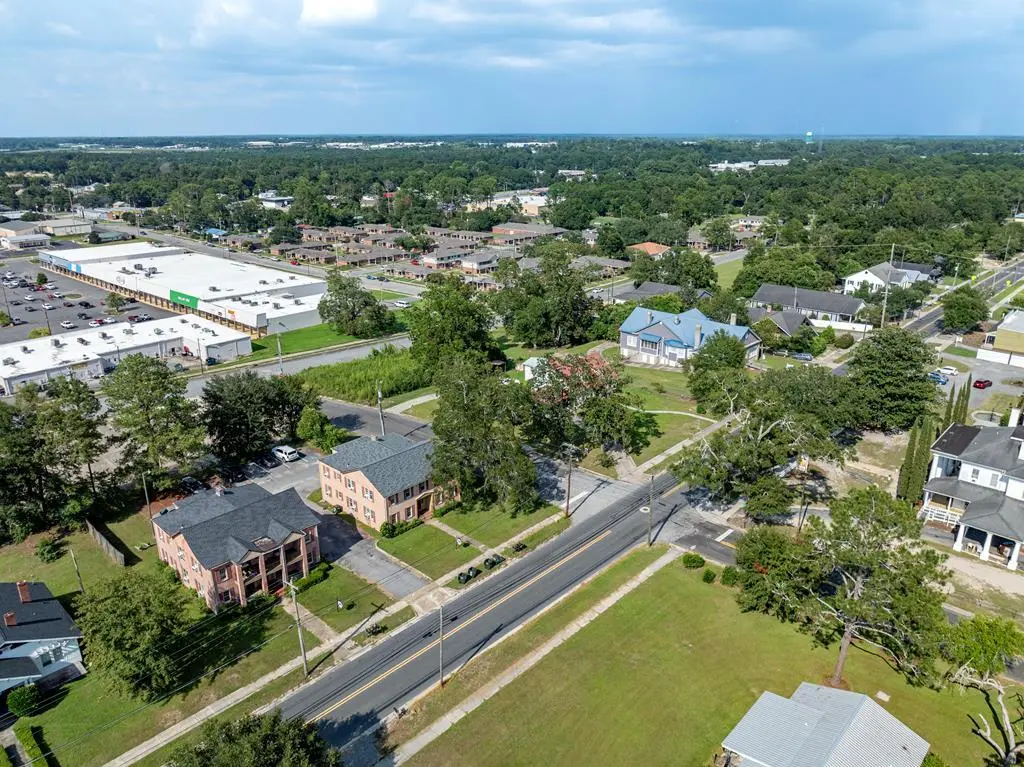
Positioned in the heart of Moultrie, this 12-unit multifamily portfolio offers a rare opportunity to acquire three quadplexes in a single, streamlined transaction, ideal for investors seeking immediate scale with clear upside potential. The portfolio includes 515, 521, and 713 5th Avenue SE, all under common ownership. Two properties are located side-by-side, with the third just blocks away, creating operational efficiency and ease of management. Each building consists of four spacious 2BR/1BA units ranging from approximately 950 to 1,050 square feet, constructed with durable brick and masonry exteriors and supported by ample off-street parking. The properties have demonstrated consistent rental demand, with current rents averaging approximately $900 per unit, generating roughly $10,800 per month in gross income across the portfolio. Market comparables support rents closer to $1,200 per unit, presenting a clear path to increase gross income to approximately $14,400 per month. This portfolio is well-positioned for a value-add investor looking to improve and reposition assets to capture rental upside. Through targeted interior and exterior updates and strategic branding, investors can unlock meaningful income growth across all 12 units. Individually metered units with direct tenant billing for utilities help reduce landlord expense exposure and simplify operations. Located just minutes from historic downtown Moultrie, the properties benefit from close proximity to shopping, dining, schools, major employers, and everyday conveniences. Colquitt County continues to experience steady growth supported by business-friendly leadership and regional connectivity, including access to I-75 and I-10 corridors, making the area attractive to a broad tenant base seeking affordability and convenience. Offered as a portfolio package at $1,035,000, this is an opportunity to secure multiple income-producing assets in one closing while benefiting from portfolio-level efficiency.
Key facts
- Access to i-75
- Three quadplexes
- 0.79 acre lot
Tags
Neighborhood map
What this means for you Summary
Snapshot
- This is a 12 × 2.0-bed/1.0-bath units multifamily listed at $995k. Condition is rated good.
Deal economics
- At list price, monthly cash flow is $6k ($74k/yr) — positive. Per door: $517/mo.
- The deal already cash-flows at list — no discount required.
- Meets the 1% rule at list price ($17k rent vs $995k).
- Recommended offer: $935k (6.0% below list) — sets the bar for market timing.
- Cap rate 13.8% vs local median 4.4% in Moultrie — top-decile yield for the area; either an underpriced asset or a hidden risk that comps aren't pricing in. Stress-test before assuming the spread holds.
Location & tenants
- Location reads 60/100 on livability (#374 in GA) — a middle-class / working-renter tenant base. Strengths: cost of living A+, housing A+; Watch: schools F, crime F, commute F.
- Colquitt County (town): math 29% / reading 25% proficiency, ranked #117 of 174 in GA (top 67%) — low school quality limits family demand, transient renter base, plan for 1-2y turnover; 67% free/reduced lunch — lower-income household profile, screen leases tightly.
- Market conditions: 139 active listings in the ZIP; 94 units permitted in Colquitt County in 2024 (0 in 5+ unit buildings).
Forward outlook
- Local home prices are declining (-3.0%/yr); year-one equity from $7k of loan paydown is wiped out by about $30k of value loss. Plan a longer hold.
- Colquitt County population projected to shrink 5% by 2050 — rents likely to lag national; underwrite the cash flow, not the appreciation.
- At projected returns (-3.0% appreciation + 3.0% rent growth), your $279k cash investment doubles in ~5 years — after that, you're playing with house money.
Negotiation context
- It's been on market 65 days — a 6% lower offer ($935k) is reasonable based on typical stale-listing flexibility.
Questions for the listing agent
- It's been on market 65 days. Have you received any prior offers? Is the seller open to a 6% concession, seller financing, or rate buy-down credit?
- Can we see the unit-by-unit rent roll, current vacancy, and any below-market leases? What's the average tenancy length?
- What capital expenditures (roof, boiler, parking lot, exteriors) have been made in the last 5 years, and what's planned in the next 2?
- Why hasn't it sold? Are there any deal-killer items the seller is aware of (foundation, flood, title, zoning, code violations)?
- Is there a deadline driving the sale (1031 exchange, divorce, estate, relocation)? That informs how much negotiation room exists.
- Schools are F-rated, which usually means shorter tenancies and higher turnover. Who's the typical renter profile here, and what's been the actual vacancy rate?
- Crime grade is F in this area — have there been break-ins, vandalism, or insurance claims at this property in the last 3 years? What carrier currently insures it and at what premium?
- What's the average days-on-market for RENTAL listings here right now (not sales)? A rising rental-DOM trend means longer vacancies and softer asking-rent achievability than the comps imply.
- What's the recent tenant-quality profile in this submarket — average credit score on applications, eviction rate, late-payment / NSF rate, and stable-employment percentage? A property-management company in the area should have these aggregated.
- How much new apartment / multifamily construction is in the pipeline within 1–3 miles? Heavy new supply (>2% of stock underway) typically softens rents 12–24 months out; light construction supports rent growth.
Investment metrics
- 1% rule
- 1.66% ✓
- Cap rate
- 13.77%
- Cash-on-cash
- 26.71%
- DSCR
- 2.19
- GRM
- 5.0
CMA / ARV
No comps found within radius.
Projected returns pro-forma
-3.0% appreciation · 3.0% rent growth · sell at horizon
- IRR
- 20.6%
- Equity multiple
- 1.84×
- Total profit
- $233,940
- Equity at exit
- $148,358
- IRR
- 28.8%
- Equity multiple
- 3.56×
- Total profit
- $713,251
- Equity at exit
- $86,029
Cash invested: $278,600 (down + closing). Projections, not guarantees.
Landlord ↔ Tenant lean methodology
- Overall (STATE)
- 90 Strongly Landlord-Friendly
- State Georgia
- 90 Strongly Landlord-Friendly · R+3
- County
- — inherits STATE
- City
- — inherits STATE
ZIP-level market 31768
- Home prices YoY
- -33.0%
- Active inventory
- 139
- Price-to-rent
- 60.1×
Monthly cashflow live
- Estimated rent
- $16,553 medium interval (Pro) →
- Mortgage (P&I)
- −$5,218
- Tax est. 1.5%
- −$1,244 /mo · $14,925/yr
- Insurance
- −$415
- HOA
- −$0
- Vacancy / Maint / Mgmt
- −$3,476
- Net cashflow
- $6,201
Break-even live
Sensitivity live
| Price | -10% $6,888 | -5% $6,544 | +0% $6,201 | +5% $5,857 | +10% $5,513 |
|---|---|---|---|---|---|
| Rent | -10% $4,893 | -5% $5,547 | +0% $6,201 | +5% $6,854 | +10% $7,508 |
| Rate | -1.0pp $6,702 | -0.5pp $6,454 | base $6,201 | +0.5pp $5,943 | +1.0pp $5,681 |
12-unit breakdown (identical units grouped — click to expand)
| Units | Beds | Baths | Est. rent |
|---|---|---|---|
| 12× units | 2.0 | 1 | $16,548 |
| #1 | 2.0 | 1 | $1,379 |
| #2 | 2.0 | 1 | $1,379 |
| #3 | 2.0 | 1 | $1,379 |
| #4 | 2.0 | 1 | $1,379 |
| #5 | 2.0 | 1 | $1,379 |
| #6 | 2.0 | 1 | $1,379 |
| #7 | 2.0 | 1 | $1,379 |
| #8 | 2.0 | 1 | $1,379 |
| #9 | 2.0 | 1 | $1,379 |
| #10 | 2.0 | 1 | $1,379 |
| #11 | 2.0 | 1 | $1,379 |
| #12 | 2.0 | 1 | $1,379 |
| Total (12 units) | $16,553 | ||
UW: 25.0% down · 7.5% · 30yr · 1.5% tax · 5.0% vac · 8.0% maint · 8.0% mgmt
Financing live
Cash to close
- Down payment
- $248,750
- Closing costs
- $29,850
- Reserves months
- —
- Total cash needed
- —
Loan-product check · same deal, 3 products live
Conventional
25% down · 7.5% · 30yr
- Down + closing
- —
- Monthly P&I
- —
- Monthly cashflow
- —
- DSCR
- —
- Eligible?
- —
Personal DTI + credit; lowest rate.
DSCR
20% down · 8.5% · 30yr
- Down + closing
- —
- Monthly P&I
- —
- Monthly cashflow
- —
- DSCR
- —
- Eligible?
- —
No personal income docs; deal must DSCR.
Hard money
10% down · 12.0% · 12mo
- Down + closing
- —
- Monthly P&I
- —
- Monthly cashflow
- —
- DSCR
- —
- Eligible?
- —
Short-term bridge; refi at stabilization.
Listing history 18 events
-
2026-06-21days on market $995,000 Active 65 DOM
-
2026-06-18days on market $995,000 Active 63 DOM
-
2026-06-17price $995,000 Active 62 DOM
-
2026-06-17days on market $1,035,000 Active 62 DOM
-
2026-06-16days on market $1,035,000 Active 61 DOM
-
2026-06-15days on market $1,035,000 Active 60 DOM
-
2026-06-13days on market $1,035,000 Active 58 DOM
-
2026-06-12days on market $1,035,000 Active 57 DOM
-
2026-06-09days on market $1,035,000 Active 54 DOM
-
2026-06-08days on market $1,035,000 Active 53 DOM
-
2026-06-07days on market $1,035,000 Active 52 DOM
-
2026-06-07days on market $1,035,000 Active 51 DOM
-
2026-06-04days on market $1,035,000 Active 48 DOM
-
2026-06-02days on market $1,035,000 Active 47 DOM
-
2026-06-01days on market $1,035,000 Active 46 DOM
-
2026-05-31days on market $1,035,000 Active 45 DOM
-
2026-05-31days on market $1,035,000 Active 44 DOM
-
2026-04-14$1,035,000 Active 1991-char remark
Show marketing remark (1991 chars)
Positioned in the heart of Moultrie, this 12-unit multifamily portfolio offers a rare opportunity to acquire three quadplexes in a single, streamlined transaction, ideal for investors seeking immediate scale with clear upside potential. The portfolio includes 515, 521, and 713 5th Avenue SE, all under common ownership. Two properties are located side-by-side, with the third just blocks away, creating operational efficiency and ease of management. Each building consists of four spacious 2BR/1BA units ranging from approximately 950 to 1,050 square feet, constructed with durable brick and masonry exteriors and supported by ample off-street parking. The properties have demonstrated consistent rental demand, with current rents averaging approximately $900 per unit, generating roughly $10,800 per month in gross income across the portfolio. Market comparables support rents closer to $1,200 per unit, presenting a clear path to increase gross income to approximately $14,400 per month. This portfolio is well-positioned for a value-add investor looking to improve and reposition assets to capture rental upside. Through targeted interior and exterior updates and strategic branding, investors can unlock meaningful income growth across all 12 units. Individually metered units with direct tenant billing for utilities help reduce landlord expense exposure and simplify operations. Located just minutes from historic downtown Moultrie, the properties benefit from close proximity to shopping, dining, schools, major employers, and everyday conveniences. Colquitt County continues to experience steady growth supported by business-friendly leadership and regional connectivity, including access to I-75 and I-10 corridors, making the area attractive to a broad tenant base seeking affordability and convenience. Offered as a portfolio package at $1,035,000, this is an opportunity to secure multiple income-producing assets in one closing while benefiting from portfolio-level efficiency.
ⓘ Source: listings_history table (triggers on properties + properties_extension) + one-shot
backfill from property_details.listing_events for pre-trigger history.
Nearby sold comps map
Loading sold comps map…
Walkable amenities ~0.75 mi
Loading nearby amenities…
Taxation est. · year 1
- Rental income
- $198,636
- − Mortgage interest
- −$55,735
- − Property taxes
- −$14,925
- − Insurance
- −$4,975
- − Repairs & maintenance
- −$15,891
- − Management
- −$15,891
- − Depreciation
- −$28,945
- Taxable income
- $62,273
- Est. tax owed @ 24.0%
- −$14,946
- After-tax cash flow
- $59,462/yr
For passive investors: Depreciation is non-cash, so a rental often shows a tax loss while cash-flowing — sheltering income. Rental losses are passive: they offset passive income freely, and up to $25,000/yr can offset ordinary (W-2) income if you actively participate and your MAGI is under $100k (phasing out to $0 by $150k); unused losses carry forward. On sale, claimed depreciation is recaptured at up to 25%, and gains may owe capital-gains tax (a 1031 exchange can defer both). Figures are a year-1 estimate at your 24.0% rate — not tax advice; consult a CPA.
Condition & rehab AI · 13 photos
This 12-unit multifamily property in Moultrie, GA, is in good condition with minimal repairs needed. Fresh paint and landscaping can significantly enhance its curb appeal and rental value.
Value-add opportunities
- Both Paint exterior — Fresh paint can enhance curb appeal and property value.
- Both Landscaping — Well-maintained landscaping can improve curb appeal and attract tenants.
- Both Interior paint — Fresh paint can improve the interior's appearance and attract tenants.
- Both HVAC maintenance — Regular HVAC maintenance ensures comfort and reduces energy costs.
Renovation cost estimate screening
Value-add ROI direction
- Both Paint exterior — Fresh paint can enhance curb appeal and property value. ↑
- Both Landscaping — Well-maintained landscaping can improve curb appeal and attract tenants. ↑
- Both Interior paint — Fresh paint can improve the interior's appearance and attract tenants. ↑
- Both HVAC maintenance — Regular HVAC maintenance ensures comfort and reduces energy costs. ↑
ⓘ Cost ranges are severity-bucket heuristics (US national rule-of-thumb). Get contractor quotes + a written scope before underwriting a rehab budget.
Schools (NCES district)
- District
- Colquitt County
- NCES district ID
- 1301380
- Math proficiency
- 29% ▼ -7.00%
- Reading proficiency
- 25% ▼ -5.00%
- Median HH income
- $32,950
- Composite
- 22.11/100
- National rank
- #8176
- State rank
- #117 of 174 in GA
Livability — Moultrie
- Score
- 60/100
- State rank
- #374
- US rank
- #18973
Category grades
Schools grade is shown separately in the Schools card above.
Census & demographics
- Census place
- Moultrie, GA
- Population (ZIP)
- 21,281
Population outlook (Colquitt County) Hauer SSP2
- Today (2025)
- 46,043 people
- By 2030
- 45,757 · -0.6%
- By 2040
- 44,929 · -2.4%
- By 2050
- 43,901 · -4.7%
- By 2075
- 40,831 · -11.3%
- By 2100
- 37,986 · -17.5%
Race, ethnicity, and origin ACS 2023
- Neighborhood character
- Diverse neighborhood (Simpson 0.61)
- Race & ethnicity
- White 51% Black 33% Hispanic / Latino 14% Two or more races 4% Native American 1%
- Hispanic origin (detail)
- Mexican 10% Puerto Rican 1% Cuban 2%
- Common ancestry
- Serbian 1% Italian 1% Lithuanian 1%
- Foreign-born
- 7% · Canada
- Languages at home
- 86% English-only · Spanish 13% German/W. Germanic 1%
Political lean MEDSL · Colquitt
- 2024 margin
- Solid R (+50.2) · D 24.8% · R 75.0%
- 2008→2024 swing
- -12.6pp toward R · 2008: -37.6pp · 2024: -50.2pp
- All cycles
- 2024: R+50.2 2020: R+47.2 2016: R+47.3 2012: R+39.6 2008: R+37.6
Not yet ingested
- Civics
- —
Market trends
- HPI YoY
- ▼ -93.21%
- Current HPI
- 188.988
- Rent YoY
- —
- Metro
- —
- State GDP YoY
- ▲ 2.66%
- F500 in state
- 28
Industry mix (Fortune 500 HQ in GA)
| Industry | F500 HQs | Revenue |
|---|---|---|
| Paper / Packaging | 2 | $29B |
|
||
| Retail | 1 | $160B |
|
||
| Transportation / Logistics | 1 | $91B |
|
||
| Airlines | 1 | $62B |
|
||
| Consumer Goods | 1 | $47B |
|
||
| Utilities | 1 | $25B |
|
||
Price history
1 event — show timeline
- 2026-04-14 Listed $1,035,000 SGMLS
Cash-flow waterfall
monthlySold comps — $/sqft
last 12 mo · ≤1 miLoading sold comps…