 🏷️ Likely Rental
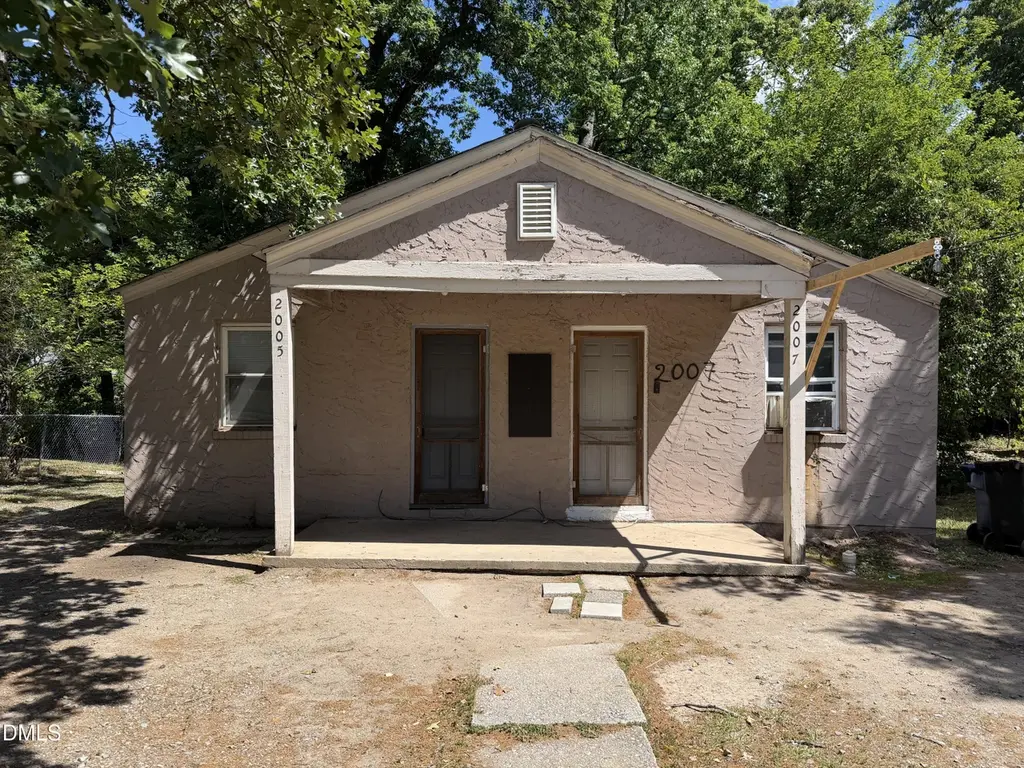
2005 Taylor St · Durham, NC
Flood risk 1/10 · Minimal
- FEMA flood zone
- X (unshaded)
- Chance of flooding over 30 yrs
- 0.0%
- Est. flood insurance / yr
- $507 – $1,088
Fire risk 1/10 · Minimal
- Est. fire insurance / yr
- $906 – $1,684
Heat risk 6/10 · Moderate
- Hot days now (above 106°F)
- 7 days/yr
- Hot days in 30 yrs
- 16 days/yr
Wind risk 6/10 · Moderate
- Chance of severe wind over 30 yrs
- 27.0%
Air-quality risk 2/10 · Minimal
- Unhealthy air days now
- 1 days/yr
- Unhealthy air days in 30 yrs
- 1 days/yr
Risk factors via First Street. Map © Google.
Why this score? — see what drove the B+ grade
The composite is a weighted blend of 9 inputs, each scored 0–100. Each bar is that input's sub-score; the figure is the points it added to the 100-point composite (weight × sub-score).
- Cash flow +30.0/30.0
- ARV discount +15.0/15.0
- DSCR +10.0/10.0
- 1% rule +9.7/10.0
- Livability +4.0/5.0
- Schools +3.0/10.0
- Rent growth +2.7/5.0
- Condition / age +2.5/5.0
- Appreciation +0.0/10.0
$175,000
🖨 Deal sheet (PDF) 📄 Offer letter ✓ Due diligence
Multi-family units
County records classify this as Multi-Family (2-4 Unit). Listing-text estimate: 2 units. confirmed
Listing remarks
This duplex presents an opportunity to acquire an entry-level multifamily investment in Durham at a basis well below recent duplex sales in the surrounding market. The property features 1-bedroom units o each side. One unit is occupied at $800/month providing in-place income and the second unit vacant and ready for renovation and lease-up. Investors can improve the vacant side while offsetting carrying costs through existing rental income, creating a clear path to increased cash flow and long-term value through stabilization of both units. Selling ''as is''
Key facts
- 8,276 sq ft lot
- 2 parking spots
- Built 1949
Property features AI
Finance
- Other: Annual tax reported
- Financial info: Multi-family property with 4 total units; Owner pays: See remarks
- HOA & community: No association
Exterior
- Parking: Driveway with 2 open parking spaces
- Utilities: Public water; Public sewer
- Home design: Duplex; One story
- Construction: Block foundation; Block and stucco construction; Shingle roof; Built as part of a 4-unit property
- Exterior features: Public-maintained road access; 0.19-acre lot
Interior
- Bedrooms: 2 bedrooms
- Flooring: Carpet; Vinyl
- Bathrooms: 2 full bathrooms
- Heating & cooling: Baseboard heating; Window unit cooling
- Interior features: Carpet and vinyl flooring
Neighborhood map
What this means for you Summary
Snapshot
- This is a 2 × 2-bed/1.0-bath units multifamily listed at $175k.
Deal economics
- At list price, monthly cash flow is $883 ($11k/yr) — positive. Per door: $442/mo.
- The deal already cash-flows at list — no discount required.
- Meets the 1% rule at list price ($3k rent vs $175k).
- Cap rate 12.3% vs local median 3.0% in Durham — top-decile yield for the area; either an underpriced asset or a hidden risk that comps aren't pricing in. Stress-test before assuming the spread holds.
Location & tenants
- Location reads 81/100 on livability (#15 in NC, #1,411 nationally) — a professional / high-income tenant draw. Strengths: amenities A+, commute A+, housing A+; Watch: schools D+, crime F.
- Durham Public Schools (urban): math 29% / reading 39% proficiency, ranked #132 of 178 in NC (top 74%) — families likely to look elsewhere, expect single-tenant / working-renter base with shorter leases.
- Market conditions: Rents flat; 1103 active listings in the ZIP; 40 comparable units currently listed for rent nearby; rentals at typical pace (median 23d on market — plan ~3-4 weeks tenant-placement turnaround); solid renter incomes; 2,905 units permitted in Durham County in 2024 (955 in 5+ unit buildings).
- This rent runs 35% of the median local income ($89k/yr) — at the standard rent-burdened threshold; future hikes will face affordability resistance.
Forward outlook
- Local home prices are declining (-3.0%/yr); year-one equity from $1k of loan paydown is wiped out by about $5k of value loss. Plan a longer hold.
- Durham County population projected at +44% by 2050 — long-run rental-demand tailwind backs the buy-and-hold thesis.
- At projected returns (-3.0% appreciation + 0.8% rent growth), your $49k cash investment doubles in ~7 years — after that, you're playing with house money.
Negotiation context
- Only 12 days on market — expect competitive offers; lowballing is unlikely to land.
- Current owner paid $47k; list at $175k implies a 272% gain — meaningful room to come down on a strong offer.
Risks & watch-outs
- Watch-outs: built in 1949 — expect roof / HVAC / electrical / plumbing capex.
- Climate carrying-cost: major wind risk, 27% chance of damaging wind over 30y; extreme-heat days projected 7→16/yr by 2055 (HVAC capex compounding) — expect insurance premiums to compound above CPI over the hold.
Questions for the listing agent
- Can we see the unit-by-unit rent roll, current vacancy, and any below-market leases? What's the average tenancy length?
- What capital expenditures (roof, boiler, parking lot, exteriors) have been made in the last 5 years, and what's planned in the next 2?
- Built in 1949 — when were the roof, HVAC, electrical panel, plumbing, and water heater last replaced?
- Is there a deadline driving the sale (1031 exchange, divorce, estate, relocation)? That informs how much negotiation room exists.
- Schools are D-rated, which usually means shorter tenancies and higher turnover. Who's the typical renter profile here, and what's been the actual vacancy rate?
- Crime grade is F in this area — have there been break-ins, vandalism, or insurance claims at this property in the last 3 years? What carrier currently insures it and at what premium?
- What's the average days-on-market for RENTAL listings here right now (not sales)? A rising rental-DOM trend means longer vacancies and softer asking-rent achievability than the comps imply.
- What's the recent tenant-quality profile in this submarket — average credit score on applications, eviction rate, late-payment / NSF rate, and stable-employment percentage? A property-management company in the area should have these aggregated.
- How much new apartment / multifamily construction is in the pipeline within 1–3 miles? Heavy new supply (>2% of stock underway) typically softens rents 12–24 months out; light construction supports rent growth.
Investment metrics
- 1% rule
- 1.47% ✓
- Cap rate
- 12.35%
- Cash-on-cash
- 21.63%
- DSCR
- 1.96
- GRM
- 5.7
CMA / ARV
- ARV (on-the-fly)
- $224,220
- Comps found
- 3
Show comp detail 3 sales within ~0.75 mi
| Address | Dist | Beds/Ba | Sqft | Sold | Price | $/sf | Match |
|---|---|---|---|---|---|---|---|
| 600 N Hyde Park Ave | 0.37mi | 2/2.0 | 1,140 (+3%) | 12mo | $205,000 | $180 | 60 |
| 1008 Alma St | 0.48mi | 2/2.0 | 1,134 (+2%) | 19mo | $245,000 | $216 | 50 |
| 705 N Driver St | 0.31mi | 2/2.0 | 1,236 (+11%) | 19mo | $250,000 | $202 | 43 |
Match score weights: distance 35% · size 25% · config 20% · recency 20%. Top-matched comps best support the ARV.
Projected returns pro-forma
-3.0% appreciation · 0.84% rent growth · sell at horizon
- IRR
- 11.8%
- Equity multiple
- 1.46×
- Total profit
- $22,418
- Equity at exit
- $26,093
- IRR
- 19.1%
- Equity multiple
- 2.44×
- Total profit
- $70,425
- Equity at exit
- $15,131
Cash invested: $49,000 (down + closing). Projections, not guarantees.
Landlord ↔ Tenant lean methodology
- Overall (STATE)
- 85 Strongly Landlord-Friendly
- State North Carolina
- 85 Strongly Landlord-Friendly · R+3
- County
- — inherits STATE
- City
- — inherits STATE
ZIP-level market 27703
- Rents YoY
- 0.8%
- Active inventory
- 1103
- Price-to-rent
- 11.3×
Monthly cashflow live
- Estimated rent
- $2,578 high interval (Pro) →
- Mortgage (P&I)
- −$918
- Tax from tax record
- −$163 /mo · $1,953/yr
- Insurance
- −$73
- HOA
- −$0
- Vacancy / Maint / Mgmt
- −$541
- Net cashflow
- $883
Break-even live
Sensitivity live
| Price | -10% $982 | -5% $933 | +0% $883 | +5% $834 | +10% $784 |
|---|---|---|---|---|---|
| Rent | -10% $680 | -5% $781 | +0% $883 | +5% $985 | +10% $1,087 |
| Rate | -1.0pp $971 | -0.5pp $928 | base $883 | +0.5pp $838 | +1.0pp $792 |
2-unit breakdown (identical units grouped — click to expand)
| Units | Beds | Baths | Est. rent |
|---|---|---|---|
| 2× units | 2 | 1 | $2,578 |
| #1 | 2 | 1 | $1,289 |
| #2 | 2 | 1 | $1,289 |
| Total (2 units) | $2,578 | ||
UW: 25.0% down · 7.5% · 30yr · 1.5% tax · 5.0% vac · 8.0% maint · 8.0% mgmt
Financing live
Cash to close
- Down payment
- $43,750
- Closing costs
- $5,250
- Reserves months
- —
- Total cash needed
- —
Loan-product check · same deal, 3 products live
Conventional
25% down · 7.5% · 30yr
- Down + closing
- —
- Monthly P&I
- —
- Monthly cashflow
- —
- DSCR
- —
- Eligible?
- —
Personal DTI + credit; lowest rate.
DSCR
20% down · 8.5% · 30yr
- Down + closing
- —
- Monthly P&I
- —
- Monthly cashflow
- —
- DSCR
- —
- Eligible?
- —
No personal income docs; deal must DSCR.
Hard money
10% down · 12.0% · 12mo
- Down + closing
- —
- Monthly P&I
- —
- Monthly cashflow
- —
- DSCR
- —
- Eligible?
- —
Short-term bridge; refi at stabilization.
Rent comps 40 comps
| Address | Beds | Baths | Sqft | Rent | $/sqft | DOM | Units | Dist |
|---|---|---|---|---|---|---|---|---|
| 406 N Hyde Park Ave Durham, NC | 3.0 | 1.0 | 1160 | $1,730 | $1.49 | 22d | 1 | 0.32mi |
| 1828 Liberty St Unit B Durham, NC | 2.0 | 1.0 | 1100 | $1,450 | $1.32 | 15d | 1 | 0.32mi |
| 1809 E Main St Durham, NC | 3.0 | 1.0 | 1200 | $1,700 | $1.42 | 15d | 1 | 0.36mi |
| 2408 Hart St Durham, NC | 3.0 | 1.0 | 960 | $1,445 | $1.51 | 24d | 1 | 0.37mi |
| 910 Fiske St Unit B Durham, NC | 2.0 | 1.0 | 750 | $1,025 | $1.37 | 24d | 1 | 0.45mi |
| 916 Fiske St Unit A Durham, NC | 2.0 | 1.0 | 800 | $1,050 | $1.31 | 24d | 1 | 0.46mi |
| 2113 Angier Ave Apt B Durham, NC | 2.0 | 1.0 | 925 | $1,300 | $1.41 | 24d | 1 | 0.50mi |
| 1609 Evergreen St Durham, NC | 2.0 | 1.0 | 1051 | $1,695 | $1.61 | 22d | 1 | 0.60mi |
| 2418 Owen St Unit A Durham, NC | 2.0 | 1.0 | 750 | $1,195 | $1.59 | 15d | 1 | 0.61mi |
| 1911 Fidelity Dr Durham, NC | 3.0 | 2.0 | 1209 | $1,815 | $1.50 | 24d | 1 | 0.63mi |
| 1104 Chester St Durham, NC | 1.0 | 1.0 | 1300 | $625 | $0.48 | 24d | 1 | 0.64mi |
| 603 N Elm St Unit A Durham, NC | 3.0 | 2.0 | 1200 | $1,495 | $1.25 | 24d | 1 | 0.68mi |
| 518 Boone St Unit 103 Durham, NC | 2.0 | 1.0 | 850 | $1,095 | $1.29 | 15d | 1 | 0.69mi |
| 721 Liberty St Unit C Durham, NC | 2.0 | 1.0 | 800 | $1,495 | $1.87 | 24d | 1 | 0.74mi |
| 2810 Ashe St Durham, NC | 3.0 | 2.0 | 1300 | $2,370 | $1.82 | 24d | 1 | 0.77mi |
| 807 E Main St Durham, NC | 1.0 | 1.0 | 1000 | $1,695 | $1.70 | 24d | 2 | 0.81mi |
| 1516 London Cir Durham, NC | 3.0 | 1.0 | 1118 | $1,650 | $1.48 | 24d | 1 | 0.89mi |
| 1136 Drew St Unit A Durham, NC | 3.0 | 2.5 | 1390 | $1,550 | $1.12 | 15d | 1 | 0.91mi |
| 704 Bacon St Durham, NC | 2.0 | 1.0 | 744 | $1,495 | $2.01 | 24d | 1 | 0.94mi |
| 518 N Hardee St Durham, NC | 1.0–2.0 | 1.0–1.5 | 665 | $1,299 | $1.95 | 24d | 1 | 0.95mi |
| 615 N Hardee St Durham, NC | 3.0 | 2.0 | 1250 | $1,690 | $1.35 | 15d | 1 | 0.97mi |
| 506 Gurley St Unit A Durham, NC | 2.0 | 1.0 | 775 | $1,300 | $1.68 | 15d | 1 | 1.04mi |
| 607 Dowd St Durham, NC | 2.0 | 1.0 | 720 | $1,550 | $2.15 | 24d | 1 | 1.05mi |
| 809 Lee St Durham, NC | 1.0 | 1.0 | 1370 | $580 | $0.42 | 15d | 1 | 1.05mi |
| 809A Lee St Durham, NC | 1.0 | 1.0 | 1370 | $714 | $0.52 | 24d | 1 | 1.05mi |
| 1600 N Alston Ave Unit C Durham, NC | 2.0 | 1.0 | 800 | $1,150 | $1.44 | 15d | 1 | 1.07mi |
| 500 E Main St Durham, NC | 3.0 | 1.0–2.0 | 1002 | $2,920 | $2.91 | 15d | 40 | 1.07mi |
| 701 Grant St Durham, NC | 3.0 | 2.0 | 1145 | $1,850 | $1.62 | 24d | 1 | 1.08mi |
| 1237 Naples Pl Durham, NC | 1.0–4.0 | 1.0–2.0 | 995 | $1,233 | $1.24 | 12d | 1 | 1.15mi |
| 1000 Linwood Ave Durham, NC | 3.0 | 2.0 | 1150 | $2,400 | $2.09 | 15d | 1 | 1.17mi |
| 510 E Pettigrew St Durham, NC | 3.0 | 1.0–2.0 | 996 | $2,510 | $2.52 | 15d | 29 | 1.21mi |
| 1101 S Alston Ave Durham, NC | 1.0 | 1.0 | 1433 | $935 | $0.65 | 22d | 1 | 1.24mi |
| 401 Sparella St Durham, NC | 3.0 | 2.0 | 1046 | $1,620 | $1.55 | 15d | 1 | 1.25mi |
| 1012 S Alston Ave Apt C Durham, NC | 2.0 | 1.0 | 750 | $1,150 | $1.53 | 24d | 1 | 1.26mi |
| 464 E Pettigrew St Durham, NC | 2.0 | 2.0 | 1091 | $2,786 | $2.55 | 15d | 1 | 1.26mi |
| 504 E Pettigrew St Durham, NC | 3.0 | 1.0–2.0 | 1092 | $2,255 | $2.07 | 22d | 30 | 1.27mi |
| 504 E Pettigrew St Durham, NC | 2.0 | 1.0–2.0 | 1025 | $2,219 | $2.16 | 15d | 35 | 1.27mi |
| 208 Gray Ave Apt 4H Durham, NC | 2.0 | 1.0 | 800 | $1,250 | $1.56 | 24d | 1 | 1.28mi |
| 514 E Umstead St Durham, NC | 3.0 | 2.0 | 1134 | $1,625 | $1.43 | 24d | 1 | 1.29mi |
| 441 S Dillard St Durham, NC | 1.0–3.0 | 1.0–2.5 | 1153 | $2,454 | $2.13 | 15d | 21 | 1.30mi |
Listing history 12 events
-
2026-06-10status $175,000 Pending 12 DOM
-
2026-06-09days on market $175,000 Active 12 DOM
-
2026-06-08days on market $175,000 Active 11 DOM
-
2026-06-07days on market $175,000 Active 10 DOM
-
2026-06-05days on market $175,000 Active 7 DOM
-
2026-06-03days on market $175,000 Active 6 DOM
-
2026-06-02days on market $175,000 Active 5 DOM
-
2026-06-01days on market $175,000 Active 4 DOM
-
2026-05-31days on market $175,000 Active 3 DOM
-
2026-05-30days on market $175,000 Active 2 DOM
-
2026-05-28$175,000 Active
-
1996-07-02soldstatus $47,000
ⓘ Source: listings_history table (triggers on properties + properties_extension) + one-shot
backfill from property_details.listing_events for pre-trigger history.
Tax reassessment forecast NC · Resets to sale price
- Current annual tax
- $1,953 · $163/mo
- Projected year-2 tax
- $1,953 · $163/mo
- Expected delta
- $0/yr ($0/mo · 0.0%)
ⓘ Screening estimate from a state-policy table — verify with the county assessor before closing.
Climate risk First Street
- Flood 1/10 Low FEMA zone X (unshaded) · 0% chance over 30 yrs
- Wildfire 1/10 Low
- Heat 6/10 Major 7 d/yr ≥106°F today · 16 d/yr by 30 yrs out
- Wind 6/10 Major 27% chance of damaging wind over 30 yrs
- Air quality 2/10 Low 1 unhealthy d/yr today · 1 by 30 yrs out
Nearby sold comps map
Loading sold comps map…
Walkable amenities ~0.75 mi
Loading nearby amenities…
Taxation est. · year 1
- Rental income
- $30,936
- − Mortgage interest
- −$9,803
- − Property taxes
- −$1,953
- − Insurance
- −$875
- − Repairs & maintenance
- −$2,475
- − Management
- −$2,475
- − Depreciation
- −$5,091
- Taxable income
- $8,265
- Est. tax owed @ 24.0%
- −$1,984
- After-tax cash flow
- $8,616/yr
For passive investors: Depreciation is non-cash, so a rental often shows a tax loss while cash-flowing — sheltering income. Rental losses are passive: they offset passive income freely, and up to $25,000/yr can offset ordinary (W-2) income if you actively participate and your MAGI is under $100k (phasing out to $0 by $150k); unused losses carry forward. On sale, claimed depreciation is recaptured at up to 25%, and gains may owe capital-gains tax (a 1031 exchange can defer both). Figures are a year-1 estimate at your 24.0% rate — not tax advice; consult a CPA.
Schools (NCES district)
- District
- Durham Public Schools
- NCES district ID
- 3701260
- Math proficiency
- 29% ▼ -3.00%
- Reading proficiency
- 39% ▲ 2.00%
- Median HH income
- $52,143
- Composite
- 29.69/100
- National rank
- #6457
- State rank
- #132 of 178 in NC
Livability — Durham
- Score
- 81/100
- State rank
- #15
- US rank
- #1411
Category grades
Schools grade is shown separately in the Schools card above.
Census & demographics
- Census place
- Durham, NC
- County
- Durham County · 288,747 people
- City population
- 288,747
- Metro
- Durham-Chapel Hill, NC
- Population (ZIP)
- 63,458
- Household income
- $89,317
- Rent vs Own
- Severe rent burden
- 1685.0
Population outlook (Durham County) Hauer SSP2
- Today (2025)
- 368,962 people
- By 2030
- 402,686 · +9.1%
- By 2040
- 468,677 · +27.0%
- By 2050
- 531,727 · +44.1%
- By 2075
- 660,446 · +79.0%
- By 2100
- 739,971 · +100.6%
Race, ethnicity, and origin ACS 2023
- Neighborhood character
- Diverse neighborhood (Simpson 0.70)
- Race & ethnicity
- Black 40% White 32% Hispanic / Latino 20% Two or more races 9% Asian 5%
- Hispanic origin (detail)
- Mexican 11% Puerto Rican 1%
- Common ancestry
- Swiss 2% Romanian 2% Italian 1%
- Foreign-born
- 15% · Canada, Vietnam, China
- Languages at home
- 77% English-only · Spanish 17% Other Asian/Pacific 1% Other Indo-European 1%
Political lean MEDSL · Durham
- 2024 margin
- Solid D (+61.9) · D 80.2% · R 18.2% · Other 1.6%
- 2008→2024 swing
- +10.0pp toward D · 2008: 51.9pp · 2024: 61.9pp
- All cycles
- 2024: D+61.9 2020: D+62.4 2016: D+60.4 2012: D+52.7 2008: D+51.9
Not yet ingested
- Civics
- —
Market trends
- HPI YoY
- ▼ -129.81%
- Current HPI
- 206.7413
- Rent YoY
- ▲ 0.84%
- Metro
- Durham-Chapel Hill, NC
- State GDP YoY
- ▲ 3.28%
- F500 in state
- 26
Industry mix (Fortune 500 HQ in NC)
| Industry | F500 HQs | Revenue |
|---|---|---|
| Financial Services | 2 | $213B |
|
||
| Retail | 2 | $95B |
|
||
| Industrial Conglomerate | 1 | $38B |
|
||
| Metals / Steel | 1 | $35B |
|
||
| Utilities | 1 | $30B |
|
||
| Industrial Machinery | 1 | $19B |
|
||
Price history
+272.3% since first listed2 events — show timeline
- 2026-05-28 Listed $175,000 TMLS
- 1996-07-02 Sold (Public Records) $47,000 Public Records
Property tax history
+9.5%/yrLatest (2025): $1,953 · +106.2% YoY. Source: county tax records.
Cash-flow waterfall
monthlySold comps — $/sqft
last 12 mo · ≤1 miLoading sold comps…