220 W 10th St · Ottawa, KS
Flood risk 1/10 · Minimal
- FEMA flood zone
- X (unshaded)
- Chance of flooding over 30 yrs
- 0.0%
- Est. flood insurance / yr
- $507 – $1,088
Fire risk 2/10 · Minimal
- Est. fire insurance / yr
- $1,154 – $2,142
Heat risk 4/10 · Minor
- Hot days now (above 108°F)
- 7 days/yr
- Hot days in 30 yrs
- 16 days/yr
Wind risk 2/10 · Minimal
- Chance of severe wind over 30 yrs
- —
Air-quality risk 2/10 · Minimal
- Unhealthy air days now
- 1 days/yr
- Unhealthy air days in 30 yrs
- 1 days/yr
Risk factors via First Street. Map © Google.
Why this score? — see what drove the B- grade
The composite is a weighted blend of 9 inputs, each scored 0–100. Each bar is that input's sub-score; the figure is the points it added to the 100-point composite (weight × sub-score).
- Cash flow +30.0/30.0
- DSCR +10.0/10.0
- 1% rule +8.8/10.0
- ARV discount +7.5/15.0
- Livability +3.6/5.0
- Rent growth +2.5/5.0
- Condition / age +2.5/5.0
- Schools +2.3/10.0
- Appreciation +0.0/10.0
$89,000
🖨 Deal sheet (PDF) 📄 Offer letter ✓ Due diligence
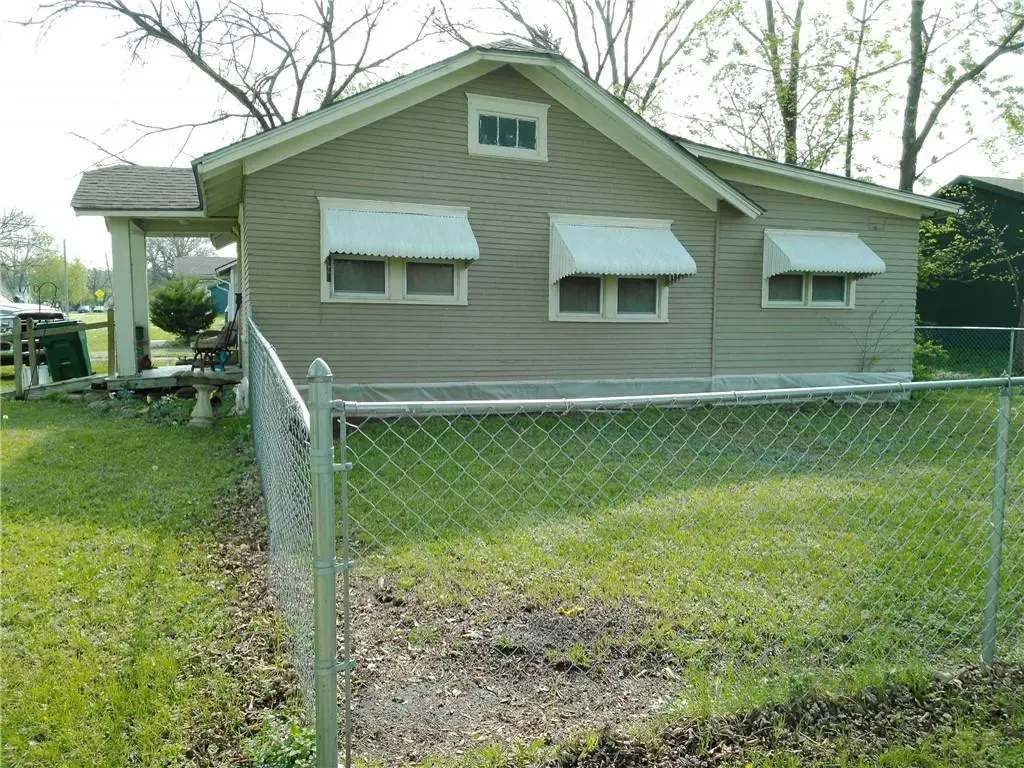
Listing remarks MLS
Cute little house just had a facelift. New windows, fresh paint, flooring, updated shower. New water lines. Updated 200 amp electrical panel. HVAC installed 2016. Roof 2011. Nice shady corner lot. So much cheaper to buy than to rent! Just 1 short block to walking trail. County shows home as a 2 bedroom. Current floor plan is non traditional. Back on the market after seller lost financing.
Key facts
- 5,625 sq ft lot
- Built 1920
- Listed 8 days
Neighborhood map
What this means for you Summary
Snapshot
- This is a 2-bed/1.0-bath single-family listed at $89k.
Deal economics
- At list price, monthly cash flow is $338 ($4k/yr) — positive.
- The deal already cash-flows at list — no discount required.
- Meets the 1% rule at list price ($1k rent vs $89k).
Location & tenants
- Location reads 72/100 on livability (#125 in KS) — a middle-class / working-renter tenant base. Strengths: cost of living A+, housing A+, health & safety A+; Watch: employment D+, amenities F, commute F.
- Ottawa (town): math 23% / reading 30% proficiency, ranked #128 of 169 in KS (top 76%) — low school quality limits family demand, transient renter base, plan for 1-2y turnover.
- Zoned schools: Ottawa Middle School (math 18% / reading 25%, grade F, #139 of 219 statewide, top 64%, 498 students, 56% FRL).
- Market conditions: 105 active listings in the ZIP; 1 comparable units currently listed for rent nearby; 85 units permitted in Franklin County in 2024 (0 in 5+ unit buildings).
Forward outlook
- Local home prices are declining (-3.0%/yr); year-one equity from $615 of loan paydown is wiped out by about $3k of value loss. Plan a longer hold.
- Franklin County population projected at -17% by 2050 — secular population decline; favor cash flow + early exit over multi-decade hold.
- At projected returns (-3.0% appreciation + 3.0% rent growth), your $25k cash investment doubles in ~8 years — after that, you're playing with house money.
Negotiation context
- Only 8 days on market — expect competitive offers; lowballing is unlikely to land.
- 3 sale attempts since 9y ago with the ask held roughly flat each time — persistent listings suggest the price (not the market) is what's stuck; bring a comps-based counter.
- Current owner paid $20k; list at $89k implies a 345% gain — meaningful room to come down on a strong offer.
Risks & watch-outs
- Watch-outs: built in 1920 — expect roof / HVAC / electrical / plumbing capex.
Questions for the listing agent
- Built in 1920 — when were the roof, HVAC, electrical panel, plumbing, and water heater last replaced?
- Is there a deadline driving the sale (1031 exchange, divorce, estate, relocation)? That informs how much negotiation room exists.
- Schools are F-rated, which usually means shorter tenancies and higher turnover. Who's the typical renter profile here, and what's been the actual vacancy rate?
- What's the average days-on-market for RENTAL listings here right now (not sales)? A rising rental-DOM trend means longer vacancies and softer asking-rent achievability than the comps imply.
- What's the recent tenant-quality profile in this submarket — average credit score on applications, eviction rate, late-payment / NSF rate, and stable-employment percentage? A property-management company in the area should have these aggregated.
- How much new for-sale + rental construction is in the pipeline within 1–3 miles? Heavy new supply typically softens prices + rents 12–24 months out; constrained supply supports both.
Investment metrics
- 1% rule
- 1.38% ✓
- Cap rate
- 10.85%
- Cash-on-cash
- 16.28%
- DSCR
- 1.72
- GRM
- 6.1
CMA / ARV
No comps found within radius.
Projected returns pro-forma
-3.0% appreciation · 3.0% rent growth · sell at horizon
- IRR
- 7.3%
- Equity multiple
- 1.29×
- Total profit
- $7,135
- Equity at exit
- $13,270
- IRR
- 16.6%
- Equity multiple
- 2.37×
- Total profit
- $34,047
- Equity at exit
- $7,695
Cash invested: $24,920 (down + closing). Projections, not guarantees.
Landlord ↔ Tenant lean methodology
- Overall (STATE)
- 83 Strongly Landlord-Friendly
- State Kansas
- 83 Strongly Landlord-Friendly · R+10
- County
- — inherits STATE
- City
- — inherits STATE
ZIP-level market 66067
- Home prices YoY
- -33.6%
- Active inventory
- 105
- Price-to-rent
- 6.1×
Monthly cashflow live
- Estimated rent
- $1,225 medium interval (Pro) →
- Mortgage (P&I)
- −$467
- Tax from tax record
- −$126 /mo · $1,511/yr
- Insurance
- −$37
- HOA
- −$0
- Vacancy / Maint / Mgmt
- −$257
- Net cashflow
- $338
Break-even live
Sensitivity live
| Price | -10% $388 | -5% $363 | +0% $338 | +5% $313 | +10% $288 |
|---|---|---|---|---|---|
| Rent | -10% $241 | -5% $290 | +0% $338 | +5% $386 | +10% $435 |
| Rate | -1.0pp $383 | -0.5pp $361 | base $338 | +0.5pp $315 | +1.0pp $292 |
UW: 25.0% down · 7.5% · 30yr · 1.5% tax · 5.0% vac · 8.0% maint · 8.0% mgmt
Financing live
Cash to close
- Down payment
- $22,250
- Closing costs
- $2,670
- Reserves months
- —
- Total cash needed
- —
Loan-product check · same deal, 3 products live
Conventional
25% down · 7.5% · 30yr
- Down + closing
- —
- Monthly P&I
- —
- Monthly cashflow
- —
- DSCR
- —
- Eligible?
- —
Personal DTI + credit; lowest rate.
DSCR
20% down · 8.5% · 30yr
- Down + closing
- —
- Monthly P&I
- —
- Monthly cashflow
- —
- DSCR
- —
- Eligible?
- —
No personal income docs; deal must DSCR.
Hard money
10% down · 12.0% · 12mo
- Down + closing
- —
- Monthly P&I
- —
- Monthly cashflow
- —
- DSCR
- —
- Eligible?
- —
Short-term bridge; refi at stabilization.
Rent comps 1 comps
| Address | Beds | Baths | Sqft | Rent | $/sqft | DOM | Units | Dist |
|---|---|---|---|---|---|---|---|---|
| 4 Canterbury Ct Ottawa, KS | 1.0–4.0 | 1.0–1.5 | 929 | $1,225 | $1.32 | 25d | 4 | 0.49mi |
Listing history 8 events
-
2026-04-28status Pending
-
2026-04-20$89,000 Active
-
2017-08-31soldstatus Sold 394-char remark
Show marketing remark (394 chars)
Cute little house just had a facelift. New windows, fresh paint, flooring, updated shower. New water lines. Updated 200 amp electrical panel. HVAC installed 2016. Roof 2011. Nice shady corner lot. So much cheaper to buy than to rent! Just 1 short block to walking trail. County shows home as a 2 bedroom. Current floor plan is non traditional. Back on the market after seller lost financing.
-
2017-07-15historical Contingent - Accepting Backup Offers 394-char remark
Show marketing remark (394 chars)
Cute little house just had a facelift. New windows, fresh paint, flooring, updated shower. New water lines. Updated 200 amp electrical panel. HVAC installed 2016. Roof 2011. Nice shady corner lot. So much cheaper to buy than to rent! Just 1 short block to walking trail. County shows home as a 2 bedroom. Current floor plan is non traditional. Back on the market after seller lost financing.
-
2017-07-12status Active 394-char remark
Show marketing remark (394 chars)
Cute little house just had a facelift. New windows, fresh paint, flooring, updated shower. New water lines. Updated 200 amp electrical panel. HVAC installed 2016. Roof 2011. Nice shady corner lot. So much cheaper to buy than to rent! Just 1 short block to walking trail. County shows home as a 2 bedroom. Current floor plan is non traditional. Back on the market after seller lost financing.
-
2017-07-08historical Contingent - Accepting Backup Offers 394-char remark
Show marketing remark (394 chars)
Cute little house just had a facelift. New windows, fresh paint, flooring, updated shower. New water lines. Updated 200 amp electrical panel. HVAC installed 2016. Roof 2011. Nice shady corner lot. So much cheaper to buy than to rent! Just 1 short block to walking trail. County shows home as a 2 bedroom. Current floor plan is non traditional. Back on the market after seller lost financing.
-
2017-06-29$59,000 Active 394-char remark
Show marketing remark (394 chars)
Cute little house just had a facelift. New windows, fresh paint, flooring, updated shower. New water lines. Updated 200 amp electrical panel. HVAC installed 2016. Roof 2011. Nice shady corner lot. So much cheaper to buy than to rent! Just 1 short block to walking trail. County shows home as a 2 bedroom. Current floor plan is non traditional. Back on the market after seller lost financing.
-
1995-09-01soldstatus $20,000
ⓘ Source: listings_history table (triggers on properties + properties_extension) + one-shot
backfill from property_details.listing_events for pre-trigger history.
Tax reassessment forecast KS · Resets to sale price
- Current annual tax
- $1,511 · $126/mo
- Projected year-2 tax
- $1,511 · $126/mo
- Expected delta
- $0/yr ($0/mo · 0.0%)
ⓘ Screening estimate from a state-policy table — verify with the county assessor before closing.
Climate risk First Street
- Flood 1/10 Low FEMA zone X (unshaded) · 0% chance over 30 yrs
- Wildfire 2/10 Low
- Heat 4/10 Moderate 7 d/yr ≥108°F today · 16 d/yr by 30 yrs out
- Wind 2/10 Low
- Air quality 2/10 Low 1 unhealthy d/yr today · 1 by 30 yrs out
Nearby sold comps map
Loading sold comps map…
Walkable amenities ~0.75 mi
Loading nearby amenities…
Taxation est. · year 1
- Rental income
- $14,700
- − Mortgage interest
- −$4,985
- − Property taxes
- −$1,511
- − Insurance
- −$445
- − Repairs & maintenance
- −$1,176
- − Management
- −$1,176
- − Depreciation
- −$2,589
- Taxable income
- $2,818
- Est. tax owed @ 24.0%
- −$676
- After-tax cash flow
- $3,380/yr
For passive investors: Depreciation is non-cash, so a rental often shows a tax loss while cash-flowing — sheltering income. Rental losses are passive: they offset passive income freely, and up to $25,000/yr can offset ordinary (W-2) income if you actively participate and your MAGI is under $100k (phasing out to $0 by $150k); unused losses carry forward. On sale, claimed depreciation is recaptured at up to 25%, and gains may owe capital-gains tax (a 1031 exchange can defer both). Figures are a year-1 estimate at your 24.0% rate — not tax advice; consult a CPA.
Schools (NCES district)
- District
- Ottawa
- NCES district ID
- 2000015
- Math proficiency
- 23% ▲ 2.00%
- Reading proficiency
- 30% ▲ 3.00%
- Median HH income
- $46,080
- Composite
- 22.9/100
- National rank
- #8003
- State rank
- #128 of 169 in KS
Livability — Ottawa
- Score
- 72/100
- State rank
- #125
- US rank
- #6479
Category grades
Schools grade is shown separately in the Schools card above.
Census & demographics
- Census place
- Ottawa, KS
- City population
- 16,146
- Population (ZIP)
- 16,146
Population outlook (Franklin County) Hauer SSP2
- Today (2025)
- 24,777 people
- By 2030
- 24,116 · -2.7%
- By 2040
- 22,426 · -9.5%
- By 2050
- 20,555 · -17.0%
- By 2075
- 17,149 · -30.8%
- By 2100
- 14,526 · -41.4%
Race, ethnicity, and origin ACS 2023
- Neighborhood character
- Predominantly White (89%)
- Race & ethnicity
- White 89% Two or more races 6% Hispanic / Latino 4%
- Common ancestry
- Lithuanian 2% Italian 2% Slovak 1%
- Foreign-born
- 2% · Canada
- Languages at home
- 97% English-only · Spanish 2%
Political lean MEDSL · Franklin
- 2024 margin
- Solid R (+40.1) · D 28.9% · R 69.0% · Other 2.0%
- 2008→2024 swing
- -17.6pp toward R · 2008: -22.5pp · 2024: -40.1pp
- All cycles
- 2024: R+40.1 2020: R+38.4 2016: R+39.4 2012: R+30.4 2008: R+22.5
Not yet ingested
- Civics
- —
Market trends
- HPI YoY
- ▼ -156.97%
- Current HPI
- 309.5576
- Rent YoY
- —
- Metro
- —
- State GDP YoY
- —
- F500 in state
- 0
Price history
+345.0% since first listed8 events — show timeline
- 2026-04-28 Pending — Heartland MLS as Distributed by MLS Grid
- 2026-04-20 Listed $89,000 Heartland MLS as Distributed by MLS Grid
- 2017-08-31 Sold (MLS) — Heartland MLS as Distributed by MLS Grid
- 2017-07-15 Contingent — Heartland MLS as Distributed by MLS Grid
- 2017-07-12 Relisted — Heartland MLS as Distributed by MLS Grid
- 2017-07-08 Contingent — Heartland MLS as Distributed by MLS Grid
- 2017-06-29 Listed $59,000 Heartland MLS as Distributed by MLS Grid
- 1995-09-01 Sold (Public Records) $20,000 Public Records
Property tax history
+8.1%/yrLatest (2025): $1,511 · +7.7% YoY. Source: county tax records.
Cash-flow waterfall
monthlySold comps — $/sqft
last 12 mo · ≤1 miLoading sold comps…