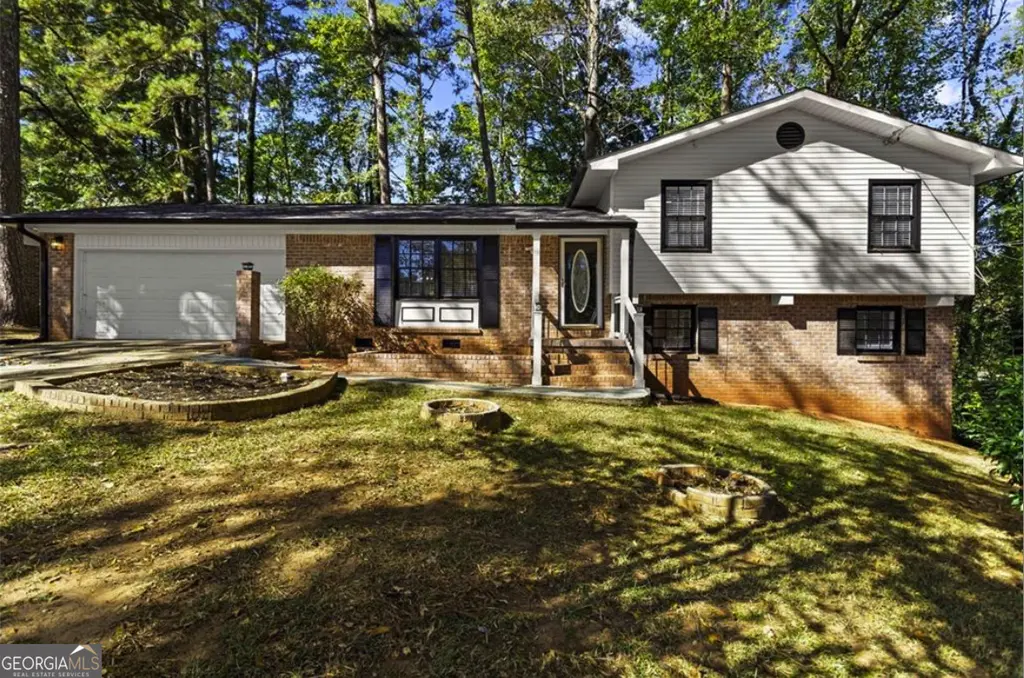
3666 Stanford Cir · Stonecrest, GA
Flood risk 1/10 · Minimal
- FEMA flood zone
- X (unshaded)
- Chance of flooding over 30 yrs
- 0.0%
- Est. flood insurance / yr
- $507 – $1,088
Fire risk 1/10 · Minimal
- Est. fire insurance / yr
- $963 – $1,789
Heat risk 6/10 · Moderate
- Hot days now (above 106°F)
- 7 days/yr
- Hot days in 30 yrs
- 18 days/yr
Wind risk 6/10 · Moderate
- Chance of severe wind over 30 yrs
- 27.0%
Air-quality risk 5/10 · Moderate
- Unhealthy air days now
- 7 days/yr
- Unhealthy air days in 30 yrs
- 10 days/yr
Risk factors via First Street. Map © Google.
Why this score? — see what drove the F grade
The composite is a weighted blend of 9 inputs, each scored 0–100. Each bar is that input's sub-score; the figure is the points it added to the 100-point composite (weight × sub-score).
- ARV discount +9.0/15.0
- Cash flow +8.0/30.0
- Rent growth +3.0/5.0
- 1% rule +2.6/10.0
- Livability +2.5/5.0
- Condition / age +2.5/5.0
- Schools +2.1/10.0
- DSCR +2.0/10.0
- Appreciation +0.0/10.0
$269,999
🖨 Deal sheet (PDF) 📄 Offer letter ✓ Due diligence
Listing remarks MLS
Move-In Ready Gem in Decatur! Welcome to 3666 Stanford Circle in DeKalb County - tucked away on a quiet cul-de-sac, this beautifully updated 4-bedroom, 3-bath home offers the perfect blend of privacy, space, and modern comfort. Step inside to discover fresh finishes, spacious living areas, and a functional layout ideal for both everyday living and entertaining. Enjoy a large private backyard perfect for gatherings, pets, or simply relaxing outdoors. Conveniently located just minutes from shopping, dining, and major highways, this home offers easy access while maintaining a peaceful neighborhood feel. Priced to SELL - don't miss this incredible opportunity!
Key facts
- 0.26 acre lot
- Garage
- Built 1967
Property features AI
Exterior
- Parking: Driveway; Garage; Total parking for 4 vehicles; One garage space; Open parking available
- Utilities: Public water; Public sewer; 220 volt electric; Cable available; Electricity available; Sewer available; Water available
- Home design: Multi/split levels
- Construction: Brick and cement siding construction; Composition roof; Raised foundation; Resale condition
- Exterior features: Patio; Chain link fence; Private road access; Asphalt road surface
Interior
- Kitchen: Stone counters; Dishwasher; Disposal
- Bedrooms: Three bedrooms on upper level; Two bedrooms on lower level
- Flooring: Ceramic tile; Hardwood
- Bathrooms: Three full bathrooms (two upstairs, one downstairs); Master bathroom: none specified
- Heating & cooling: Central air; Electric heating
- Interior features: No shared/common walls; Finished basement with exterior entry; Other interior features
Neighborhood map
What this means for you Summary
Snapshot
- This is a 3-bed/2.0-bath single-family listed at $270k.
Deal economics
- At list price, monthly cash flow is $-280 ($-3k/yr) — negative.
- To cash-flow at today's rent, offer at most $220k (18.3% below list).
- To meet the 1% rule (rent ≥ 1% of price), the offer needs to be $206k (23.7% below list).
- Recommended offer: $206k (23.7% below list) — sets the bar for 1% rule.
Location & tenants
- Location reads: area grade F — affects rentability + tenant quality, not the cash-flow math above.
- Dekalb County (suburban): math 19% / reading 28% proficiency, ranked #125 of 174 in GA (top 72%) — low school quality limits family demand, transient renter base, plan for 1-2y turnover; 68% free/reduced lunch — lower-income household profile, screen leases tightly.
- Zoned schools: Oakcliff Elementary School (math 15% / reading 21%, grade F, #926 of 1,228 statewide, top 76%, 660 students, 94% FRL); The Champion Middle Theme School (math 21% / reading 52%, grade F, #167 of 470 statewide, top 38%, 751 students, 100% FRL); Southwest Dekalb High School (math 17% / reading 37%, grade F, #162 of 424 statewide, top 40%, 1,307 students, 100% FRL) — zoned schools average 98% FRL vs 68% district-wide (30 pts higher); higher-poverty schools than district average — tighter screening recommended.
- Market conditions: Rents rising (+2.2%/yr); 356 active listings in the ZIP; 23 comparable units currently listed for rent nearby; rentals at typical pace (median 26d on market — plan ~3-4 weeks tenant-placement turnaround); 1,240 units permitted in DeKalb County in 2024 (385 in 5+ unit buildings).
- This rent runs 39% of the median local income ($64k/yr) — at the standard rent-burdened threshold; future hikes will face affordability resistance.
Forward outlook
- Local home prices are declining (-3.0%/yr); year-one equity from $2k of loan paydown is wiped out by about $8k of value loss. Plan a longer hold.
- DeKalb County population projected at +28% by 2050 — long-run rental-demand tailwind backs the buy-and-hold thesis.
Negotiation context
- It's been on market 21 days — a 2% lower offer ($266k) is reasonable based on typical stale-listing flexibility.
- 8 sale attempts since 19y ago with the ask held roughly flat each time — persistent listings suggest the price (not the market) is what's stuck; bring a comps-based counter.
- Current owner paid $220k; 23% above their basis — modest negotiation headroom, anchor on the comps not their cost.
Risks & watch-outs
- Climate carrying-cost: major wind risk, 27% chance of damaging wind over 30y; extreme-heat days projected 7→18/yr by 2055 (HVAC capex compounding) — expect insurance premiums to compound above CPI over the hold.
Questions for the listing agent
- What do current leases actually rent for vs. the listed asking? Can we see a recent rent roll and the last 12 months of T-12 income?
- Built in 1967 — when were the roof, HVAC, electrical panel, plumbing, and water heater last replaced?
- Is there a deadline driving the sale (1031 exchange, divorce, estate, relocation)? That informs how much negotiation room exists.
- The area grade is low — what's the realistic commute time and amenity access for the typical tenant pool here? Any planned neighborhood developments (good or bad) we should know about?
- What's the average days-on-market for RENTAL listings here right now (not sales)? A rising rental-DOM trend means longer vacancies and softer asking-rent achievability than the comps imply.
- What's the recent tenant-quality profile in this submarket — average credit score on applications, eviction rate, late-payment / NSF rate, and stable-employment percentage? A property-management company in the area should have these aggregated.
- How much new for-sale + rental construction is in the pipeline within 1–3 miles? Heavy new supply typically softens prices + rents 12–24 months out; constrained supply supports both.
Investment metrics
- 1% rule
- 0.76% ✗
- Cap rate
- 5.05%
- Cash-on-cash
- -4.45%
- DSCR
- 0.80
- GRM
- 10.9
CMA / ARV
- ARV (median comp)
- $279,392
- List price
- $269,999
- Delta
- -3.36%
- Verdict
- FAIR
- Comps
- 20 within 1.0 mi
Show comp detail 12 sales within ~0.75 mi
| Address | Dist | Beds/Ba | Sqft | Sold | Price | $/sf | Match |
|---|---|---|---|---|---|---|---|
| 4196 Lehigh Blvd | 0.25mi | 4/2.0 (+1) | 1,832 (+3%) | 4mo | $210,000 | $115 | 75 |
| 3749 Valpariso Cir | 0.50mi | 3/2.0 | 1,813 (+2%) | 2mo | $265,000 | $146 | 72 |
| 4093 Chapel Mill Bnd | 0.48mi | 3/2.0 | 1,778 (+0%) | 9mo | $264,900 | $149 | 70 |
| 3623 Stanford Cir | 0.11mi | 4/2.5 (+1) | 1,953 (+10%) | 7mo | $300,000 | $154 | 65 |
| 3540 Tarragon Dr | 0.51mi | 3/2.0 | 1,692 (-5%) | 8mo | $215,000 | $127 | 62 |
| 4158 Marist Ct | 0.32mi | 4/2.5 (+1) | 1,961 (+10%) | 2mo | $320,000 | $163 | 59 |
| 3519 Lehigh Way | 0.72mi | 3/2.5 | 1,644 (-7%) | 3mo | $198,000 | $120 | 50 |
| 3635 Sapphire Ct | 0.71mi | 3/2.5 | 1,850 (+4%) | 10mo | $199,900 | $108 | 50 |
| 3640 Sapphire Ct | 0.68mi | 3/2.0 | 1,617 (-9%) | 10mo | $220,900 | $137 | 46 |
| 3320 Tarragon Dr | 0.68mi | 3/2.0 | 1,512 (-15%) | 2mo | $247,000 | $163 | 42 |
| 3633 Emerald Pt | 0.66mi | 3/2.0 | 1,530 (-14%) | 7mo | $215,000 | $141 | 40 |
| 3489 Hollow Tree Dr | 0.70mi | 4/3.0 (+1) | 2,024 (+14%) | 8mo | $250,000 | $124 | 28 |
Match score weights: distance 35% · size 25% · config 20% · recency 20%. Top-matched comps best support the ARV.
Projected returns pro-forma
-3.0% appreciation · 2.18% rent growth · sell at horizon
- IRR
- -24.7%
- Equity multiple
- 0.16×
- Total profit
- $-63,239
- Equity at exit
- $40,258
- IRR
- -23.0%
- Equity multiple
- -0.12×
- Total profit
- $-84,636
- Equity at exit
- $23,345
Cash invested: $75,600 (down + closing). Projections, not guarantees.
Landlord ↔ Tenant lean methodology
- Overall (STATE)
- 90 Strongly Landlord-Friendly
- State Georgia
- 90 Strongly Landlord-Friendly · R+3
- County
- — inherits STATE
- City
- — inherits STATE
ZIP-level market 30034
- Home prices YoY
- -27.4%
- Rents YoY
- 2.2%
- Active inventory
- 356
- Price-to-rent
- 10.9×
Monthly cashflow live
- Estimated rent
- $2,060 high interval (Pro) →
- Mortgage (P&I)
- −$1,416
- Tax from tax record
- −$379 /mo · $4,548/yr
- Insurance
- −$112
- HOA
- −$0
- Vacancy / Maint / Mgmt
- −$433
- Net cashflow
- $-280
Break-even live
Sensitivity live
| Price | -10% $-128 | -5% $-204 | +0% $-280 | +5% $-357 | +10% $-433 |
|---|---|---|---|---|---|
| Rent | -10% $-443 | -5% $-362 | +0% $-280 | +5% $-199 | +10% $-118 |
| Rate | -1.0pp $-144 | -0.5pp $-212 | base $-280 | +0.5pp $-350 | +1.0pp $-422 |
UW: 25.0% down · 7.5% · 30yr · 1.5% tax · 5.0% vac · 8.0% maint · 8.0% mgmt
Financing live
Cash to close
- Down payment
- $67,500
- Closing costs
- $8,100
- Reserves months
- —
- Total cash needed
- —
Loan-product check · same deal, 3 products live
Conventional
25% down · 7.5% · 30yr
- Down + closing
- —
- Monthly P&I
- —
- Monthly cashflow
- —
- DSCR
- —
- Eligible?
- —
Personal DTI + credit; lowest rate.
DSCR
20% down · 8.5% · 30yr
- Down + closing
- —
- Monthly P&I
- —
- Monthly cashflow
- —
- DSCR
- —
- Eligible?
- —
No personal income docs; deal must DSCR.
Hard money
10% down · 12.0% · 12mo
- Down + closing
- —
- Monthly P&I
- —
- Monthly cashflow
- —
- DSCR
- —
- Eligible?
- —
Short-term bridge; refi at stabilization.
Rent comps 23 comps
| Address | Beds | Baths | Sqft | Rent | $/sqft | DOM | Units | Dist |
|---|---|---|---|---|---|---|---|---|
| 3713 Stanford Cir Decatur, GA | 3.0 | 2.0 | 1305 | $1,820 | $1.39 | 1d | 1 | 0.11mi |
| 3667 Manhattan Dr Decatur, GA | 4.0 | 2.5 | 1596 | $1,981 | $1.24 | 1d | 1 | 0.21mi |
| 3577 Brycewood Dr Decatur, GA | 3.0 | 2.5 | 1501 | $1,950 | $1.30 | 45d | 1 | 0.54mi |
| 3583 Brycewood Dr Decatur, GA | 3.0 | 2.5 | 1461 | $2,150 | $1.47 | 45d | 1 | 0.55mi |
| 3856 Radcliffe Blvd Decatur, GA | 4.0 | 3.0 | 1968 | $1,995 | $1.01 | 45d | 1 | 0.57mi |
| 3601 Brycewood Dr Decatur, GA | 3.0 | 2.5 | 1500 | $2,150 | $1.43 | 26d | 1 | 0.57mi |
| 3601 Brycewood Dr Decatur, GA | 3.0 | 2.5 | 1515 | $2,150 | $1.42 | 45d | 1 | 0.57mi |
| 3605 Brycewood Dr Decatur, GA | 3.0 | 3.0 | 1515 | $2,150 | $1.42 | 45d | 1 | 0.57mi |
| 3605 Brycewood Dr Decatur, GA | 3.0 | 2.5 | 1500 | $2,150 | $1.43 | 26d | 1 | 0.57mi |
| 3607 Brycewood Dr Decatur, GA | 3.0 | 3.0 | 1515 | $2,150 | $1.42 | 45d | 1 | 0.58mi |
| 3607 Brycewood Dr Decatur, GA | 3.0 | 2.5 | 1500 | $2,150 | $1.43 | 26d | 1 | 0.58mi |
| 3693 Belmont Abbey Dr Decatur, GA | 4.0 | 2.5 | 2454 | $2,531 | $1.03 | 14d | 1 | 0.96mi |
| 3604 Spring Trce Decatur, GA | 3.0 | 2.5 | 1806 | $1,595 | $0.88 | 45d | 1 | 0.97mi |
| 100 Woodberry Pl Decatur, GA | 1.0–3.0 | 1.0–2.0 | 1106 | $1,743 | $1.58 | 0d | 18 | 1.08mi |
| 3924 Chimney Ridge Ct Ellenwood, GA | 3.0 | 2.0 | 1252 | $2,000 | $1.60 | 45d | 1 | 1.08mi |
| 3948 English Valley Dr Ellenwood, GA | 4.0 | 3.0 | 2492 | $2,590 | $1.04 | 14d | 1 | 1.09mi |
| 3515 Shepherds Path Decatur, GA | 3.0 | 2.0 | 1279 | $1,495 | $1.17 | 45d | 1 | 1.20mi |
| 4068 Day Trl S Ellenwood, GA | 4.0 | 2.0 | 1836 | $2,100 | $1.14 | 6d | 1 | 1.22mi |
| 4000 Wychwood Ln Ellenwood, GA | 4.0 | 2.5 | 2535 | $2,535 | $1.00 | 14d | 1 | 1.22mi |
| 3862 Shane Ct Ellenwood, GA | 4.0 | 2.0 | 1372 | $1,750 | $1.28 | 1d | 1 | 1.26mi |
| 4061 Faron Ct Ellenwood, GA | 4.0 | 2.0 | 2184 | $2,174 | $1.00 | 1d | 1 | 1.30mi |
| 3688 Seton Hall Dr Decatur, GA | 4.0 | 2.5 | 2308 | $2,300 | $1.00 | 6d | 1 | 1.38mi |
| 4611 River Rd Ellenwood, GA | 4.0 | 4.0 | 2564 | $2,181 | $0.85 | 26d | 1 | 1.42mi |
Listing history 33 events
-
2026-06-21days on market $269,999 Active 21 DOM
-
2026-06-18days on market $269,999 Active 18 DOM
-
2026-06-17days on market $269,999 Active 17 DOM
-
2026-06-16days on market $269,999 Active 16 DOM
-
2026-06-15days on market $269,999 Active 15 DOM
-
2026-06-13days on market $269,999 Active 13 DOM
-
2026-06-09days on market $269,999 Active 9 DOM
-
2026-06-08days on market $269,999 Active 8 DOM
-
2026-06-07days on market $269,999 Active 7 DOM
-
2026-06-04days on market $269,999 Active 4 DOM
-
2026-06-03days on market $269,999 Active 3 DOM
-
2026-06-02days on market $269,999 Active 2 DOM
-
2026-05-31days on market $269,999 Active 1 DOM
-
2026-03-06$269,999 New 664-char remark
-
2026-03-04historical $269,999 664-char remark
-
2026-01-02historical
-
2025-12-01$279,900 New
-
2025-12-01historical
-
2025-10-24$299,900 New
-
2025-10-24historical
-
2024-04-01soldstatus $220,000
-
2024-03-29soldstatus $220,000 Sold
-
2024-03-29soldstatus $220,000 Closed
-
2024-03-18status Under Contract
-
2024-03-18status Pending
-
2024-01-25$230,000 Active
-
2024-01-22$230,000 New
-
2007-11-26soldstatus $61,000
-
2007-04-05$74,900
-
1993-11-01soldstatus $53,000
-
1991-02-01soldstatus $60,300
-
1985-09-26soldstatus $63,100
-
1980-08-23soldstatus $51,300
ⓘ Source: listings_history table (triggers on properties + properties_extension) + one-shot
backfill from property_details.listing_events for pre-trigger history.
Tax reassessment forecast GA · Resets to sale price
- Current annual tax
- $4,548 · $379/mo
- Projected year-2 tax
- $4,548 · $379/mo
- Expected delta
- $0/yr ($0/mo · 0.0%)
ⓘ Screening estimate from a state-policy table — verify with the county assessor before closing.
Climate risk First Street
- Flood 1/10 Low FEMA zone X (unshaded) · 0% chance over 30 yrs
- Wildfire 1/10 Low
- Heat 6/10 Major 7 d/yr ≥106°F today · 18 d/yr by 30 yrs out
- Wind 6/10 Major 27% chance of damaging wind over 30 yrs
- Air quality 5/10 Major 7 unhealthy d/yr today · 10 by 30 yrs out
Nearby sold comps map
Loading sold comps map…
Walkable amenities ~0.75 mi
Loading nearby amenities…
Taxation est. · year 1
- Rental income
- $24,714
- − Mortgage interest
- −$15,124
- − Property taxes
- −$4,548
- − Insurance
- −$1,350
- − Repairs & maintenance
- −$1,977
- − Management
- −$1,977
- − Depreciation
- −$7,855
- Taxable loss
- −$8,117
- Est. tax savings @ 24.0%
- +$1,948
- After-tax cash flow
- $-1,417/yr
For passive investors: Depreciation is non-cash, so a rental often shows a tax loss while cash-flowing — sheltering income. Rental losses are passive: they offset passive income freely, and up to $25,000/yr can offset ordinary (W-2) income if you actively participate and your MAGI is under $100k (phasing out to $0 by $150k); unused losses carry forward. On sale, claimed depreciation is recaptured at up to 25%, and gains may owe capital-gains tax (a 1031 exchange can defer both). Figures are a year-1 estimate at your 24.0% rate — not tax advice; consult a CPA.
Schools (NCES district)
- District
- Dekalb County
- NCES district ID
- 1301740
- Math proficiency
- 19% ▼ -12.00%
- Reading proficiency
- 28% ▼ -7.00%
- Median HH income
- $51,448
- Composite
- 20.92/100
- National rank
- #8482
- State rank
- #125 of 174 in GA
Livability — Stonecrest
No livability data for this city. (Only ~50 U.S. cities are tracked.)
Census & demographics
- County
- Dekalb County · 782,738 people
- City population
- 106,165
- Metro
- Atlanta-Sandy Springs-Alpharetta, GA
- Population (ZIP)
- 41,847
- Household income
- $63,517
- Rent vs Own
- Severe rent burden
- 1659.0
Population outlook (DeKalb County) Hauer SSP2
- Today (2025)
- 839,977 people
- By 2030
- 891,768 · +6.2%
- By 2040
- 988,894 · +17.7%
- By 2050
- 1,074,583 · +27.9%
- By 2075
- 1,245,026 · +48.2%
- By 2100
- 1,303,135 · +55.1%
Race, ethnicity, and origin ACS 2023
- Neighborhood character
- Predominantly Black (90%)
- Race & ethnicity
- Black 90% White 4% Two or more races 3% Hispanic / Latino 2%
- Common ancestry
- Hispanic 1% Lithuanian 1%
- Foreign-born
- 8% · Canada
- Languages at home
- 93% English-only · Spanish 2% French/Haitian/Cajun 1%
Political lean MEDSL · DeKalb
- 2024 margin
- Solid D (+64.8) · D 81.9% · R 17.1% · Other 1.0%
- 2008→2024 swing
- +6.1pp toward D · 2008: 58.6pp · 2024: 64.8pp
- All cycles
- 2024: D+64.8 2020: D+67.4 2016: D+64.8 2012: D+56.8 2008: D+58.6
Not yet ingested
- Civics
- —
Market trends
- HPI YoY
- ▼ -78.92%
- Current HPI
- 209.5638
- Rent YoY
- ▲ 2.18%
- Metro
- Atlanta-Sandy Springs-Alpharetta, GA
- State GDP YoY
- ▲ 2.66%
- F500 in state
- 28
Industry mix (Fortune 500 HQ in GA)
| Industry | F500 HQs | Revenue |
|---|---|---|
| Paper / Packaging | 2 | $29B |
|
||
| Retail | 1 | $160B |
|
||
| Transportation / Logistics | 1 | $91B |
|
||
| Airlines | 1 | $62B |
|
||
| Consumer Goods | 1 | $47B |
|
||
| Utilities | 1 | $25B |
|
||
Price history
+426.3% since first listed24 events — show timeline
- 2026-05-31 Listed $269,999 FMLS
- 2026-05-30 Coming Soon $269,999 FMLS
- 2026-05-29 Listing Removed — GAMLS
- 2026-05-29 Listed $269,999 GAMLS
- 2026-03-06 Listed $269,999 GAMLS
- 2026-03-04 Coming Soon — GAMLS
- 2026-01-02 Listing Removed — GAMLS
- 2025-12-01 Listing Removed — GAMLS
- 2025-12-01 Listed $279,900 GAMLS
- 2025-10-24 Listed $299,900 GAMLS
- 2025-10-24 Coming Soon — GAMLS
- 2024-04-01 Sold (Public Records) $220,000 Public Records
- 2024-03-29 Sold (MLS) $220,000 FMLS
- 2024-03-29 Sold (MLS) $220,000 GAMLS
- 2024-03-18 Pending — GAMLS
- 2024-03-18 Pending — FMLS
- 2024-01-25 Listed $230,000 FMLS
- 2024-01-22 Listed $230,000 GAMLS
- 2007-11-26 Sold (MLS) $61,000 FMLS
- 2007-04-05 Listed $74,900 FMLS
- 1993-11-01 Sold (Public Records) $53,000 Public Records
- 1991-02-01 Sold (Public Records) $60,300 Public Records
- 1985-09-26 Sold (Public Records) $63,100 Public Records
- 1980-08-23 Sold (Public Records) $51,300 Public Records
Property tax history
+4.1%/yrLatest (2025): $4,548 · -9.3% YoY. Source: county tax records.
Cash-flow waterfall
monthlySold comps — $/sqft
last 12 mo · ≤1 miLoading sold comps…