4660 S Calloway Dr · Hardinsburg, IN
Flood risk 1/10 · Minimal
- FEMA flood zone
- X (unshaded)
- Chance of flooding over 30 yrs
- 0.0%
- Est. flood insurance / yr
- $507 – $1,088
Fire risk 3/10 · Minor
- Est. fire insurance / yr
- $717 – $1,331
Heat risk 4/10 · Minor
- Hot days now (above 105°F)
- 7 days/yr
- Hot days in 30 yrs
- 18 days/yr
Wind risk 2/10 · Minimal
- Chance of severe wind over 30 yrs
- 1.0%
Air-quality risk 2/10 · Minimal
- Unhealthy air days now
- 0 days/yr
- Unhealthy air days in 30 yrs
- 1 days/yr
Risk factors via First Street. Map © Google.
Why this score? — see what drove the B grade
The composite is a weighted blend of 9 inputs, each scored 0–100. Each bar is that input's sub-score; the figure is the points it added to the 100-point composite (weight × sub-score).
- Cash flow +30.0/30.0
- 1% rule +10.0/10.0
- DSCR +10.0/10.0
- ARV discount +7.5/15.0
- Appreciation +6.4/10.0
- Livability +3.0/5.0
- Schools +2.9/10.0
- Rent growth +2.5/5.0
- Condition / age +2.5/5.0
$70,000
🖨 Deal sheet (PDF) 📄 Offer letter ✓ Due diligence
Listing remarks MLS
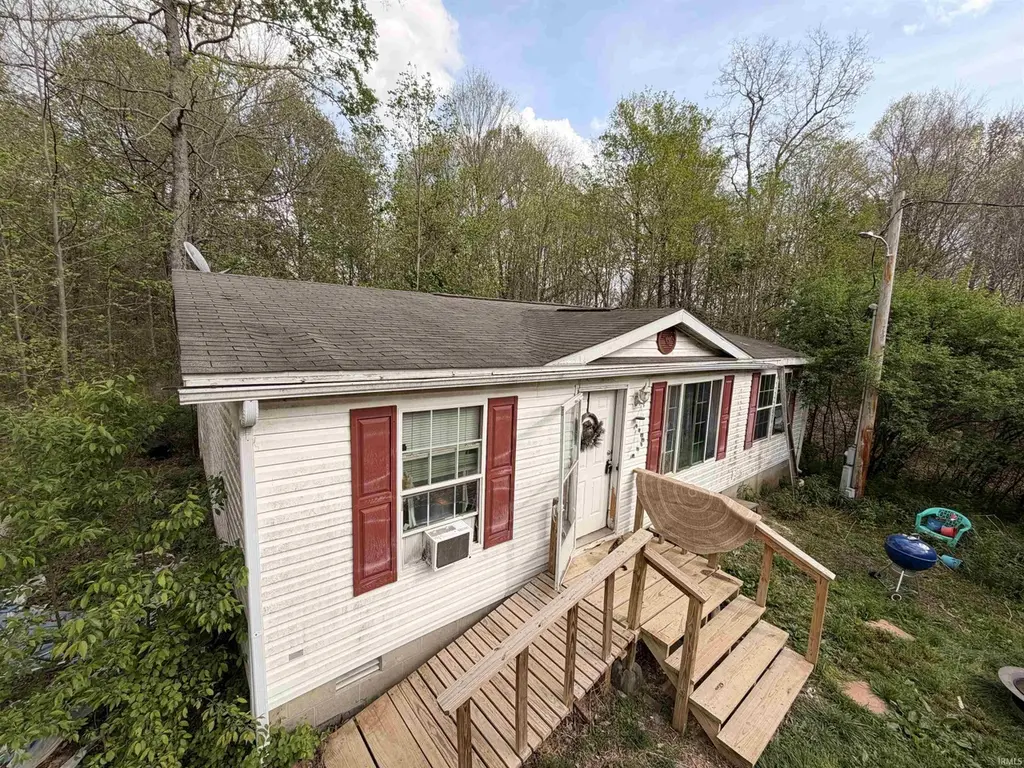
Nearly 4 acres of private, wooded acreage at the end of a quiet road in Orange County. 3 bed / 2 bath home titled as real property with a 24x24 pole barn already on site. Sold as-is; property requires full renovation. Cash or hard money buyers welcome. The land and location are the story here.
Key facts
- Quiet road
- Pole barn
- Land and location
Tags
Neighborhood map
What this means for you Summary
Snapshot
- This is a 3-bed/2.0-bath manufactured listed at $70k.
Deal economics
- At list price, monthly cash flow is $495 ($6k/yr) — positive.
- The deal already cash-flows at list — no discount required.
- Meets the 1% rule at list price ($1k rent vs $70k).
- Recommended offer: $68k (3.0% below list) — sets the bar for market timing.
Location & tenants
- Location reads 60/100 on livability (#535 in IN) — a middle-class / working-renter tenant base. Strengths: cost of living A+, housing A+; Watch: crime C-, health & safety C-, amenities F.
- Paoli Community School Corporation (town): math 28% / reading 42% proficiency, ranked #200 of 301 in IN (top 66%) — families likely to look elsewhere, expect single-tenant / working-renter base with shorter leases.
- Zoned schools: Throop Elementary School (math 36% / reading 36%, grade F, #577 of 994 statewide, top 59%, 712 students, 61% FRL); Paoli Jr & Sr High School (math 19% / reading 50%, grade F, #270 of 369 statewide, top 77%, 561 students, 55% FRL).
- Market conditions: 11 active listings in the ZIP; 54 units permitted in Orange County in 2024 (40 in 5+ unit buildings).
Forward outlook
- In year one you build about $2k of equity ($484 loan paydown + $2k appreciation (2.7% local appreciation)).
- Orange County population projected at -14% by 2050 — secular population decline; favor cash flow + early exit over multi-decade hold.
- At projected returns (2.7% appreciation + 3.0% rent growth), your $20k cash investment doubles in ~3 years — after that, you're playing with house money.
Negotiation context
- It's been on market 42 days — a 3% lower offer ($68k) is reasonable based on typical stale-listing flexibility.
Questions for the listing agent
- It's been on market 42 days. Have you received any prior offers? Is the seller open to a 3% concession, seller financing, or rate buy-down credit?
- Is there a deadline driving the sale (1031 exchange, divorce, estate, relocation)? That informs how much negotiation room exists.
- Schools are F-rated, which usually means shorter tenancies and higher turnover. Who's the typical renter profile here, and what's been the actual vacancy rate?
- What's the average days-on-market for RENTAL listings here right now (not sales)? A rising rental-DOM trend means longer vacancies and softer asking-rent achievability than the comps imply.
- What's the recent tenant-quality profile in this submarket — average credit score on applications, eviction rate, late-payment / NSF rate, and stable-employment percentage? A property-management company in the area should have these aggregated.
- How much new for-sale + rental construction is in the pipeline within 1–3 miles? Heavy new supply typically softens prices + rents 12–24 months out; constrained supply supports both.
Investment metrics
- 1% rule
- 1.70% ✓
- Cap rate
- 14.78%
- Cash-on-cash
- 30.32%
- DSCR
- 2.35
- GRM
- 4.9
CMA / ARV
No comps found within radius.
Projected returns pro-forma
2.73% appreciation · 3.0% rent growth · sell at horizon
- IRR
- 35.7%
- Equity multiple
- 2.99×
- Total profit
- $38,980
- Equity at exit
- $30,421
- IRR
- 36.1%
- Equity multiple
- 5.89×
- Total profit
- $95,809
- Equity at exit
- $46,079
Cash invested: $19,600 (down + closing). Projections, not guarantees.
Landlord ↔ Tenant lean methodology
- Overall (STATE)
- 90 Strongly Landlord-Friendly
- State Indiana
- 90 Strongly Landlord-Friendly · R+11
- County
- — inherits STATE
- City
- — inherits STATE
ZIP-level market 47125
- Home prices YoY
- 1.1%
- Active inventory
- 11
- Price-to-rent
- 4.9×
Monthly cashflow live
- Estimated rent
- $1,193 medium interval (Pro) →
- Mortgage (P&I)
- −$367
- Tax from tax record
- −$51 /mo · $610/yr
- Insurance
- −$29
- HOA
- −$0
- Vacancy / Maint / Mgmt
- −$251
- Net cashflow
- $495
Break-even live
Sensitivity live
| Price | -10% $535 | -5% $515 | +0% $495 | +5% $475 | +10% $456 |
|---|---|---|---|---|---|
| Rent | -10% $401 | -5% $448 | +0% $495 | +5% $542 | +10% $589 |
| Rate | -1.0pp $531 | -0.5pp $513 | base $495 | +0.5pp $477 | +1.0pp $459 |
UW: 25.0% down · 7.5% · 30yr · 1.5% tax · 5.0% vac · 8.0% maint · 8.0% mgmt
Financing live
Cash to close
- Down payment
- $17,500
- Closing costs
- $2,100
- Reserves months
- —
- Total cash needed
- —
Loan-product check · same deal, 3 products live
Conventional
25% down · 7.5% · 30yr
- Down + closing
- —
- Monthly P&I
- —
- Monthly cashflow
- —
- DSCR
- —
- Eligible?
- —
Personal DTI + credit; lowest rate.
DSCR
20% down · 8.5% · 30yr
- Down + closing
- —
- Monthly P&I
- —
- Monthly cashflow
- —
- DSCR
- —
- Eligible?
- —
No personal income docs; deal must DSCR.
Hard money
10% down · 12.0% · 12mo
- Down + closing
- —
- Monthly P&I
- —
- Monthly cashflow
- —
- DSCR
- —
- Eligible?
- —
Short-term bridge; refi at stabilization.
Listing history 3 events
-
2026-05-14price $80,000 294-char remark
Show marketing remark (294 chars)
Nearly 4 acres of private, wooded acreage at the end of a quiet road in Orange County. 3 bed / 2 bath home titled as real property with a 24x24 pole barn already on site. Sold as-is; property requires full renovation. Cash or hard money buyers welcome. The land and location are the story here.
-
2026-05-07price $90,000 294-char remark
Show marketing remark (294 chars)
Nearly 4 acres of private, wooded acreage at the end of a quiet road in Orange County. 3 bed / 2 bath home titled as real property with a 24x24 pole barn already on site. Sold as-is; property requires full renovation. Cash or hard money buyers welcome. The land and location are the story here.
-
2026-04-17$100,000 Active 294-char remark
Show marketing remark (294 chars)
Nearly 4 acres of private, wooded acreage at the end of a quiet road in Orange County. 3 bed / 2 bath home titled as real property with a 24x24 pole barn already on site. Sold as-is; property requires full renovation. Cash or hard money buyers welcome. The land and location are the story here.
ⓘ Source: listings_history table (triggers on properties + properties_extension) + one-shot
backfill from property_details.listing_events for pre-trigger history.
Tax reassessment forecast IN · Partial reset (capped growth)
- Current annual tax
- $610 · $51/mo
- Projected year-2 tax
- $610 · $51/mo
- Expected delta
- $0/yr ($0/mo · 0.0%)
ⓘ Screening estimate from a state-policy table — verify with the county assessor before closing.
Climate risk First Street
- Flood 1/10 Low FEMA zone X (unshaded) · 0% chance over 30 yrs
- Wildfire 3/10 Moderate
- Heat 4/10 Moderate 7 d/yr ≥105°F today · 18 d/yr by 30 yrs out
- Wind 2/10 Low 100% chance of damaging wind over 30 yrs
- Air quality 2/10 Low 0 unhealthy d/yr today · 1 by 30 yrs out
Nearby sold comps map
Loading sold comps map…
Walkable amenities ~0.75 mi
Loading nearby amenities…
Taxation est. · year 1
- Rental income
- $14,314
- − Mortgage interest
- −$3,921
- − Property taxes
- −$610
- − Insurance
- −$350
- − Repairs & maintenance
- −$1,145
- − Management
- −$1,145
- − Depreciation
- −$2,036
- Taxable income
- $5,106
- Est. tax owed @ 24.0%
- −$1,226
- After-tax cash flow
- $4,718/yr
For passive investors: Depreciation is non-cash, so a rental often shows a tax loss while cash-flowing — sheltering income. Rental losses are passive: they offset passive income freely, and up to $25,000/yr can offset ordinary (W-2) income if you actively participate and your MAGI is under $100k (phasing out to $0 by $150k); unused losses carry forward. On sale, claimed depreciation is recaptured at up to 25%, and gains may owe capital-gains tax (a 1031 exchange can defer both). Figures are a year-1 estimate at your 24.0% rate — not tax advice; consult a CPA.
Schools (NCES district)
- District
- Paoli Community School Corporation
- NCES district ID
- 1808640
- Math proficiency
- 28% ▼ -14.00%
- Reading proficiency
- 42% ▼ -5.00%
- Median HH income
- $38,333
- Composite
- 29.18/100
- National rank
- #6571
- State rank
- #200 of 301 in IN
Livability — Hardinsburg
- Score
- 60/100
- State rank
- #535
- US rank
- #19242
Category grades
Schools grade is shown separately in the Schools card above.
Census & demographics
- Population (ZIP)
- 1,684
Population outlook (Orange County) Hauer SSP2
- Today (2025)
- 18,948 people
- By 2030
- 18,479 · -2.5%
- By 2040
- 17,387 · -8.2%
- By 2050
- 16,301 · -14.0%
- By 2075
- 14,361 · -24.2%
- By 2100
- 12,594 · -33.5%
Race, ethnicity, and origin ACS 2023
- Neighborhood character
- Predominantly White (98%)
- Race & ethnicity
- White 98% Two or more races 2%
- Common ancestry
- Lithuanian 3% Slovak 3% Romanian 2%
- Foreign-born
- 0%
- Languages at home
- 88% English-only · German/W. Germanic 11% Spanish 1%
Political lean MEDSL · Orange
- 2024 margin
- Solid R (+52.1) · D 23.1% · R 75.3% · Other 1.6%
- 2008→2024 swing
- -38.0pp toward R · 2008: -14.2pp · 2024: -52.1pp
- All cycles
- 2024: R+52.1 2020: R+47.6 2016: R+45.8 2012: R+21.6 2008: R+14.2
Not yet ingested
- Civics
- —
Market trends
- HPI YoY
- ▲ 2.73%
- Current HPI
- 239.9813
- Rent YoY
- —
- Metro
- —
- State GDP YoY
- ▲ 2.90%
- F500 in state
- 18
Industry mix (Fortune 500 HQ in IN)
| Industry | F500 HQs | Revenue |
|---|---|---|
| Industrial Machinery | 2 | $37B |
|
||
| Healthcare | 1 | $177B |
|
||
| Pharmaceuticals | 1 | $45B |
|
||
| Metals / Steel | 1 | $18B |
|
||
| Agriculture | 1 | $17B |
|
||
| Packaging | 1 | $12B |
|
||
Price history
-20.0% since first listed3 events — show timeline
- 2026-05-14 Price Changed $80,000 IRMLS
- 2026-05-07 Price Changed $90,000 IRMLS
- 2026-04-17 Listed $100,000 IRMLS
Property tax history
+3.5%/yrLatest (2024): $610 · +5.0% YoY. Source: county tax records.
Cash-flow waterfall
monthlySold comps — $/sqft
last 12 mo · ≤1 miLoading sold comps…