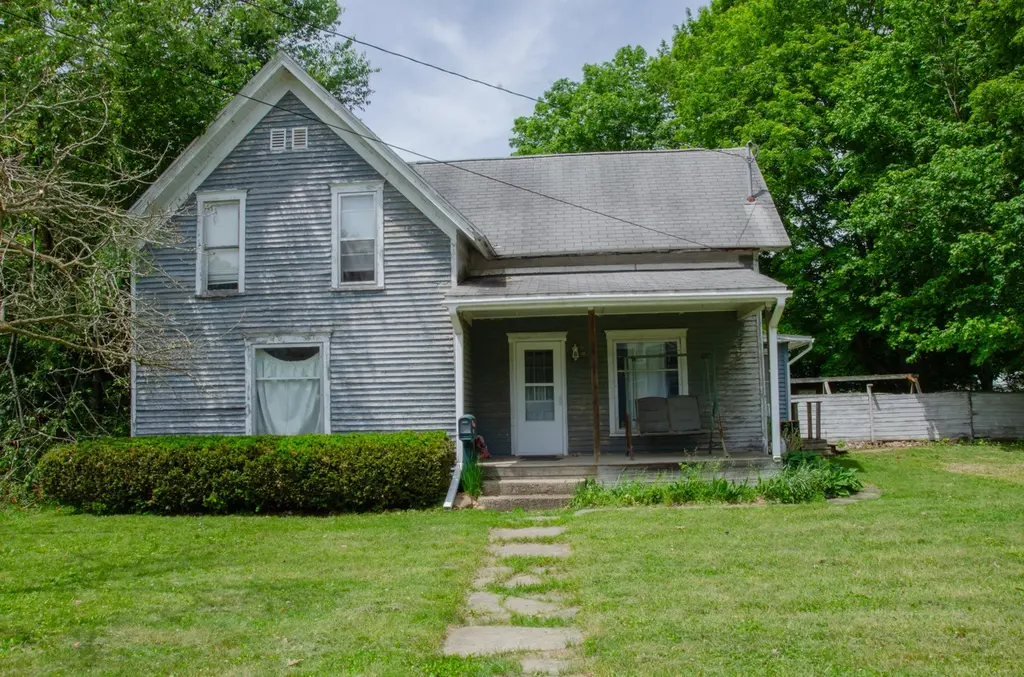
321 S Main St · Bellevue, MI
Flood risk 1/10 · Minimal
- FEMA flood zone
- X (unshaded)
- Chance of flooding over 30 yrs
- 0.0%
- Est. flood insurance / yr
- $507 – $1,088
Fire risk 1/10 · Minimal
- Est. fire insurance / yr
- $784 – $1,456
Heat risk 3/10 · Minor
- Hot days now (above 97°F)
- 7 days/yr
- Hot days in 30 yrs
- 16 days/yr
Wind risk 2/10 · Minimal
- Chance of severe wind over 30 yrs
- —
Air-quality risk 2/10 · Minimal
- Unhealthy air days now
- 0 days/yr
- Unhealthy air days in 30 yrs
- 1 days/yr
Risk factors via First Street. Map © Google.
Why this score? — see what drove the B grade
The composite is a weighted blend of 9 inputs, each scored 0–100. Each bar is that input's sub-score; the figure is the points it added to the 100-point composite (weight × sub-score).
- Cash flow +29.1/30.0
- ARV discount +15.0/15.0
- DSCR +10.0/10.0
- 1% rule +8.2/10.0
- Livability +3.5/5.0
- Rent growth +2.5/5.0
- Condition / age +2.5/5.0
- Schools +2.0/10.0
- Appreciation +0.0/10.0
$100,000
🖨 Deal sheet 📄 Offer letter ✓ Due diligence
Key facts
- 0.23 acre lot
- Garage
- Built 1898
Property features AI
Exterior
- Parking: Detached garage
- Utilities: Public water; Natural gas connected
- Home design: Traditional style single-family residence; Residential property
- Construction: Built in 1898; Wood siding; Composition roof; Crawl space / Michigan basement
- Exterior features: Sidewalk along the lot; Paved road access
Interior
- Kitchen: Kitchen (14 x 12)
- Bedrooms: Primary bedroom (17 x 10); Bedroom 2 (15 x 10); Bedroom 3 (14 x 12)
- Bathrooms: 1 full bathroom; 1 half bathroom
- Heating & cooling: Forced air heating; Has cooling
- Interior features: 8 total rooms; Fireplace; Storm windows and replacement insulated windows; Window treatments
- Laundry & utility: Dedicated laundry room (13 x 14); Dryer included
Neighborhood map
What this means for you Summary
Snapshot
- This is a 3-bed/1.5-bath single-family listed at $100k.
Deal economics
- At list price, monthly cash flow is $346 ($4k/yr) — positive.
- The deal already cash-flows at list — no discount required.
- Meets the 1% rule at list price ($1k rent vs $100k).
- Cap rate 10.4% vs local median 3.3% in Bellevue — top-decile yield for the area; either an underpriced asset or a hidden risk that comps aren't pricing in. Stress-test before assuming the spread holds.
Location & tenants
- Location reads 69/100 on livability (#355 in MI) — a middle-class / working-renter tenant base. Strengths: cost of living A+, housing A+, crime A; Watch: schools D+, amenities F, commute F.
- Bellevue Community Schools (rural): math 14% / reading 30% proficiency, ranked #445 of 540 in MI (top 82%) — low school quality limits family demand, transient renter base, plan for 1-2y turnover.
- Market conditions: 56 active listings in the ZIP; 98 units permitted in Eaton County in 2024 (0 in 5+ unit buildings).
Forward outlook
- Local home prices are declining (-3.0%/yr); year-one equity from $691 of loan paydown is wiped out by about $3k of value loss. Plan a longer hold.
- Eaton County population projected to shrink 5% by 2050 — rents likely to lag national; underwrite the cash flow, not the appreciation.
- At projected returns (-3.0% appreciation + 3.0% rent growth), your $28k cash investment doubles in ~8 years — after that, you're playing with house money.
Negotiation context
- Only 8 days on market — expect competitive offers; lowballing is unlikely to land.
- 5 sale attempts since 28y ago with the ask held roughly flat each time — persistent listings suggest the price (not the market) is what's stuck; bring a comps-based counter.
- Current owner paid $65k; list at $100k implies a 54% gain — meaningful room to come down on a strong offer.
Risks & watch-outs
- Watch-outs: built in 1898 — expect roof / HVAC / electrical / plumbing capex.
Questions for the listing agent
- Built in 1898 — when were the roof, HVAC, electrical panel, plumbing, and water heater last replaced?
- Is there a deadline driving the sale (1031 exchange, divorce, estate, relocation)? That informs how much negotiation room exists.
- Schools are D-rated, which usually means shorter tenancies and higher turnover. Who's the typical renter profile here, and what's been the actual vacancy rate?
- What's the average days-on-market for RENTAL listings here right now (not sales)? A rising rental-DOM trend means longer vacancies and softer asking-rent achievability than the comps imply.
- What's the recent tenant-quality profile in this submarket — average credit score on applications, eviction rate, late-payment / NSF rate, and stable-employment percentage? A property-management company in the area should have these aggregated.
- How much new for-sale + rental construction is in the pipeline within 1–3 miles? Heavy new supply typically softens prices + rents 12–24 months out; constrained supply supports both.
Investment metrics
- 1% rule
- 1.32% ✓
- Cap rate
- 10.44%
- Cash-on-cash
- 14.82%
- DSCR
- 1.66
- GRM
- 6.3
CMA / ARV
- ARV (on-the-fly)
- $191,301
- Comps found
- 12
Show comp detail 12 sales within ~0.75 mi
| Address | Dist | Beds/Ba | Sqft | Sold | Price | $/sf | Match |
|---|---|---|---|---|---|---|---|
| 314 W Jackson St | 0.31mi | 3/2.5 | 1,568 (-1%) | 7mo | $208,500 | $133 | 74 |
| 426 S Webster St | 0.17mi | 4/2.0 (+1) | 1,680 (+6%) | 2mo | $250,000 | $149 | 73 |
| 325 S Elizabeth St | 0.06mi | 4/1.0 (+1) | 1,406 (-11%) | 14mo | $100,000 | $71 | 60 |
| 210 E Capital Ave | 0.22mi | 4/1.0 (+1) | 1,759 (+11%) | 10mo | $156,000 | $89 | 56 |
| 411 W Capital Ave | 0.26mi | 3/1.5 | 1,730 (+9%) | 21mo | $210,000 | $121 | 55 |
| 423 Sherwood Rd | 0.34mi | 4/1.0 (+1) | 1,416 (-10%) | 8mo | $100,000 | $71 | 54 |
| 460 E Ellsworth St | 0.60mi | 3/2.0 | 1,404 (-11%) | 1mo | $192,500 | $137 | 50 |
| 623 N Main St | 0.59mi | 4/1.0 (+1) | 1,740 (+10%) | 8mo | $206,500 | $119 | 42 |
| 623 N Elizabeth St | 0.59mi | 3/1.0 | 1,440 (-9%) | 16mo | $130,000 | $90 | 42 |
| 121 West St | 0.34mi | 3/1.5 | 1,344 (-15%) | 20mo | $162,000 | $121 | 42 |
| 8551 Greenfield Hwy | 0.73mi | 3/1.5 | 1,464 (-7%) | 17mo | $230,000 | $157 | 39 |
| 314 Madison St | 0.42mi | 4/2.0 (+1) | 1,796 (+14%) | 14mo | $223,000 | $124 | 38 |
Match score weights: distance 35% · size 25% · config 20% · recency 20%. Top-matched comps best support the ARV.
Projected returns pro-forma
-3.0% appreciation · 3.0% rent growth · sell at horizon
- IRR
- 5.4%
- Equity multiple
- 1.21×
- Total profit
- $5,840
- Equity at exit
- $14,910
- IRR
- 14.8%
- Equity multiple
- 2.20×
- Total profit
- $33,532
- Equity at exit
- $8,646
Cash invested: $28,000 (down + closing). Projections, not guarantees.
Landlord ↔ Tenant lean methodology
- Overall (STATE)
- 62 Landlord-Friendly
- State Michigan
- 62 Landlord-Friendly · EVEN
- County
- — inherits STATE
- City
- — inherits STATE
ZIP-level market 49021
- Home prices YoY
- -10.1%
- Active inventory
- 56
- Price-to-rent
- 6.3×
Monthly cashflow live
- Estimated rent
- $1,317 medium interval (Pro) →
- Mortgage (P&I)
- −$524
- Tax from tax record
- −$128 /mo · $1,541/yr
- Insurance
- −$42
- HOA
- −$0
- Vacancy / Maint / Mgmt
- −$277
- Net cashflow
- $346
Break-even live
UW: 25.0% down · 7.5% · 30yr · 1.5% tax · 5.0% vac · 8.0% maint · 8.0% mgmt
Financing live
Cash to close
- Down payment
- $25,000
- Closing costs
- $3,000
- Reserves months
- —
- Total cash needed
- —
Loan-product check · same deal, 3 products live
Conventional
25% down · 7.5% · 30yr
- Down + closing
- —
- Monthly P&I
- —
- Monthly cashflow
- —
- DSCR
- —
- Eligible?
- —
Personal DTI + credit; lowest rate.
DSCR
20% down · 8.5% · 30yr
- Down + closing
- —
- Monthly P&I
- —
- Monthly cashflow
- —
- DSCR
- —
- Eligible?
- —
No personal income docs; deal must DSCR.
Hard money
10% down · 12.0% · 12mo
- Down + closing
- —
- Monthly P&I
- —
- Monthly cashflow
- —
- DSCR
- —
- Eligible?
- —
Short-term bridge; refi at stabilization.
Listing history 7 events
-
2026-06-19days on market $100,000 Active 8 DOM
-
2026-06-18days on market $100,000 Active 7 DOM
-
2026-06-17days on market $100,000 Active 6 DOM
-
2026-06-16days on market $100,000 Active 5 DOM
-
2026-06-15days on market $100,000 Active 4 DOM
-
2026-06-14days on market $100,000 Active 2 DOM
-
2026-06-13$100,000 Active 1 DOM
ⓘ Source: listings_history table (triggers on properties + properties_extension) + one-shot
backfill from property_details.listing_events for pre-trigger history.
Tax reassessment forecast MI · Partial reset (capped growth)
- Current annual tax
- $1,541 · $128/mo
- Projected year-2 tax
- $1,541 · $128/mo
- Expected delta
- $0/yr ($0/mo · 0.0%)
ⓘ Screening estimate from a state-policy table — verify with the county assessor before closing.
Climate risk First Street
- Flood 1/10 Low FEMA zone X (unshaded) · 0% chance over 30 yrs
- Wildfire 1/10 Low
- Heat 3/10 Moderate 7 d/yr ≥97°F today · 16 d/yr by 30 yrs out
- Wind 2/10 Low
- Air quality 2/10 Low 0 unhealthy d/yr today · 1 by 30 yrs out
Nearby sold comps map
Loading sold comps map…
Walkable amenities ~0.75 mi
Loading nearby amenities…
Taxation est. · year 1
- Rental income
- $15,801
- − Mortgage interest
- −$5,602
- − Property taxes
- −$1,541
- − Insurance
- −$500
- − Repairs & maintenance
- −$1,264
- − Management
- −$1,264
- − Depreciation
- −$2,909
- Taxable income
- $2,722
- Est. tax owed @ 24.0%
- −$653
- After-tax cash flow
- $3,496/yr
For passive investors: Depreciation is non-cash, so a rental often shows a tax loss while cash-flowing — sheltering income. Rental losses are passive: they offset passive income freely, and up to $25,000/yr can offset ordinary (W-2) income if you actively participate and your MAGI is under $100k (phasing out to $0 by $150k); unused losses carry forward. On sale, claimed depreciation is recaptured at up to 25%, and gains may owe capital-gains tax (a 1031 exchange can defer both). Figures are a year-1 estimate at your 24.0% rate — not tax advice; consult a CPA.
Schools (NCES district)
- District
- Bellevue Community Schools
- NCES district ID
- 2604650
- Math proficiency
- 14% ▼ -5.00%
- Reading proficiency
- 30% ▼ -7.00%
- Median HH income
- $50,826
- Composite
- 19.59/100
- National rank
- #8757
- State rank
- #445 of 540 in MI
Livability — Bellevue
- Score
- 69/100
- State rank
- #355
- US rank
- #9043
Category grades
Schools grade is shown separately in the Schools card above.
Census & demographics
- Census place
- Bellevue, MI
- Population (ZIP)
- 6,467
Population outlook (Eaton County) Hauer SSP2
- Today (2025)
- 110,811 people
- By 2030
- 110,598 · -0.2%
- By 2040
- 108,304 · -2.3%
- By 2050
- 104,961 · -5.3%
- By 2075
- 97,197 · -12.3%
- By 2100
- 85,150 · -23.2%
Race, ethnicity, and origin ACS 2023
- Neighborhood character
- Predominantly White (91%)
- Race & ethnicity
- White 91% Hispanic / Latino 4% Two or more races 4% Black 2%
- Common ancestry
- Iranian 4% Romanian 2% Lithuanian 2%
- Foreign-born
- 1% · Canada
- Languages at home
- 97% English-only · German/W. Germanic 1% Spanish 1%
Political lean MEDSL · Eaton
- 2024 margin
- Toss-up / Even · D 47.6% · R 50.8% · Other 1.6%
- 2008→2024 swing
- -11.6pp toward R · 2008: 8.4pp · 2024: -3.1pp
- All cycles
- 2024: R+3.1 2020: R+0.8 2016: R+5.5 2012: D+3.1 2008: D+8.4
Not yet ingested
- Civics
- —
Market trends
- HPI YoY
- ▼ -30.20%
- Current HPI
- 267.6519
- Rent YoY
- —
- Metro
- —
- State GDP YoY
- ▲ 1.37%
- F500 in state
- 28
Industry mix (Fortune 500 HQ in MI)
| Industry | F500 HQs | Revenue |
|---|---|---|
| Automotive Parts | 3 | $48B |
|
||
| Automotive | 2 | $372B |
|
||
| Chemicals | 1 | $45B |
|
||
| Automotive Retail | 1 | $29B |
|
||
| Healthcare / Medical Devices | 1 | $23B |
|
||
| Automotive Technology | 1 | $20B |
|
||
Price history
+163.9% since first listed8 events — show timeline
- 2026-06-11 Listed $100,000 MiRealSource-MiMLS
- 2026-06-11 Listed $100,000 SW Michigan MLS
- 2026-06-11 Listed $100,000 REALCOMP
- 1999-02-22 Sold (MLS) $65,000 REALCOMP
- 1999-02-22 Sold (MLS) $65,000 SW Michigan MLS
- 1998-12-29 Listed $69,900 REALCOMP
- 1998-12-29 Listed $69,900 SW Michigan MLS
- 1997-04-04 Sold (Public Records) $37,900 Public Records
Property tax history
+9.2%/yrLatest (2025): $1,541 · +3.1% YoY. Source: county tax records.
Cash-flow waterfall
monthlySold comps — $/sqft
last 12 mo · ≤1 miLoading sold comps…