3583 Austin Rd #34 · Geneva, OH
Flood risk 4/10 · Minor
- FEMA flood zone
- X (unshaded)
- Chance of flooding over 30 yrs
- 0.24%
- Est. flood insurance / yr
- $473 – $860
Fire risk 1/10 · Minimal
- Est. fire insurance / yr
- $713 – $1,323
Heat risk 3/10 · Minor
- Hot days now (above 94°F)
- 7 days/yr
- Hot days in 30 yrs
- 18 days/yr
Wind risk 1/10 · Minimal
- Chance of severe wind over 30 yrs
- —
Air-quality risk 3/10 · Minor
- Unhealthy air days now
- 2 days/yr
- Unhealthy air days in 30 yrs
- 5 days/yr
Risk factors via First Street. Map © Google.
Why this score? — see what drove the C+ grade
The composite is a weighted blend of 9 inputs, each scored 0–100. Each bar is that input's sub-score; the figure is the points it added to the 100-point composite (weight × sub-score).
- Cash flow +30.0/30.0
- 1% rule +10.0/10.0
- DSCR +10.0/10.0
- Schools +4.7/10.0
- Condition / age +4.0/5.0
- Livability +3.7/5.0
- Rent growth +2.5/5.0
- ARV discount +0.0/15.0
- Appreciation +0.0/10.0
$67,220
🖨 Deal sheet 📄 Offer letter ✓ Due diligence
Listing remarks
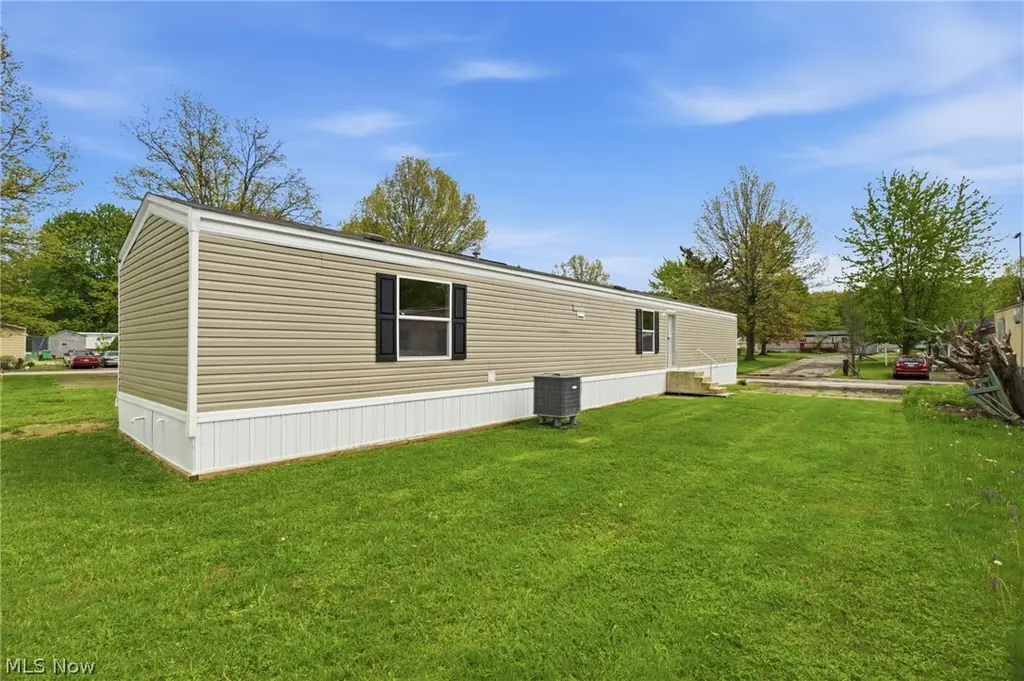
Welcome to your brand-new home in the inviting Austin Woods Community of Geneva, Ohio! This beautiful, never-lived-in manufactured home features three bedrooms and two full bathrooms with an open-concept floor plan designed for modern living. Enjoy a bright, spacious kitchen with contemporary finishes, energy-efficient construction, and comfortable living spaces perfect for entertaining or relaxing at home. Austin Woods is an all-ages, pet-friendly community offering a peaceful setting with convenient access to shopping, dining, wineries, and I-90. With an unbeatable location just minutes from Geneva State Park, Geneva-on-the-Lake, and Lake Erie, all that's left is for you to come see it
Key facts
- Parking
- Built 2025
- Listed 41 days
Tags
Property features AI
Finance
- Other: Above-grade finished area reported by owner
- Financial info: Has land lease with monthly amount of $470
Exterior
- Parking: Driveway parking
- Utilities: Public water; Public sewer
- Home design: Single-story home
- Construction: Vinyl siding; Shingle roof; Built by owner (year built source: Owner)
- Exterior features: Driveway
Interior
- Bedrooms: 3 main-level bedrooms
- Bathrooms: 2 full bathrooms on the main level
- Heating & cooling: Electric heating with heat pump; Central air conditioning
- Interior features: Virtual tour available
Neighborhood map
What this means for you Summary
Snapshot
- This is a 3-bed/2.0-bath single-family listed at $67k. Condition is rated good.
Deal economics
- At list price, monthly cash flow is $759 ($9k/yr) — positive.
- The deal already cash-flows at list — no discount required.
- Meets the 1% rule at list price ($2k rent vs $67k).
- Recommended offer: $65k (3.0% below list) — sets the bar for market timing.
- Cap rate 19.8% vs local median 4.6% in Geneva — top-decile yield for the area; either an underpriced asset or a hidden risk that comps aren't pricing in. Stress-test before assuming the spread holds.
Location & tenants
- Location reads 74/100 on livability (#291 in OH, #4,770 nationally) — a middle-class / working-renter tenant base. Strengths: cost of living A+, housing A+, health & safety A+; Watch: commute F, employment F.
- Geneva Area City (town): math 52% / reading 60% proficiency, ranked #362 of 656 in OH (top 55%) — acceptable for families but not a draw, mixed tenant base, ~2y average lease.
- Market conditions: 86 active listings in the ZIP; 1 comparable units currently listed for rent nearby; 155 units permitted in Ashtabula County in 2024 (0 in 5+ unit buildings).
- This rent runs 32% of the median local income ($58k/yr) — at the standard rent-burdened threshold; future hikes will face affordability resistance.
Forward outlook
- Local home prices are declining (-3.0%/yr); year-one equity from $465 of loan paydown is wiped out by about $2k of value loss. Plan a longer hold.
- Ashtabula County population projected at -22% by 2050 — secular population decline; favor cash flow + early exit over multi-decade hold.
- At projected returns (-3.0% appreciation + 3.0% rent growth), your $19k cash investment doubles in ~3 years — after that, you're playing with house money.
Negotiation context
- It's been on market 41 days — a 3% lower offer ($65k) is reasonable based on typical stale-listing flexibility.
Questions for the listing agent
- It's been on market 41 days. Have you received any prior offers? Is the seller open to a 3% concession, seller financing, or rate buy-down credit?
- Is there a deadline driving the sale (1031 exchange, divorce, estate, relocation)? That informs how much negotiation room exists.
- What's the average days-on-market for RENTAL listings here right now (not sales)? A rising rental-DOM trend means longer vacancies and softer asking-rent achievability than the comps imply.
- What's the recent tenant-quality profile in this submarket — average credit score on applications, eviction rate, late-payment / NSF rate, and stable-employment percentage? A property-management company in the area should have these aggregated.
- How much new for-sale + rental construction is in the pipeline within 1–3 miles? Heavy new supply typically softens prices + rents 12–24 months out; constrained supply supports both.
Investment metrics
- 1% rule
- 2.30% ✓
- Cap rate
- 19.85%
- Cash-on-cash
- 48.40%
- DSCR
- 3.15
- GRM
- 3.6
CMA / ARV
- ARV (median comp)
- $49,995
- List price
- $67,220
- Delta
- 34.45%
- Verdict
- OVERPRICED
- Comps
- 20 within 1.0 mi
Show comp detail 12 sales within ~0.75 mi
| Address | Dist | Beds/Ba | Sqft | Sold | Price | $/sf | Match |
|---|---|---|---|---|---|---|---|
| 3583 Austin Rd #131 | 0.00mi | 3/2.0 | 1,064 (-0%) | 4mo | $49,830 | $47 | 96 |
| 3583 Austin Rd #67 | 0.00mi | 3/2.0 | 1,064 (-0%) | 4mo | $67,225 | $63 | 96 |
| 3583 Austin Dr #94 | 0.12mi | 3/2.0 | 1,056 (-1%) | 4mo | $47,500 | $45 | 90 |
| 3583 Austin Rd #68 | 0.12mi | 3/2.0 | 1,078 (+1%) | 10mo | $49,600 | $46 | 84 |
| 3583 Austin Rd #130 | 0.12mi | 3/2.0 | 1,038 (-3%) | 8mo | $69,000 | $66 | 83 |
| 3583 Austin Rd #102 | 0.12mi | 3/2.0 | 938 (-12%) | 2mo | $44,900 | $48 | 73 |
| 3583 Austin Rd #83 | 0.03mi | 3/2.0 | 938 (-12%) | 7mo | $52,339 | $56 | 73 |
| 3583 Austin Rd #122 | 0.00mi | 3/1.0 | 938 (-12%) | 4mo | $465 | — | 72 |
| 3651 Austin Dr Unit N7 | 0.12mi | 3/2.0 | 1,216 (+14%) | 11mo | $59,400 | $49 | 62 |
| 3583 Austin Rd #27 | 0.12mi | 3/2.0 | 924 (-13%) | 14mo | $30,000 | $32 | 61 |
| 3572 N Broadway | 0.27mi | 2/1.0 (-1) | 1,144 (+7%) | 14mo | $87,500 | $76 | 55 |
| 830 Millwood Dr | 0.66mi | 3/2.0 | 1,200 (+12%) | 8mo | $204,000 | $170 | 41 |
Match score weights: distance 35% · size 25% · config 20% · recency 20%. Top-matched comps best support the ARV.
Projected returns pro-forma
-3.0% appreciation · 3.0% rent growth · sell at horizon
- IRR
- 45.9%
- Equity multiple
- 2.99×
- Total profit
- $37,483
- Equity at exit
- $10,023
- IRR
- 51.7%
- Equity multiple
- 6.05×
- Total profit
- $94,995
- Equity at exit
- $5,812
Cash invested: $18,822 (down + closing). Projections, not guarantees.
Landlord ↔ Tenant lean methodology
- Overall (STATE)
- 73 Landlord-Friendly
- State Ohio
- 73 Landlord-Friendly · R+6
- County
- — inherits STATE
- City
- — inherits STATE
ZIP-level market 44041
- Home prices YoY
- -31.3%
- Active inventory
- 86
- Price-to-rent
- 3.6×
Monthly cashflow live
- Estimated rent
- $1,549 medium interval (Pro) →
- Mortgage (P&I)
- −$353
- Tax est. 1.5%
- −$84 /mo · $1,008/yr
- Insurance
- −$28
- HOA
- −$0
- Vacancy / Maint / Mgmt
- −$325
- Net cashflow
- $759
Break-even live
UW: 25.0% down · 7.5% · 30yr · 1.5% tax · 5.0% vac · 8.0% maint · 8.0% mgmt
Financing live
Cash to close
- Down payment
- $16,805
- Closing costs
- $2,017
- Reserves months
- —
- Total cash needed
- —
Loan-product check · same deal, 3 products live
Conventional
25% down · 7.5% · 30yr
- Down + closing
- —
- Monthly P&I
- —
- Monthly cashflow
- —
- DSCR
- —
- Eligible?
- —
Personal DTI + credit; lowest rate.
DSCR
20% down · 8.5% · 30yr
- Down + closing
- —
- Monthly P&I
- —
- Monthly cashflow
- —
- DSCR
- —
- Eligible?
- —
No personal income docs; deal must DSCR.
Hard money
10% down · 12.0% · 12mo
- Down + closing
- —
- Monthly P&I
- —
- Monthly cashflow
- —
- DSCR
- —
- Eligible?
- —
Short-term bridge; refi at stabilization.
Rent comps 1 comps
| Address | Beds | Baths | Sqft | Rent | $/sqft | DOM | Units | Dist |
|---|---|---|---|---|---|---|---|---|
| 430 Garfield St Geneva, OH | 4.0 | 1.0 | 1248 | $1,549 | $1.24 | 43d | 1 | 1.34mi |
Listing history 15 events
-
2026-06-18days on market $67,220 Active 41 DOM
-
2026-06-17days on market $67,220 Active 40 DOM
-
2026-06-16days on market $67,220 Active 39 DOM
-
2026-06-15days on market $67,220 Active 38 DOM
-
2026-06-13days on market $67,220 Active 36 DOM
-
2026-06-12days on market $67,220 Active 35 DOM
-
2026-06-09days on market $67,220 Active 32 DOM
-
2026-06-08days on market $67,220 Active 31 DOM
-
2026-06-08days on market $67,220 Active 30 DOM
-
2026-06-07days on market $67,220 Active 29 DOM
-
2026-06-04days on market $67,220 Active 26 DOM
-
2026-06-02days on market $67,220 Active 25 DOM
-
2026-06-01days on market $67,220 Active 24 DOM
-
2026-05-31days on market $67,220 Active 23 DOM
-
2026-05-08$67,220 Active 696-char remark
ⓘ Source: listings_history table (triggers on properties + properties_extension) + one-shot
backfill from property_details.listing_events for pre-trigger history.
Climate risk First Street
- Flood 4/10 Moderate FEMA zone X (unshaded) · 24% chance over 30 yrs
- Wildfire 1/10 Low
- Heat 3/10 Moderate 7 d/yr ≥94°F today · 18 d/yr by 30 yrs out
- Wind 1/10 Low
- Air quality 3/10 Moderate 2 unhealthy d/yr today · 5 by 30 yrs out
Nearby sold comps map
Loading sold comps map…
Walkable amenities ~0.75 mi
Loading nearby amenities…
Taxation est. · year 1
- Rental income
- $18,588
- − Mortgage interest
- −$3,765
- − Property taxes
- −$1,008
- − Insurance
- −$336
- − Repairs & maintenance
- −$1,487
- − Management
- −$1,487
- − Depreciation
- −$1,955
- Taxable income
- $8,549
- Est. tax owed @ 24.0%
- −$2,052
- After-tax cash flow
- $7,058/yr
For passive investors: Depreciation is non-cash, so a rental often shows a tax loss while cash-flowing — sheltering income. Rental losses are passive: they offset passive income freely, and up to $25,000/yr can offset ordinary (W-2) income if you actively participate and your MAGI is under $100k (phasing out to $0 by $150k); unused losses carry forward. On sale, claimed depreciation is recaptured at up to 25%, and gains may owe capital-gains tax (a 1031 exchange can defer both). Figures are a year-1 estimate at your 24.0% rate — not tax advice; consult a CPA.
Condition & rehab AI · 22 photos
This move-in-ready manufactured home in Austin Woods Community of Geneva, Ohio, features a good condition with modern finishes and an open-concept floor plan. It offers a great opportunity for an investor to purchase a home in a desirable location with minimal repairs needed.
Value-add opportunities
- Resale Painting the exterior siding — Enhances curb appeal and can increase property value
- Resale Landscaping improvements — Enhances curb appeal and can increase property value
- Resale Upgrading the kitchen appliances — Modernizes the kitchen and can increase property value
- Resale Upgrading the bathrooms with modern fixtures — Modernizes the bathrooms and can increase property value
Renovation cost estimate screening
Value-add ROI direction
- Resale Painting the exterior siding — Enhances curb appeal and can increase property value ↑
- Resale Landscaping improvements — Enhances curb appeal and can increase property value ↑
- Resale Upgrading the kitchen appliances — Modernizes the kitchen and can increase property value ↑
- Resale Upgrading the bathrooms with modern fixtures — Modernizes the bathrooms and can increase property value ↑
ⓘ Cost ranges are severity-bucket heuristics (US national rule-of-thumb). Get contractor quotes + a written scope before underwriting a rehab budget.
Schools (NCES district)
- District
- Geneva Area City
- NCES district ID
- 3904405
- Math proficiency
- 52% ▼ -16.00%
- Reading proficiency
- 60% ▼ -2.00%
- Median HH income
- $43,525
- Composite
- 47.12/100
- National rank
- #2328
- State rank
- #362 of 656 in OH
Livability — Geneva
- Score
- 74/100
- State rank
- #291
- US rank
- #4770
Category grades
Schools grade is shown separately in the Schools card above.
Census & demographics
- County
- Ashtabula · 97,617 people
- Metro
- Cleveland, OH
- Population (ZIP)
- 13,992
- Household income
- $58,438
- Rent vs Own
- Severe rent burden
- 12.5
Population outlook (Ashtabula County) Hauer SSP2
- Today (2025)
- 92,950 people
- By 2030
- 89,146 · -4.1%
- By 2040
- 80,715 · -13.2%
- By 2050
- 72,270 · -22.2%
- By 2075
- 55,780 · -40.0%
- By 2100
- 40,928 · -56.0%
Race, ethnicity, and origin ACS 2023
- Neighborhood character
- Predominantly White (85%)
- Race & ethnicity
- White 85% Hispanic / Latino 7% Two or more races 6% Black 4%
- Hispanic origin (detail)
- Mexican 1% Puerto Rican 4%
- Common ancestry
- Romanian 3% Slovak 2% Lithuanian 2%
- Foreign-born
- 1% · Canada
- Languages at home
- 96% English-only · Spanish 4%
Political lean MEDSL · Ashtabula
- 2024 margin
- Strong R (+28.4) · D 35.4% · R 63.8%
- 2008→2024 swing
- -41.9pp toward R · 2008: 13.5pp · 2024: -28.4pp
- All cycles
- 2024: R+28.4 2020: R+23.5 2016: R+19.0 2012: D+12.1 2008: D+13.5
Not yet ingested
- Civics
- —
Market trends
- HPI YoY
- ▼ -105.04%
- Current HPI
- 230.8747
- Rent YoY
- —
- Metro
- —
- State GDP YoY
- ▲ 1.98%
- F500 in state
- 48
Industry mix (Fortune 500 HQ in OH)
| Industry | F500 HQs | Revenue |
|---|---|---|
| Insurance | 3 | $145B |
|
||
| Industrial Machinery | 3 | $49B |
|
||
| Financial Services | 3 | $24B |
|
||
| Consumer Goods | 2 | $93B |
|
||
| Aerospace / Defense | 2 | $47B |
|
||
| Utilities | 2 | $33B |
|
||
Price history
1 event — show timeline
- 2026-05-08 Listed $67,220 MLSNOW
Cash-flow waterfall
monthlySold comps — $/sqft
last 12 mo · ≤1 miLoading sold comps…