 Multi-family
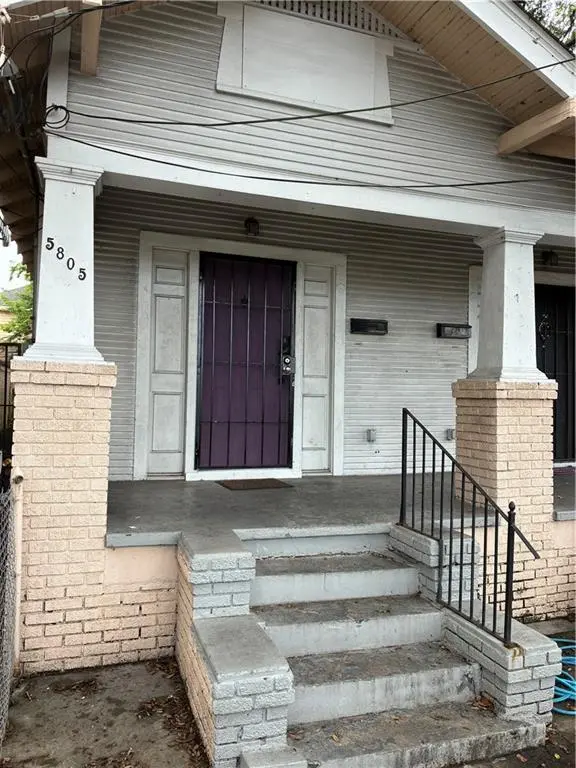
5805-07 St Claude Ave · New Orleans, LA
Flood risk 8/10 · Major
- FEMA flood zone
- X (shaded)
- Chance of flooding over 30 yrs
- 0.6%
- Est. flood insurance / yr
- $507 – $1,088
Fire risk 1/10 · Minimal
- Est. fire insurance / yr
- $1,269 – $2,357
Heat risk 10/10 · Severe
- Hot days now (above 108°F)
- 7 days/yr
- Hot days in 30 yrs
- 21 days/yr
Wind risk 10/10 · Severe
- Chance of severe wind over 30 yrs
- 99.0%
Air-quality risk 3/10 · Minor
- Unhealthy air days now
- 3 days/yr
- Unhealthy air days in 30 yrs
- 3 days/yr
Risk factors via First Street. Map © Google.
Why this score? — see what drove the C grade
The composite is a weighted blend of 9 inputs, each scored 0–100. Each bar is that input's sub-score; the figure is the points it added to the 100-point composite (weight × sub-score).
- Cash flow +28.2/30.0
- DSCR +10.0/10.0
- 1% rule +7.8/10.0
- Livability +4.0/5.0
- Rent growth +3.1/5.0
- Condition / age +2.2/5.0
- Schools +1.6/10.0
- ARV discount +0.0/15.0
- Appreciation +0.0/10.0
$200,000
🖨 Deal sheet 📄 Offer letter ✓ Due diligence
Multi-family units
County records classify this as Multi-Family (5+ Unit). Listing-text estimate: 1 unit. estimate disagrees with records
5+ unit building — per-unit beds/baths from public records are typically unavailable; the breakdown below (if shown) is an estimate from the listing text.
Listing remarks MLS
Clean shotgun-style double in Holy Cross neighborhood, around the corner from Fats Domino St. One side is occupied, the other side just listed to rent. Fridge, stove, washer & dryer supplied on both sides. SEPARATE meters. Live on one side and tenant pays $1000 to you. Just minutes to French Quarter and I-10.
Key facts
- Fats domino st
- Minutes to i-10
- Separate meters
Tags
Property features AI
Finance
- Other: Total of 2 units on the property
- Financial info: Two rental units with current rents: Unit 1 (Unit number 1) rents for $1,200; Unit 2 (Unit number 2) rents for $1,000
- HOA & community: No HOA information provided
Exterior
- Parking: No parking details provided
- Security: No security details provided
- Utilities: Public water; Public sewer; Tenants pay electricity, gas, and water
- Home design: Single-story property; Raised foundation
- Construction: Wood siding; Shingle roof; Built with a raised foundation
- Exterior features: City lot; Rectangular lot (30 x 110)
Interior
- Kitchen: No specific kitchen appliance details provided
- Bedrooms: Two 2-bedroom units
- Flooring: No flooring details provided
- Bathrooms: Two full bathrooms total (one full bathroom in each unit)
- Heating & cooling: Window heating unit; Window cooling units
- Interior features: Average condition
- Laundry & utility: No laundry details provided
Neighborhood map
What this means for you Summary
Snapshot
- This is a 4-bed/2.0-bath multifamily listed at $200k. Condition is rated fair.
Deal economics
- At list price, monthly cash flow is $570 ($7k/yr) — positive.
- The deal already cash-flows at list — no discount required.
- Meets the 1% rule at list price ($3k rent vs $200k).
- Recommended offer: $197k (1.5% below list) — sets the bar for market timing.
- Cap rate 10.1% vs local median 4.4% in New Orleans — top-decile yield for the area; either an underpriced asset or a hidden risk that comps aren't pricing in. Stress-test before assuming the spread holds.
Location & tenants
- Location reads 81/100 on livability (#3 in LA, #1,383 nationally) — a professional / high-income tenant draw. Strengths: amenities A+, commute A+, health & safety A+; Watch: crime C-, employment D.
- Orleans Parish (urban): math 11% / reading 27% proficiency, ranked #69 of 98 in LA (top 70%) — low school quality limits family demand, transient renter base, plan for 1-2y turnover; 68% free/reduced lunch — lower-income household profile, screen leases tightly.
- Market conditions: Rents rising (+2.5%/yr); 581 active listings in the ZIP; 40 comparable units currently listed for rent nearby; rentals at typical pace (median 15d on market — plan ~3-4 weeks tenant-placement turnaround); 710 units permitted in Orleans Parish in 2024 (244 in 5+ unit buildings).
- At $2,555/mo this rent would consume 67% of the median local household income ($46k/yr) (locally 1988% of renters already pay >50% of income on rent) — very limited rent-growth headroom before tenants either downsize or default.
Forward outlook
- Local home prices are declining (-3.0%/yr); year-one equity from $1k of loan paydown is wiped out by about $6k of value loss. Plan a longer hold.
- Orleans County population projected at +61% by 2050 — long-run rental-demand tailwind backs the buy-and-hold thesis.
- At projected returns (-3.0% appreciation + 2.5% rent growth), your $56k cash investment doubles in ~10 years — after that, you're playing with house money.
Negotiation context
- It's been on market 23 days — a 2% lower offer ($197k) is reasonable based on typical stale-listing flexibility.
- 8 sale attempts since 7y ago with the ask held roughly flat each time — persistent listings suggest the price (not the market) is what's stuck; bring a comps-based counter.
Risks & watch-outs
- Watch-outs: flood insurance adds $66/mo; built in 1947 — expect roof / HVAC / electrical / plumbing capex.
- Climate carrying-cost: severe flood risk; severe wind risk, 99% chance of damaging wind over 30y; extreme-heat days projected 7→21/yr by 2055 (HVAC capex compounding) — expect insurance premiums to compound above CPI over the hold.
Questions for the listing agent
- Have any recent inspections been done? Can we get a copy of the seller's disclosures and any deferred-maintenance estimates?
- Built in 1947 — when were the roof, HVAC, electrical panel, plumbing, and water heater last replaced?
- What's the actual annual flood-insurance premium (NFIP or private), and is the property in a SFHA with mandatory coverage?
- Is there a deadline driving the sale (1031 exchange, divorce, estate, relocation)? That informs how much negotiation room exists.
- What's the average days-on-market for RENTAL listings here right now (not sales)? A rising rental-DOM trend means longer vacancies and softer asking-rent achievability than the comps imply.
- What's the recent tenant-quality profile in this submarket — average credit score on applications, eviction rate, late-payment / NSF rate, and stable-employment percentage? A property-management company in the area should have these aggregated.
- How much new apartment / multifamily construction is in the pipeline within 1–3 miles? Heavy new supply (>2% of stock underway) typically softens rents 12–24 months out; light construction supports rent growth.
Investment metrics
- 1% rule
- 1.28% ✓
- Cap rate
- 10.11%
- Cash-on-cash
- 13.63%
- DSCR
- 1.61
- GRM
- 6.5
CMA / ARV
- ARV (on-the-fly)
- $153,000
- Comps found
- 8
Show comp detail 8 sales within ~0.75 mi
| Address | Dist | Beds/Ba | Sqft | Sold | Price | $/sf | Match |
|---|---|---|---|---|---|---|---|
| 5721 23 Royal St | 0.30mi | 4/2.0 | 1,508 (+0%) | 20mo | $150,000 | $99 | 68 |
| 1001 3 Gordon St | 0.14mi | 4/2.0 | 1,580 (+5%) | 22mo | $170,000 | $108 | 66 |
| 5450-52 Burgundy St | 0.30mi | 4/2.0 | 1,471 (-2%) | 23mo | $185,000 | $126 | 64 |
| 5406 Urquhart St | 0.29mi | 4/2.0 | 1,368 (-9%) | 12mo | $90,000 | $66 | 62 |
| 5445-47 Burgundy St | 0.28mi | 4/— | 1,392 (-7%) | 22mo | $133,000 | $96 | 57 |
| 5445 47 Burgundy St | 0.28mi | 4/2.0 | 1,392 (-7%) | 22mo | $133,000 | $96 | 56 |
| 5717 19 Royal St | 0.31mi | 4/2.0 | 1,716 (+14%) | 14mo | $175,000 | $102 | 50 |
| 5020 Chartres St | 0.65mi | 4/2.0 | 1,600 (+7%) | 12mo | $177,000 | $111 | 48 |
Match score weights: distance 35% · size 25% · config 20% · recency 20%. Top-matched comps best support the ARV.
Projected returns pro-forma
-3.0% appreciation · 2.49% rent growth · sell at horizon
- IRR
- 1.2%
- Equity multiple
- 1.05×
- Total profit
- $2,659
- Equity at exit
- $29,821
- IRR
- 10.4%
- Equity multiple
- 1.79×
- Total profit
- $44,074
- Equity at exit
- $17,292
Cash invested: $56,000 (down + closing). Projections, not guarantees.
Landlord ↔ Tenant lean methodology
- Overall (STATE)
- 90 Strongly Landlord-Friendly
- State Louisiana
- 90 Strongly Landlord-Friendly · R+12
- County
- — inherits STATE
- City
- — inherits STATE
ZIP-level market 70117
- Rents YoY
- 2.5%
- Active inventory
- 581
- Price-to-rent
- 13.0×
Monthly cashflow live
- Estimated rent
- $2,555 high interval (Pro) →
- Mortgage (P&I)
- −$1,049
- Tax est. 1.5%
- −$250 /mo · $3,000/yr
- Insurance
- −$83
- Flood insurance flood zone
- −$66 /mo · $798/yr
- HOA
- −$0
- Vacancy / Maint / Mgmt
- −$537
- Net cashflow
- $570
Break-even live
2-unit breakdown (identical units grouped — click to expand)
| Units | Beds | Baths | Est. rent |
|---|---|---|---|
| 2× units | 1 | 1 | $2,556 |
| #1 | 1 | 1 | $1,278 |
| #2 | 1 | 1 | $1,278 |
| Total (2 units) | $2,555 | ||
UW: 25.0% down · 7.5% · 30yr · 1.5% tax · 5.0% vac · 8.0% maint · 8.0% mgmt
Financing live
Cash to close
- Down payment
- $50,000
- Closing costs
- $6,000
- Reserves months
- —
- Total cash needed
- —
Loan-product check · same deal, 3 products live
Conventional
25% down · 7.5% · 30yr
- Down + closing
- —
- Monthly P&I
- —
- Monthly cashflow
- —
- DSCR
- —
- Eligible?
- —
Personal DTI + credit; lowest rate.
DSCR
20% down · 8.5% · 30yr
- Down + closing
- —
- Monthly P&I
- —
- Monthly cashflow
- —
- DSCR
- —
- Eligible?
- —
No personal income docs; deal must DSCR.
Hard money
10% down · 12.0% · 12mo
- Down + closing
- —
- Monthly P&I
- —
- Monthly cashflow
- —
- DSCR
- —
- Eligible?
- —
Short-term bridge; refi at stabilization.
Rent comps 40 comps
| Address | Beds | Baths | Sqft | Rent | $/sqft | DOM | Units | Dist |
|---|---|---|---|---|---|---|---|---|
| 1301 Lamanche St New Orleans, LA | 3.0 | 2.0 | 1090 | $1,600 | $1.47 | 2d | 1 | 0.13mi |
| 1301 Lamanche St New Orleans, LA | 3.0 | 2.0 | 1178 | $1,600 | $1.36 | 23d | 1 | 0.13mi |
| 1301 Lamanche St New Orleans, LA | 3.0 | 2.0 | 1090 | $1,600 | $1.47 | 3d | 1 | 0.13mi |
| 1201 Gordon St New Orleans, LA | 3.0 | 2.5 | 1367 | $1,900 | $1.39 | 16d | 1 | 0.15mi |
| 1314 Lamanche St New Orleans, LA | 4.0 | 1.0 | 1300 | $2,100 | $1.62 | 15d | 1 | 0.16mi |
| 5461 Saint Claude Ave New Orleans, LA | 4.0 | 2.0 | 1250 | $2,350 | $1.88 | 23d | 1 | 0.19mi |
| 5459 Saint Claude Ave Unit 5461 New Orleans, LA | 4.0 | 2.0 | 1454 | $2,350 | $1.62 | 23d | 1 | 0.20mi |
| 1327 Fats Domino Ave Unit A New Orleans, LA | 3.0 | 2.0 | 1200 | $1,900 | $1.58 | 3d | 1 | 0.20mi |
| 1327 Fats Domino Ave Unit B New Orleans, LA | 4.0 | 2.0 | 1200 | $2,200 | $1.83 | 15d | 1 | 0.20mi |
| 6038 N Rampart St New Orleans, LA | 3.0 | 2.0 | 1080 | $1,795 | $1.66 | 23d | 1 | 0.21mi |
| 906 Flood St New Orleans, LA | 3.0 | 3.0 | 1174 | $1,700 | $1.45 | 1d | 1 | 0.25mi |
| 1422 Andry St New Orleans, LA | 3.0 | 2.0 | 1100 | $1,400 | $1.27 | 3d | 1 | 0.37mi |
| 1714 Tricou St New Orleans, LA | 3.0 | 2.0 | 1271 | $1,900 | $1.49 | 23d | 1 | 0.54mi |
| 617 Forstall St New Orleans, LA | 3.0 | 2.0 | 1262 | $2,200 | $1.74 | 3d | 1 | 0.57mi |
| 1925 Alabo St Unit A New Orleans, LA | 3.0 | 2.0 | 1199 | $1,500 | $1.25 | 21d | 1 | 0.58mi |
| 1333 Angela Ave Arabi, LA | 3.0 | 2.0 | 1090 | $1,850 | $1.70 | 2d | 1 | 0.59mi |
| 1824 Saint Maurice Ave New Orleans, LA | 4.0 | 2.0 | 1500 | $1,500 | $1.00 | 23d | 1 | 0.60mi |
| 1901 Tupelo St New Orleans, LA | 3.0 | 2.5 | 1568 | $2,300 | $1.47 | 3d | 1 | 0.61mi |
| 619 Reynes St New Orleans, LA | 3.0 | 2.0 | 1318 | $2,100 | $1.59 | 15d | 1 | 0.62mi |
| 6900 Royal St Arabi, LA | 3.0 | 2.0 | 1579 | $5,888 | $3.73 | 2d | 1 | 0.78mi |
| 5618 N Tonti St New Orleans, LA | 3.0 | 2.0 | 1128 | $1,550 | $1.37 | 23d | 1 | 0.85mi |
| 438 Friscoville Ave Arabi, LA | 3.0 | 2.0 | 1500 | $3,200 | $2.13 | 2d | 1 | 0.90mi |
| 2012 Esteban St Arabi, LA | 3.0 | 2.0 | 1466 | $2,500 | $1.71 | 10d | 1 | 0.94mi |
| 1019 Center St Arabi, LA | 5.0 | 3.0 | 1973 | $5,888 | $2.98 | 1d | 1 | 0.97mi |
| 1239 Center St Arabi, LA | 4.0 | 2.0 | 1922 | $3,500 | $1.82 | 2d | 1 | 0.99mi |
| 2539 Fats Domino Ave New Orleans, LA | 3.0 | 2.0 | 1184 | $1,850 | $1.56 | 20d | 1 | 1.08mi |
| 2301 Esteban St Arabi, LA | 3.0 | 1.0 | 1102 | $1,800 | $1.63 | 14d | 1 | 1.10mi |
| 4317 Urquhart St New Orleans, LA | 3.0 | 2.0 | 1300 | $1,650 | $1.27 | 23d | 1 | 1.13mi |
| 1511 Schnell Dr Arabi, LA | 4.0 | 3.0 | 1700 | $1,850 | $1.09 | 3d | 1 | 1.13mi |
| 4318 1/2 N Robertson St New Orleans, LA | 3.0 | 1.0 | 1250 | $1,150 | $0.92 | 2d | 1 | 1.14mi |
| 4318 N Robertson St New Orleans, LA | 3.0 | 1.0 | 1250 | $1,150 | $0.92 | 3d | 1 | 1.14mi |
| 1403 Lesseps St New Orleans, LA | 3.0 | 3.0 | 1700 | $1,800 | $1.06 | 11d | 1 | 1.15mi |
| 1529 Schnell Dr Arabi, LA | 3.0 | 2.5 | 1736 | $2,600 | $1.50 | 1d | 1 | 1.17mi |
| 4230 N Claiborne Ave New Orleans, LA | 3.0 | 2.5 | 1296 | $1,750 | $1.35 | 23d | 1 | 1.20mi |
| 1411 France St New Orleans, LA | 3.0 | 2.0 | 1525 | $2,000 | $1.31 | 23d | 1 | 1.21mi |
| 4222 N Johnson St New Orleans, LA | 3.0 | 2.0 | 1100 | $1,895 | $1.72 | 23d | 1 | 1.33mi |
| 310 Lynx Dr Arabi, LA | 3.0 | 2.0 | 1050 | $1,775 | $1.69 | 23d | 1 | 1.35mi |
| 7532 Patricia St Arabi, LA | 4.0 | 3.0 | 2099 | $2,200 | $1.05 | 43d | 1 | 1.36mi |
| 7532 Patricia St Arabi, LA | 3.0 | 2.0 | 1850 | $1,900 | $1.03 | 1d | 1 | 1.37mi |
| 7532 Patricia St Arabi, LA | 3.0 | 2.0 | 1850 | $1,900 | $1.03 | 2d | 1 | 1.37mi |
Listing history 24 events
-
2026-06-18days on market $200,000 Active 23 DOM
-
2026-06-17days on market $200,000 Active 22 DOM
-
2026-06-16days on market $200,000 Active 21 DOM
-
2026-06-15days on market $200,000 Active 20 DOM
-
2026-06-13days on market $200,000 Active 18 DOM
-
2026-06-10days on market $200,000 Active 15 DOM
-
2026-06-09days on market $200,000 Active 14 DOM
-
2026-06-08days on market $200,000 Active 13 DOM
-
2026-06-07days on market $200,000 Active 12 DOM
-
2026-06-05days on market $200,000 Active 9 DOM
-
2026-06-03days on market $200,000 Active 8 DOM
-
2026-06-02days on market $200,000 Active 7 DOM
-
2026-06-01days on market $200,000 Active 6 DOM
-
2026-05-31days on market $200,000 Active 5 DOM
-
2026-05-26$200,000 Active 314-char remark
Show marketing remark (314 chars)
Clean shotgun-style double in Holy Cross neighborhood, around the corner from Fats Domino St. One side is occupied, the other side just listed to rent. Fridge, stove, washer & dryer supplied on both sides. SEPARATE meters. Live on one side and tenant pays $1000 to you. Just minutes to French Quarter and I-10.
-
2026-05-26$200,000 Active
Show marketing remark (314 chars)
Clean shotgun-style double in Holy Cross neighborhood, around the corner from Fats Domino St. One side is occupied, the other side just listed to rent. Fridge, stove, washer & dryer supplied on both sides. SEPARATE meters. Live on one side and tenant pays $1000 to you. Just minutes to French Quarter and I-10.
-
2025-08-03historical $1,050
-
2025-08-01$1,050
-
2025-07-02historical $1,050
-
2025-03-24$1,050
-
2022-09-14$194,050
-
2022-01-25$199,500
-
2021-01-07$205,000
-
2019-03-29$189,000
ⓘ Source: listings_history table (triggers on properties + properties_extension) + one-shot
backfill from property_details.listing_events for pre-trigger history.
Climate risk First Street
- Flood 8/10 Severe FEMA zone X (shaded) · 60% chance over 30 yrs
- Wildfire 1/10 Low
- Heat 10/10 Extreme 7 d/yr ≥108°F today · 21 d/yr by 30 yrs out
- Wind 10/10 Extreme 99% chance of damaging wind over 30 yrs
- Air quality 3/10 Moderate 3 unhealthy d/yr today · 3 by 30 yrs out
Nearby sold comps map
Loading sold comps map…
Walkable amenities ~0.75 mi
Loading nearby amenities…
Taxation est. · year 1
- Rental income
- $30,660
- − Mortgage interest
- −$11,203
- − Property taxes
- −$3,000
- − Insurance
- −$1,798
- − Repairs & maintenance
- −$2,453
- − Management
- −$2,453
- − Depreciation
- −$5,818
- Taxable income
- $3,936
- Est. tax owed @ 24.0%
- −$945
- After-tax cash flow
- $5,893/yr
For passive investors: Depreciation is non-cash, so a rental often shows a tax loss while cash-flowing — sheltering income. Rental losses are passive: they offset passive income freely, and up to $25,000/yr can offset ordinary (W-2) income if you actively participate and your MAGI is under $100k (phasing out to $0 by $150k); unused losses carry forward. On sale, claimed depreciation is recaptured at up to 25%, and gains may owe capital-gains tax (a 1031 exchange can defer both). Figures are a year-1 estimate at your 24.0% rate — not tax advice; consult a CPA.
Condition & rehab AI · 13 photos
The property is in fair condition with some repairs and maintenance needed. The exterior and landscaping are in poor condition, and the interior walls and paint are in average condition. The HVAC and mechanical systems are in average condition. The property has potential for improvement with painting, landscaping, and HVAC maintenance.
Repairs flagged
- Major fence — The fence is in poor condition and needs to be replaced or repaired.
- Major landscaping — The overgrown vegetation and poor landscaping need to be addressed.
- Major exterior siding — The siding shows signs of aging and potential damage, which needs to be addressed.
Value-add opportunities
- Both Painting the exterior and interior walls — Painting the exterior and interior walls can improve the curb appeal and interior condition, making the property more attractive to potential buyers and renters.
- Both Landscaping and fence repair — Landscaping and fence repair can improve the curb appeal and make the property more attractive to potential buyers and renters.
- Both HVAC maintenance — Maintaining the HVAC system can improve the comfort and energy efficiency of the property, making it more attractive to potential buyers and renters.
Renovation cost estimate screening
| Repair item | Severity | Est. cost |
|---|---|---|
| fence · The fence is in poor condition and needs to be replaced or repaired. | Major | $15,000–50,000 |
| landscaping · The overgrown vegetation and poor landscaping need to be addressed. | Major | $15,000–50,000 |
| exterior siding · The siding shows signs of aging and potential damage, which needs to be addressed. | Major | $15,000–50,000 |
| Total estimated repair cost · 3 items | $45,000–150,000 |
Value-add ROI direction
- Both Painting the exterior and interior walls — Painting the exterior and interior walls can improve the curb appeal and interior condition, making the property more attractive to potential buyers and renters. ↑
- Both Landscaping and fence repair — Landscaping and fence repair can improve the curb appeal and make the property more attractive to potential buyers and renters. ↑
- Both HVAC maintenance — Maintaining the HVAC system can improve the comfort and energy efficiency of the property, making it more attractive to potential buyers and renters. ↑
ⓘ Cost ranges are severity-bucket heuristics (US national rule-of-thumb). Get contractor quotes + a written scope before underwriting a rehab budget.
Schools (NCES district)
- District
- Orleans Parish
- NCES district ID
- 2201170
- Math proficiency
- 11% ▼ -52.00%
- Reading proficiency
- 27% ▼ -46.00%
- Median HH income
- $37,011
- Composite
- 15.78/100
- National rank
- #9271
- State rank
- #69 of 98 in LA
Livability — New Orleans
- Score
- 81/100
- State rank
- #3
- US rank
- #1383
Category grades
Schools grade is shown separately in the Schools card above.
Census & demographics
- Census place
- New Orleans, LA
- County
- Orleans Parish · 338,817 people
- City population
- 338,817
- Metro
- New Orleans-Metairie, LA
- Population (ZIP)
- 25,652
- Household income
- $45,764
- Rent vs Own
- Severe rent burden
- 1988.0
Population outlook (Orleans County) Hauer SSP2
- Today (2025)
- 513,025 people
- By 2030
- 575,781 · +12.2%
- By 2040
- 700,174 · +36.5%
- By 2050
- 826,541 · +61.1%
- By 2075
- 1,123,374 · +119.0%
- By 2100
- 1,355,609 · +164.2%
Race, ethnicity, and origin ACS 2023
- Neighborhood character
- Majority Black (60%)
- Race & ethnicity
- Black 60% White 30% Two or more races 6% Hispanic / Latino 5%
- Common ancestry
- Lithuanian 5% Italian 1% Romanian 1%
- Foreign-born
- 5% · Canada, South Korea
- Languages at home
- 93% English-only · Spanish 3% Other Indo-European 1% French/Haitian/Cajun 1%
Political lean MEDSL · Orleans
- 2024 margin
- Solid D (+67.0) · D 82.2% · R 15.2% · Other 2.7%
- 2008→2024 swing
- +6.7pp toward D · 2008: 60.3pp · 2024: 67.0pp
- All cycles
- 2024: D+67.0 2020: D+68.2 2016: D+66.2 2012: D+62.5 2008: D+60.3
Not yet ingested
- Civics
- —
Market trends
- HPI YoY
- ▼ -177.22%
- Current HPI
- 184.6061
- Rent YoY
- ▲ 2.49%
- Metro
- New Orleans-Metairie, LA
- State GDP YoY
- ▲ 3.29%
- F500 in state
- 10
Industry mix (Fortune 500 HQ in LA)
| Industry | F500 HQs | Revenue |
|---|---|---|
| Telecommunications | 2 | $23B |
|
||
| Utilities | 1 | $12B |
|
||
| Wholesale / Distribution | 1 | $5B |
|
||
| Advertising | 1 | $2B |
|
||
Price history
+5.8% since first listed10 events — show timeline
- 2026-05-26 Listed $200,000 GSREIN
- 2026-05-26 Listed $200,000 AcadianaMLS
- 2025-08-03 Rental Removed $1,050 GSREIN
- 2025-08-01 Listed for Rent $1,050 GSREIN
- 2025-07-02 Rental Removed $1,050 GSREIN
- 2025-03-24 Listed for Rent $1,050 GSREIN
- 2022-09-14 Listed $194,050 AcadianaMLS
- 2022-01-25 Listed $199,500 AcadianaMLS
- 2021-01-07 Listed $205,000 AcadianaMLS
- 2019-03-29 Listed $189,000 AcadianaMLS
Cash-flow waterfall
monthlySold comps — $/sqft
last 12 mo · ≤1 miLoading sold comps…