 🏗️ New Construction
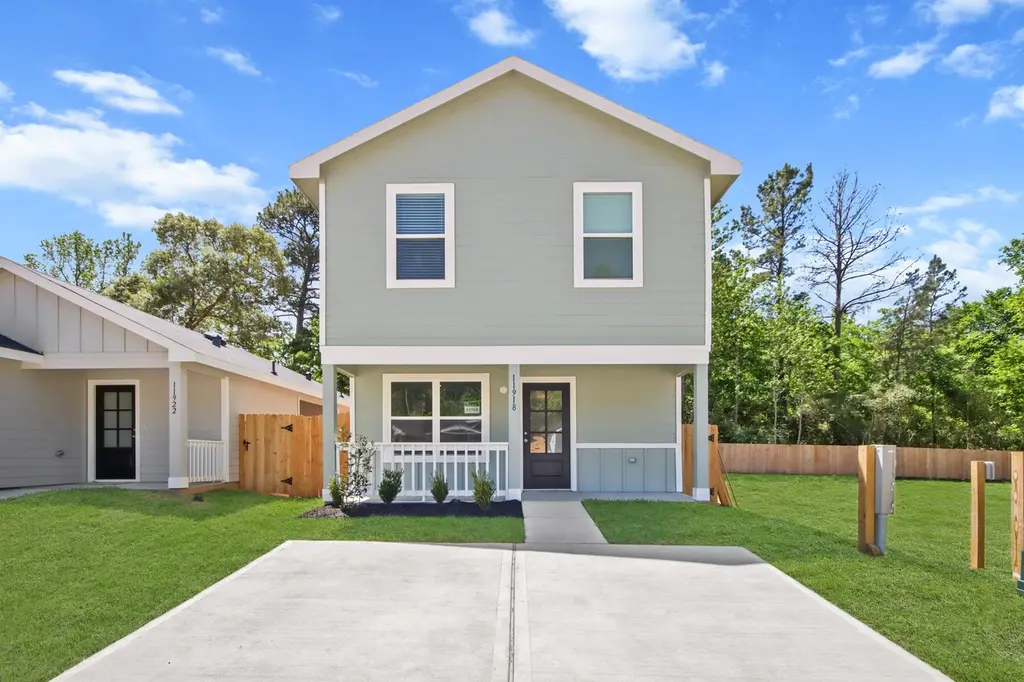
11918 Detar Ct · Willis, TX
Flood risk No data
- FEMA flood zone
- —
- Chance of flooding over 30 yrs
- —
- Est. flood insurance / yr
- —
Fire risk No data
- Est. fire insurance / yr
- —
Heat risk No data
- Hot days now (above threshold)
- —
- Hot days in 30 yrs
- —
Wind risk No data
- Chance of severe wind over 30 yrs
- —
Air-quality risk No data
- Unhealthy air days now
- —
- Unhealthy air days in 30 yrs
- —
Risk factors via First Street. Map © Google.
Why this score? — see what drove the C- grade
The composite is a weighted blend of 9 inputs, each scored 0–100. Each bar is that input's sub-score; the figure is the points it added to the 100-point composite (weight × sub-score).
- Cash flow +18.4/30.0
- ARV discount +7.5/15.0
- DSCR +5.8/10.0
- 1% rule +5.2/10.0
- Condition / age +5.0/5.0
- Schools +3.2/10.0
- Livability +3.1/5.0
- Rent growth +2.7/5.0
- Appreciation +0.9/10.0
$169,990
🖨 Deal sheet 📄 Offer letter ✓ Due diligence
Listing remarks
FANTASTIC NEW D. R. HORTON BUILT 2 STORY IN WILLIAM TRAILS! WONDERFUL LOCATION ON CUL DE SAC WITH NO BACK NEIGHBORS! Charming Elevation with Covered Front Porch! Large Living Area is Open to Fantastic Kitchen with Granite Counters and Stainless Appliances! Primary Suite Located on the Second Floor Features Beautiful Bathroom & Walk-In Closet! Generously Sized Secondary Bedrooms! Convenient Utility Room! Great Community with Pickleball Court, Playground, & Walking Trails! Zoned to Willis ISD! Hurry and Call Today! Move In Ready!
Key facts
- Covered front porch
- Cul de sac
- Stainless appliances
Tags
Property features AI
Finance
- Other: Municipal Utility District disclosure
- HOA & community: Community association managed by Inframark; Annual association fee of $500
Exterior
- Security: Smoke detector(s)
- Utilities: Public water; Public sewer
- Home design: Residential property; New construction; Slab foundation
- Construction: Built in 2026; Cement siding; Composition roof; New construction by D.R. Horton
- Exterior features: Porch; Private yard; Located in a cul-de-sac; Subdivision setting
Interior
- Kitchen: Breakfast bar; Kitchen island; Pantry; Kitchen/dining combo; Kitchen/family room combo
- Bedrooms: Primary bedroom (Second level); Bedroom (Second level); Bedroom (Second level)
- Flooring: Carpet; Plank flooring; Vinyl flooring
- Bathrooms: 2 full bathrooms; 1 half bathroom
- Heating & cooling: Central heating (electric); Central air conditioning (electric)
- Interior features: Breakfast bar; Kitchen island; Kitchen/family room combo; Pantry; Kitchen/dining combo; Living/dining room; Programmable thermostat; Bath in primary bedroom; Low emissivity windows
Neighborhood map
What this means for you Summary
Snapshot
- This is a 3-bed/2.5-bath single-family listed at $170k. Condition is rated excellent.
Deal economics
- At list price, monthly cash flow is $167 ($2k/yr) — positive.
- The deal already cash-flows at list — no discount required.
- Meets the 1% rule at list price ($2k rent vs $170k).
- Cap rate 7.4% vs local median 4.7% in Willis — top-decile yield for the area; either an underpriced asset or a hidden risk that comps aren't pricing in. Stress-test before assuming the spread holds.
Location & tenants
- Location reads 62/100 on livability (#933 in TX) — a middle-class / working-renter tenant base. Strengths: cost of living A+, housing A+; Watch: crime C-, employment D+, amenities F.
- Willis ISD (rural): math 33% / reading 40% proficiency, ranked #458 of 826 in TX (top 55%) — families likely to look elsewhere, expect single-tenant / working-renter base with shorter leases.
- Zoned schools: Edward B Cannan El (math 34% / reading 32%, grade F, #2,208 of 4,322 statewide, top 52%, 672 students, 74% FRL); Lynn Lucas Middle (math 23% / reading 32%, grade F, #1,156 of 1,662 statewide, top 71%, 971 students, 74% FRL); Willis H S (math 19% / reading 46%, grade F, #1,029 of 1,632 statewide, top 64%, 2,521 students, 57% FRL).
- Market conditions: Rents flat; 710 active listings in the ZIP; 13,259 units permitted in Montgomery County in 2024 (1,402 in 5+ unit buildings).
- This rent runs 31% of the median local income ($71k/yr) — at the standard rent-burdened threshold; future hikes will face affordability resistance.
Forward outlook
- Local home prices are declining (-3.0%/yr); year-one equity from $1k of loan paydown is wiped out by about $5k of value loss. Plan a longer hold.
- Montgomery County population projected at +65% by 2050 — long-run rental-demand tailwind backs the buy-and-hold thesis.
Negotiation context
- Only 14 days on market — expect competitive offers; lowballing is unlikely to land.
- 3 sale attempts; this cycle's ask has dropped $28k (14%) from the opening price — seller is motivated, your offer sets the floor, not the list.
Questions for the listing agent
- What does the HOA fee cover, when was the last increase, and are there any pending special assessments or reserve-fund shortfalls?
- Is there a deadline driving the sale (1031 exchange, divorce, estate, relocation)? That informs how much negotiation room exists.
- Schools are D-rated, which usually means shorter tenancies and higher turnover. Who's the typical renter profile here, and what's been the actual vacancy rate?
- What's the average days-on-market for RENTAL listings here right now (not sales)? A rising rental-DOM trend means longer vacancies and softer asking-rent achievability than the comps imply.
- What's the recent tenant-quality profile in this submarket — average credit score on applications, eviction rate, late-payment / NSF rate, and stable-employment percentage? A property-management company in the area should have these aggregated.
- How much new for-sale + rental construction is in the pipeline within 1–3 miles? Heavy new supply typically softens prices + rents 12–24 months out; constrained supply supports both.
Investment metrics
- 1% rule
- 1.02% ✓
- Cap rate
- 7.42%
- Cash-on-cash
- 4.02%
- DSCR
- 1.18
- GRM
- 8.1
CMA / ARV
- ARV (on-the-fly)
- $178,488
- Comps found
- 12
Show comp detail 12 sales within ~0.75 mi
| Address | Dist | Beds/Ba | Sqft | Sold | Price | $/sf | Match |
|---|---|---|---|---|---|---|---|
| 14570 William Trails Dr | 0.09mi | 3/2.5 | 1,206 (0%) | 2mo | $174,990 | $145 | 94 |
| 14554 William Trails Dr | 0.07mi | 3/2.5 | 1,206 (0%) | 7mo | $178,990 | $148 | 91 |
| 11822 Holly Hurst Dr | 0.17mi | 3/2.5 | 1,206 (0%) | 1mo | $173,990 | $144 | 91 |
| 14586 William Trails Dr | 0.12mi | 3/2.5 | 1,206 (0%) | 7mo | $178,990 | $148 | 89 |
| 14602 William Trails Dr | 0.14mi | 3/2.5 | 1,206 (0%) | 7mo | $178,990 | $148 | 88 |
| 11806 Holly Hurst Dr | 0.19mi | 3/2.5 | 1,206 (0%) | 5mo | $169,990 | $141 | 87 |
| 11818 Holly Hurst Dr | 0.18mi | 3/2.5 | 1,206 (0%) | 8mo | $169,990 | $141 | 86 |
| 11826 Holly Hurst Dr | 0.17mi | 3/2.5 | 1,206 (0%) | 9mo | $169,990 | $141 | 85 |
| 12018 William Trails Cir | 0.19mi | 3/2.5 | 1,206 (0%) | 8mo | $185,000 | $153 | 85 |
| 14619 William Trails Dr | 0.17mi | 3/2.5 | 1,206 (0%) | 9mo | $183,990 | $153 | 84 |
| 14603 William Trails Dr | 0.15mi | 3/2.5 | 1,206 (0%) | 11mo | $182,890 | $152 | 84 |
| 12011 William Trails Cir | 0.23mi | 3/2.5 | 1,206 (0%) | 9mo | $174,990 | $145 | 82 |
Match score weights: distance 35% · size 25% · config 20% · recency 20%. Top-matched comps best support the ARV.
Projected returns pro-forma
-3.0% appreciation · 0.98% rent growth · sell at horizon
- IRR
- -12.3%
- Equity multiple
- 0.56×
- Total profit
- $-21,848
- Equity at exit
- $26,613
- IRR
- -6.7%
- Equity multiple
- 0.61×
- Total profit
- $-19,419
- Equity at exit
- $15,432
Cash invested: $49,977 (down + closing). Projections, not guarantees.
Landlord ↔ Tenant lean methodology
- Overall (STATE)
- 87 Strongly Landlord-Friendly
- State Texas
- 87 Strongly Landlord-Friendly · R+5
- County
- — inherits STATE
- City
- — inherits STATE
ZIP-level market 77378
- Home prices YoY
- -3.0%
- Rents YoY
- 1.0%
- Active inventory
- 710
- Price-to-rent
- 7.8×
Monthly cashflow live
- Estimated rent
- $1,826 medium interval (Pro) →
- Mortgage (P&I)
- −$936
- Tax est. 1.5%
- −$223 /mo · $2,677/yr
- Insurance
- −$74
- HOA
- −$42
- Vacancy / Maint / Mgmt
- −$384
- Net cashflow
- $167
Break-even live
UW: 25.0% down · 7.5% · 30yr · 1.5% tax · 5.0% vac · 8.0% maint · 8.0% mgmt
Financing live
Cash to close
- Down payment
- $44,622
- Closing costs
- $5,355
- Reserves months
- —
- Total cash needed
- —
Loan-product check · same deal, 3 products live
Conventional
25% down · 7.5% · 30yr
- Down + closing
- —
- Monthly P&I
- —
- Monthly cashflow
- —
- DSCR
- —
- Eligible?
- —
Personal DTI + credit; lowest rate.
DSCR
20% down · 8.5% · 30yr
- Down + closing
- —
- Monthly P&I
- —
- Monthly cashflow
- —
- DSCR
- —
- Eligible?
- —
No personal income docs; deal must DSCR.
Hard money
10% down · 12.0% · 12mo
- Down + closing
- —
- Monthly P&I
- —
- Monthly cashflow
- —
- DSCR
- —
- Eligible?
- —
Short-term bridge; refi at stabilization.
HOA detail
- Monthly dues
- $42 · $504/yr
Listing history 14 events
-
2026-06-10price $169,990 Active 14 DOM
-
2026-06-09days on market $197,708 Active 14 DOM
-
2026-06-08days on market $197,708 Active 13 DOM
-
2026-06-07days on market $197,708 Active 12 DOM
-
2026-06-04days on market $197,708 Active 9 DOM
-
2026-06-03days on market $197,708 Active 8 DOM
-
2026-06-02days on market $197,708 Active 7 DOM
-
2026-06-01days on market $197,708 Active 6 DOM
-
2026-05-31days on market $197,708 Active 5 DOM
-
2026-05-26$197,708 Active
-
2026-04-01historical
-
2026-03-26status Active
-
2026-02-20historical Active Under Contract
-
2026-02-19$189,990 Active
ⓘ Source: listings_history table (triggers on properties + properties_extension) + one-shot
backfill from property_details.listing_events for pre-trigger history.
Nearby sold comps map
Loading sold comps map…
Walkable amenities ~0.75 mi
Loading nearby amenities…
Taxation est. · year 1
- Rental income
- $21,917
- − Mortgage interest
- −$9,998
- − Property taxes
- −$2,677
- − Insurance
- −$892
- − Repairs & maintenance
- −$1,753
- − Management
- −$1,753
- − HOA
- −$504
- − Depreciation
- −$5,192
- Taxable loss
- −$854
- Est. tax savings @ 24.0%
- +$205
- After-tax cash flow
- $2,214/yr
For passive investors: Depreciation is non-cash, so a rental often shows a tax loss while cash-flowing — sheltering income. Rental losses are passive: they offset passive income freely, and up to $25,000/yr can offset ordinary (W-2) income if you actively participate and your MAGI is under $100k (phasing out to $0 by $150k); unused losses carry forward. On sale, claimed depreciation is recaptured at up to 25%, and gains may owe capital-gains tax (a 1031 exchange can defer both). Figures are a year-1 estimate at your 24.0% rate — not tax advice; consult a CPA.
Condition & rehab AI · 5 photos
This move-in ready home in Willis, TX, features a modern kitchen, well-maintained bathrooms, and a clean exterior. It's located on a cul-de-sac with no back neighbors, making it a great investment opportunity.
Value-add opportunities
- Both Painting the exterior and interior walls — Fresh paint can enhance curb appeal and interior aesthetics.
- Both Landscaping improvements — Enhanced landscaping can improve curb appeal and attract potential buyers/tenants.
- Both Adding smart home features — Smart home features can increase the home's appeal and market value.
- Both Upgrading the kitchen appliances — Upgrading to more modern or energy-efficient appliances can increase the home's value and attract more buyers/tenants.
Renovation cost estimate screening
Value-add ROI direction
- Both Painting the exterior and interior walls — Fresh paint can enhance curb appeal and interior aesthetics. ↑
- Both Landscaping improvements — Enhanced landscaping can improve curb appeal and attract potential buyers/tenants. ↑
- Both Adding smart home features — Smart home features can increase the home's appeal and market value. ↑
- Both Upgrading the kitchen appliances — Upgrading to more modern or energy-efficient appliances can increase the home's value and attract more buyers/tenants. ↑
ⓘ Cost ranges are severity-bucket heuristics (US national rule-of-thumb). Get contractor quotes + a written scope before underwriting a rehab budget.
Schools (NCES district)
- District
- Willis ISD
- NCES district ID
- 4845900
- Math proficiency
- 33% ▼ -15.00%
- Reading proficiency
- 40% ▼ -2.00%
- Median HH income
- $57,828
- Composite
- 32.32/100
- National rank
- #5746
- State rank
- #458 of 826 in TX
Livability — Willis
- Score
- 62/100
- State rank
- #933
- US rank
- #16579
Category grades
Schools grade is shown separately in the Schools card above.
Census & demographics
- County
- Montgomery County · 663,713 people
- City population
- 38,421
- Metro
- Houston-The Woodlands-Sugar Land, TX
- Population (ZIP)
- 17,629
- Household income
- $71,143
- Rent vs Own
- Severe rent burden
- 402.0
Population outlook (Montgomery County) Hauer SSP2
- Today (2025)
- 713,896 people
- By 2030
- 805,263 · +12.8%
- By 2040
- 992,708 · +39.1%
- By 2050
- 1,179,590 · +65.2%
- By 2075
- 1,628,084 · +128.1%
- By 2100
- 1,937,880 · +171.5%
Race, ethnicity, and origin ACS 2023
- Neighborhood character
- Diverse neighborhood (Simpson 0.55)
- Race & ethnicity
- White 58% Hispanic / Latino 32% Two or more races 14% Black 7% Native American 1%
- Hispanic origin (detail)
- Mexican 27%
- Common ancestry
- Romanian 2% Slovak 2% Serbian 1%
- Foreign-born
- 12% · Canada
- Languages at home
- 80% English-only · Spanish 19%
Political lean MEDSL · Montgomery
- 2024 margin
- Solid R (+45.5) · D 26.8% · R 72.3%
- 2008→2024 swing
- +7.2pp toward D · 2008: -52.7pp · 2024: -45.5pp
- All cycles
- 2024: R+45.5 2020: R+43.8 2016: R+51.4 2012: R+60.7 2008: R+52.7
Not yet ingested
- Civics
- —
Market trends
- HPI YoY
- ▼ -8.25%
- Current HPI
- 261.9673
- Rent YoY
- ▲ 0.98%
- Metro
- Houston-The Woodlands-Sugar Land, TX
- State GDP YoY
- ▲ 3.95%
- F500 in state
- 110
Industry mix (Fortune 500 HQ in TX)
| Industry | F500 HQs | Revenue |
|---|---|---|
| Energy | 16 | $1,198B |
|
||
| Technology | 5 | $198B |
|
||
| Engineering / Construction | 4 | $72B |
|
||
| Energy Services | 3 | $60B |
|
||
| Utilities | 3 | $41B |
|
||
| Healthcare | 2 | $330B |
|
||
Price history
+4.1% since first listed5 events — show timeline
- 2026-05-26 Listed $197,708 HARMLS
- 2026-04-01 Listing Removed — HARMLS
- 2026-03-26 Relisted — HARMLS
- 2026-02-20 Contingent — HARMLS
- 2026-02-19 Listed $189,990 HARMLS
Cash-flow waterfall
monthlySold comps — $/sqft
last 12 mo · ≤1 miLoading sold comps…