106 Boulevard St · Belview, MN
Flood risk No data
- FEMA flood zone
- —
- Chance of flooding over 30 yrs
- —
- Est. flood insurance / yr
- —
Fire risk No data
- Est. fire insurance / yr
- —
Heat risk No data
- Hot days now (above threshold)
- —
- Hot days in 30 yrs
- —
Wind risk No data
- Chance of severe wind over 30 yrs
- —
Air-quality risk No data
- Unhealthy air days now
- —
- Unhealthy air days in 30 yrs
- —
Risk factors via First Street. Map © Google.
Why this score? — see what drove the C grade
The composite is a weighted blend of 9 inputs, each scored 0–100. Each bar is that input's sub-score; the figure is the points it added to the 100-point composite (weight × sub-score).
- Cash flow +20.5/30.0
- ARV discount +7.5/15.0
- DSCR +6.5/10.0
- 1% rule +5.4/10.0
- Appreciation +5.0/10.0
- Schools +3.6/10.0
- Livability +3.1/5.0
- Rent growth +2.5/5.0
- Condition / age +2.5/5.0
$124,900
🖨 Deal sheet 📄 Offer letter ✓ Due diligence
Listing remarks
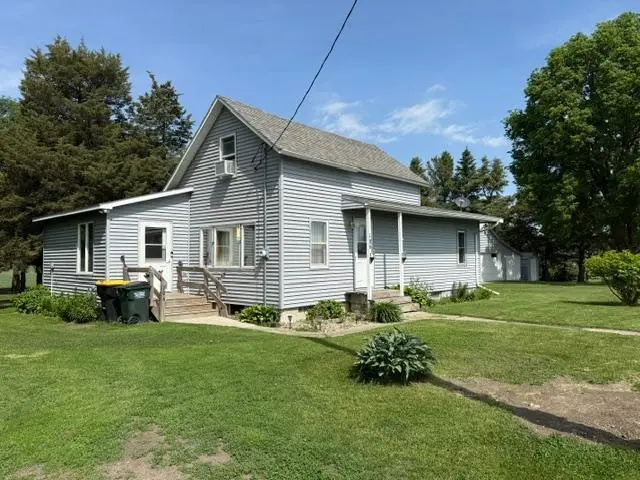
Enjoy quiet country living on the edge of Belview with this charming 4 bedroom, 2 bath home situated on a nearly 1-acre private lot. Inside, you’ll find a spacious layout featuring a large kitchen perfect for gathering and entertaining. Major updates including siding, furnace, and central air provide peace of mind for years to come. The private setting offers plenty of space to relax and enjoy the outdoors, along with a 2+ car detached garage for extra storage and convenience. A great opportunity to enjoy small-town living with a country feel!
Key facts
- Private lot
- Country living
- Large kitchen
Tags
Property features AI
Finance
- Other: Lot approximately 0.49 acres (dimensions 271 x 150)
Exterior
- Parking: Detached or attached 2-car garage with 20 x 24 dimensions
- Utilities: City water (connected); City sewer (connected); Natural gas fuel; Electric service with circuit breakers
- Home design: Residential property; One-and-a-half story; Above-grade finished living area of 1,433 (total living area listed separately)
- Construction: Frame construction; Asphalt roof; Block foundation; Built area includes 1,433 above grade and 1,140 below grade
- Exterior features: Patio; Vinyl exterior; Corner lot; City street frontage; Public maintained road
Interior
- Kitchen: Range; Microwave; Refrigerator; Electric water heater
- Bedrooms: Four bedrooms (some on upper level and main level)
- Bathrooms: One full bath (main floor); One half bath (basement)
- Heating & cooling: Forced-air heating; Central air conditioning
- Interior features: Formal separate dining room; Main-floor bedroom; Main-floor laundry; Basement with block foundation
- Laundry & utility: Washer; Dryer; Main-level laundry
Neighborhood map
What this means for you Summary
Snapshot
- This is a 4-bed/2.0-bath single-family listed at $125k.
Deal economics
- At list price, monthly cash flow is $164 ($2k/yr) — positive.
- The deal already cash-flows at list — no discount required.
- Meets the 1% rule at list price ($1k rent vs $125k).
- Recommended offer: $123k (1.5% below list) — sets the bar for market timing.
Location & tenants
- Location reads 62/100 on livability (#672 in MN) — a middle-class / working-renter tenant base. Strengths: cost of living A+, housing A+; Watch: health & safety D+, crime D, schools F.
- Redwood Area School District (town): math 39% / reading 46% proficiency, ranked #207 of 301 in MN (top 69%) — families likely to look elsewhere, expect single-tenant / working-renter base with shorter leases.
- Market conditions: 2 active listings in the ZIP; 25 units permitted in Redwood County in 2024 (0 in 5+ unit buildings).
Forward outlook
- In year one you build about $5k of equity ($864 loan paydown + $4k appreciation (3.0% local appreciation)).
- Redwood County population projected at -16% by 2050 — secular population decline; favor cash flow + early exit over multi-decade hold.
- At projected returns (3.0% appreciation + 3.0% rent growth), your $35k cash investment doubles in ~5 years — after that, you're playing with house money.
- By year 8, paydown + projected appreciation supports a ~$34k cash-out refi (75% LTV) — recoverable capital for the next deal without selling this one.
Negotiation context
- It's been on market 20 days — a 2% lower offer ($123k) is reasonable based on typical stale-listing flexibility.
Risks & watch-outs
- Watch-outs: built in 1900 — expect roof / HVAC / electrical / plumbing capex.
Questions for the listing agent
- Built in 1900 — when were the roof, HVAC, electrical panel, plumbing, and water heater last replaced?
- Is there a deadline driving the sale (1031 exchange, divorce, estate, relocation)? That informs how much negotiation room exists.
- Schools are F-rated, which usually means shorter tenancies and higher turnover. Who's the typical renter profile here, and what's been the actual vacancy rate?
- Crime grade is D in this area — have there been break-ins, vandalism, or insurance claims at this property in the last 3 years? What carrier currently insures it and at what premium?
- What's the average days-on-market for RENTAL listings here right now (not sales)? A rising rental-DOM trend means longer vacancies and softer asking-rent achievability than the comps imply.
- What's the recent tenant-quality profile in this submarket — average credit score on applications, eviction rate, late-payment / NSF rate, and stable-employment percentage? A property-management company in the area should have these aggregated.
- How much new for-sale + rental construction is in the pipeline within 1–3 miles? Heavy new supply typically softens prices + rents 12–24 months out; constrained supply supports both.
Investment metrics
- 1% rule
- 1.04% ✓
- Cap rate
- 7.87%
- Cash-on-cash
- 5.64%
- DSCR
- 1.25
- GRM
- 8.0
CMA / ARV
No comps found within radius.
Projected returns pro-forma
3.0% appreciation · 3.0% rent growth · sell at horizon
- IRR
- 12.8%
- Equity multiple
- 1.73×
- Total profit
- $25,529
- Equity at exit
- $56,160
- IRR
- 14.8%
- Equity multiple
- 3.18×
- Total profit
- $76,264
- Equity at exit
- $86,550
Cash invested: $34,972 (down + closing). Projections, not guarantees.
Landlord ↔ Tenant lean methodology
- Overall (STATE)
- 46 Balanced
- State Minnesota
- 46 Balanced · D+2
- County
- — inherits STATE
- City
- — inherits STATE
ZIP-level market 56214
- Active inventory
- 2
- Price-to-rent
- 8.0×
Monthly cashflow live
- Estimated rent
- $1,301 medium interval (Pro) →
- Mortgage (P&I)
- −$655
- Tax est. 1.5%
- −$156 /mo · $1,874/yr
- Insurance
- −$52
- HOA
- −$0
- Vacancy / Maint / Mgmt
- −$273
- Net cashflow
- $164
Break-even live
UW: 25.0% down · 7.5% · 30yr · 1.5% tax · 5.0% vac · 8.0% maint · 8.0% mgmt
Financing live
Cash to close
- Down payment
- $31,225
- Closing costs
- $3,747
- Reserves months
- —
- Total cash needed
- —
Loan-product check · same deal, 3 products live
Conventional
25% down · 7.5% · 30yr
- Down + closing
- —
- Monthly P&I
- —
- Monthly cashflow
- —
- DSCR
- —
- Eligible?
- —
Personal DTI + credit; lowest rate.
DSCR
20% down · 8.5% · 30yr
- Down + closing
- —
- Monthly P&I
- —
- Monthly cashflow
- —
- DSCR
- —
- Eligible?
- —
No personal income docs; deal must DSCR.
Hard money
10% down · 12.0% · 12mo
- Down + closing
- —
- Monthly P&I
- —
- Monthly cashflow
- —
- DSCR
- —
- Eligible?
- —
Short-term bridge; refi at stabilization.
Listing history 15 events
-
2026-06-18days on market $124,900 Active 20 DOM
-
2026-06-17days on market $124,900 Active 19 DOM
-
2026-06-16days on market $124,900 Active 18 DOM
-
2026-06-15days on market $124,900 Active 17 DOM
-
2026-06-13days on market $124,900 Active 15 DOM
-
2026-06-12days on market $124,900 Active 14 DOM
-
2026-06-09days on market $124,900 Active 11 DOM
-
2026-06-08days on market $124,900 Active 10 DOM
-
2026-06-07days on market $124,900 Active 9 DOM
-
2026-06-05days on market $124,900 Active 7 DOM
-
2026-06-04days on market $124,900 Active 5 DOM
-
2026-06-02days on market $124,900 Active 4 DOM
-
2026-06-01days on market $124,900 Active 3 DOM
-
2026-05-31days on market $124,900 Active 2 DOM
-
2026-05-29$124,900 Active
ⓘ Source: listings_history table (triggers on properties + properties_extension) + one-shot
backfill from property_details.listing_events for pre-trigger history.
Nearby sold comps map
Loading sold comps map…
Walkable amenities ~0.75 mi
Loading nearby amenities…
Taxation est. · year 1
- Rental income
- $15,607
- − Mortgage interest
- −$6,996
- − Property taxes
- −$1,874
- − Insurance
- −$624
- − Repairs & maintenance
- −$1,249
- − Management
- −$1,249
- − Depreciation
- −$3,633
- Taxable loss
- −$18
- Est. tax savings @ 24.0%
- +$4
- After-tax cash flow
- $1,976/yr
For passive investors: Depreciation is non-cash, so a rental often shows a tax loss while cash-flowing — sheltering income. Rental losses are passive: they offset passive income freely, and up to $25,000/yr can offset ordinary (W-2) income if you actively participate and your MAGI is under $100k (phasing out to $0 by $150k); unused losses carry forward. On sale, claimed depreciation is recaptured at up to 25%, and gains may owe capital-gains tax (a 1031 exchange can defer both). Figures are a year-1 estimate at your 24.0% rate — not tax advice; consult a CPA.
Schools (NCES district)
- District
- Redwood Area School District
- NCES district ID
- 2700182
- Math proficiency
- 39% ▼ -14.00%
- Reading proficiency
- 46% ▼ -12.00%
- Median HH income
- $45,326
- Composite
- 36.1/100
- National rank
- #4756
- State rank
- #207 of 301 in MN
Livability — Belview
- Score
- 62/100
- State rank
- #672
- US rank
- #16274
Category grades
Schools grade is shown separately in the Schools card above.
Census & demographics
- Census place
- Belview, MN
- City population
- 714
- Population (ZIP)
- 714
Population outlook (Redwood County) Hauer SSP2
- Today (2025)
- 14,504 people
- By 2030
- 13,983 · -3.6%
- By 2040
- 13,056 · -10.0%
- By 2050
- 12,225 · -15.7%
- By 2075
- 11,051 · -23.8%
- By 2100
- 9,786 · -32.5%
Race, ethnicity, and origin ACS 2023
- Neighborhood character
- Predominantly White (89%)
- Race & ethnicity
- White 89% Hispanic / Latino 8% Two or more races 4%
- Hispanic origin (detail)
- Mexican 8%
- Common ancestry
- Portuguese 33% Romanian 3% Lithuanian 1%
- Foreign-born
- 1% · Canada, Vietnam
- Languages at home
- 96% English-only · Spanish 3%
Political lean MEDSL · Redwood
- 2024 margin
- Solid R (+43.3) · D 27.7% · R 71.0% · Other 1.2%
- 2008→2024 swing
- -29.8pp toward R · 2008: -13.6pp · 2024: -43.3pp
- All cycles
- 2024: R+43.3 2020: R+41.2 2016: R+43.0 2012: R+20.1 2008: R+13.6
Not yet ingested
- Civics
- —
Market trends
- HPI YoY
- —
- Current HPI
- —
- Rent YoY
- —
- Metro
- —
- State GDP YoY
- ▲ 2.41%
- F500 in state
- 34
Industry mix (Fortune 500 HQ in MN)
| Industry | F500 HQs | Revenue |
|---|---|---|
| Healthcare | 2 | $407B |
|
||
| Retail | 2 | $150B |
|
||
| Consumer Goods | 2 | $32B |
|
||
| Industrial Machinery | 2 | $6B |
|
||
| Agriculture | 1 | $40B |
|
||
| Healthcare / Medical Devices | 1 | $32B |
|
||
Price history
1 event — show timeline
- 2026-05-29 Listed $124,900 NORTHSTARMLS as Distributed by MLS Grid
Property tax history
-15.1%/yrLatest (2025): $68 · +0.0% YoY. Source: county tax records.
Cash-flow waterfall
monthlySold comps — $/sqft
last 12 mo · ≤1 miLoading sold comps…