 🏷️ Likely Rental
235 Greenwood Ave · Lepanto, AR
Flood risk No data
- FEMA flood zone
- —
- Chance of flooding over 30 yrs
- —
- Est. flood insurance / yr
- —
Fire risk No data
- Est. fire insurance / yr
- —
Heat risk No data
- Hot days now (above threshold)
- —
- Hot days in 30 yrs
- —
Wind risk No data
- Chance of severe wind over 30 yrs
- —
Air-quality risk No data
- Unhealthy air days now
- —
- Unhealthy air days in 30 yrs
- —
Risk factors via First Street. Map © Google.
Why this score? — see what drove the B grade
The composite is a weighted blend of 9 inputs, each scored 0–100. Each bar is that input's sub-score; the figure is the points it added to the 100-point composite (weight × sub-score).
- Cash flow +30.0/30.0
- 1% rule +10.0/10.0
- DSCR +10.0/10.0
- ARV discount +7.5/15.0
- Appreciation +4.0/10.0
- Livability +3.3/5.0
- Schools +3.0/10.0
- Rent growth +2.5/5.0
- Condition / age +2.2/5.0
$75,000
🖨 Deal sheet 📄 Offer letter ✓ Due diligence
Listing remarks MLS
Check out this awesome home. Storefront building in downtown Lepanto AR. 1800 SQ FT OF totally rebuilt home. Currently this building is rented for $900 per month. Tenant can stay or go. Don't miss out a lot of sq ft for inexpensive price.
Key facts
- 2,614 sq ft lot
- Built 1964
- Listed 150 days
Neighborhood map
What this means for you Summary
Snapshot
- This is a 3-bed/2.0-bath single-family listed at $75k. Condition is rated fair.
Deal economics
- At list price, monthly cash flow is $442 ($5k/yr) — positive.
- The deal already cash-flows at list — no discount required.
- Meets the 1% rule at list price ($1k rent vs $75k).
- Recommended offer: $66k (12.0% below list) — sets the bar for market timing.
Location & tenants
- Location reads 66/100 on livability (#133 in AR) — a middle-class / working-renter tenant base. Strengths: cost of living A+, health & safety A+, housing B+; Watch: schools D-, crime D-, amenities F.
- East Poinsett County School District (rural): math 36% / reading 37% proficiency, ranked #113 of 238 in AR (top 48%) — families likely to look elsewhere, expect single-tenant / working-renter base with shorter leases.
- Market conditions: 9 active listings in the ZIP; 67 units permitted in Poinsett County in 2024 (5 in 5+ unit buildings).
Forward outlook
- Local home prices are declining (-2.0%/yr); year-one equity from $519 of loan paydown is wiped out by about $2k of value loss. Plan a longer hold.
- Poinsett County population projected at -13% by 2050 — secular population decline; favor cash flow + early exit over multi-decade hold.
- At projected returns (-2.0% appreciation + 3.0% rent growth), your $21k cash investment doubles in ~5 years — after that, you're playing with house money.
Negotiation context
- It's been on market 151 days — a 12% lower offer ($66k) is reasonable based on typical stale-listing flexibility.
Questions for the listing agent
- It's been on market 151 days. Have you received any prior offers? Is the seller open to a 12% concession, seller financing, or rate buy-down credit?
- Have any recent inspections been done? Can we get a copy of the seller's disclosures and any deferred-maintenance estimates?
- Built in 1964 — when were the roof, HVAC, electrical panel, plumbing, and water heater last replaced?
- Why hasn't it sold? Are there any deal-killer items the seller is aware of (foundation, flood, title, zoning, code violations)?
- Is there a deadline driving the sale (1031 exchange, divorce, estate, relocation)? That informs how much negotiation room exists.
- Schools are D-rated, which usually means shorter tenancies and higher turnover. Who's the typical renter profile here, and what's been the actual vacancy rate?
- Crime grade is D in this area — have there been break-ins, vandalism, or insurance claims at this property in the last 3 years? What carrier currently insures it and at what premium?
- What's the average days-on-market for RENTAL listings here right now (not sales)? A rising rental-DOM trend means longer vacancies and softer asking-rent achievability than the comps imply.
- What's the recent tenant-quality profile in this submarket — average credit score on applications, eviction rate, late-payment / NSF rate, and stable-employment percentage? A property-management company in the area should have these aggregated.
- How much new for-sale + rental construction is in the pipeline within 1–3 miles? Heavy new supply typically softens prices + rents 12–24 months out; constrained supply supports both.
Investment metrics
- 1% rule
- 1.62% ✓
- Cap rate
- 13.36%
- Cash-on-cash
- 25.23%
- DSCR
- 2.12
- GRM
- 5.1
CMA / ARV
- ARV (median comp)
- $152,069
- List price
- $75,000
- Delta
- -50.68%
- Verdict
- UNDERPRICED
- Comps
- 15 within 1.0 mi
Show comp detail 3 sales within ~0.75 mi
| Address | Dist | Beds/Ba | Sqft | Sold | Price | $/sf | Match |
|---|---|---|---|---|---|---|---|
| 40515 J Martin Rd | 0.51mi | 3/2.0 | 1,920 (+4%) | 1mo | $252,999 | $132 | 68 |
| 121 Didemma | 0.14mi | 3/2.0 | 1,684 (-8%) | 23mo | $48,500 | $29 | 60 |
| 525 Julianne St | 0.51mi | 3/2.0 | 1,758 (-4%) | 11mo | $195,000 | $111 | 60 |
Match score weights: distance 35% · size 25% · config 20% · recency 20%. Top-matched comps best support the ARV.
Projected returns pro-forma
-2.02% appreciation · 3.0% rent growth · sell at horizon
- IRR
- 21.1%
- Equity multiple
- 1.91×
- Total profit
- $19,114
- Equity at exit
- $14,507
- IRR
- 27.8%
- Equity multiple
- 3.65×
- Total profit
- $55,716
- Equity at exit
- $12,341
Cash invested: $21,000 (down + closing). Projections, not guarantees.
Landlord ↔ Tenant lean methodology
- Overall (STATE)
- 92 Strongly Landlord-Friendly
- State Arkansas
- 92 Strongly Landlord-Friendly · R+14
- County
- — inherits STATE
- City
- — inherits STATE
ZIP-level market 72354
- Home prices YoY
- -1.1%
- Active inventory
- 9
- Price-to-rent
- 5.1×
Monthly cashflow live
- Estimated rent
- $1,215 medium interval (Pro) →
- Mortgage (P&I)
- −$393
- Tax est. 1.5%
- −$94 /mo · $1,125/yr
- Insurance
- −$31
- HOA
- −$0
- Vacancy / Maint / Mgmt
- −$255
- Net cashflow
- $442
Break-even live
UW: 25.0% down · 7.5% · 30yr · 1.5% tax · 5.0% vac · 8.0% maint · 8.0% mgmt
Financing live
Cash to close
- Down payment
- $18,750
- Closing costs
- $2,250
- Reserves months
- —
- Total cash needed
- —
Loan-product check · same deal, 3 products live
Conventional
25% down · 7.5% · 30yr
- Down + closing
- —
- Monthly P&I
- —
- Monthly cashflow
- —
- DSCR
- —
- Eligible?
- —
Personal DTI + credit; lowest rate.
DSCR
20% down · 8.5% · 30yr
- Down + closing
- —
- Monthly P&I
- —
- Monthly cashflow
- —
- DSCR
- —
- Eligible?
- —
No personal income docs; deal must DSCR.
Hard money
10% down · 12.0% · 12mo
- Down + closing
- —
- Monthly P&I
- —
- Monthly cashflow
- —
- DSCR
- —
- Eligible?
- —
Short-term bridge; refi at stabilization.
Listing history 17 events
-
2026-06-19days on market $75,000 Active 151 DOM
-
2026-06-18days on market $75,000 Active 150 DOM
-
2026-06-17days on market $75,000 Active 149 DOM
-
2026-06-16days on market $75,000 Active 148 DOM
-
2026-06-15days on market $75,000 Active 147 DOM
-
2026-06-14days on market $75,000 Active 145 DOM
-
2026-06-12days on market $75,000 Active 144 DOM
-
2026-06-09days on market $75,000 Active 141 DOM
-
2026-06-08days on market $75,000 Active 140 DOM
-
2026-06-07days on market $75,000 Active 139 DOM
-
2026-06-05days on market $75,000 Active 137 DOM
-
2026-06-04days on market $75,000 Active 135 DOM
-
2026-06-02days on market $75,000 Active 134 DOM
-
2026-06-01days on market $75,000 Active 133 DOM
-
2026-05-31days on market $75,000 Active 132 DOM
-
2026-05-31days on market $75,000 Active 131 DOM
-
2026-01-14$75,000 Active 238-char remark
Show marketing remark (238 chars)
Check out this awesome home. Storefront building in downtown Lepanto AR. 1800 SQ FT OF totally rebuilt home. Currently this building is rented for $900 per month. Tenant can stay or go. Don't miss out a lot of sq ft for inexpensive price.
ⓘ Source: listings_history table (triggers on properties + properties_extension) + one-shot
backfill from property_details.listing_events for pre-trigger history.
Nearby sold comps map
Loading sold comps map…
Walkable amenities ~0.75 mi
Loading nearby amenities…
Taxation est. · year 1
- Rental income
- $14,580
- − Mortgage interest
- −$4,201
- − Property taxes
- −$1,125
- − Insurance
- −$375
- − Repairs & maintenance
- −$1,166
- − Management
- −$1,166
- − Depreciation
- −$2,182
- Taxable income
- $4,365
- Est. tax owed @ 24.0%
- −$1,047
- After-tax cash flow
- $4,251/yr
For passive investors: Depreciation is non-cash, so a rental often shows a tax loss while cash-flowing — sheltering income. Rental losses are passive: they offset passive income freely, and up to $25,000/yr can offset ordinary (W-2) income if you actively participate and your MAGI is under $100k (phasing out to $0 by $150k); unused losses carry forward. On sale, claimed depreciation is recaptured at up to 25%, and gains may owe capital-gains tax (a 1031 exchange can defer both). Figures are a year-1 estimate at your 24.0% rate — not tax advice; consult a CPA.
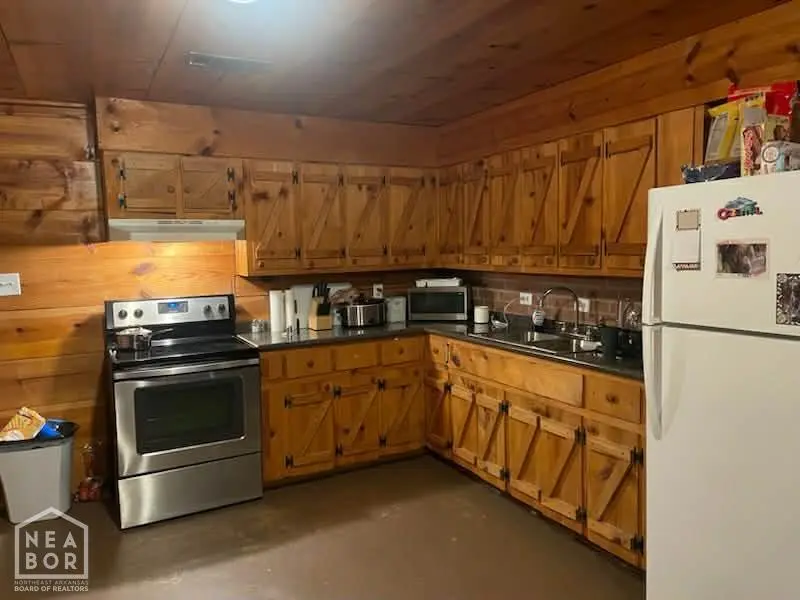
Condition & rehab AI · 9 photos
This single-family home requires moderate renovations to improve its condition and value. Key areas for improvement include painting, updating countertops and cabinets, and organizing the space.
Repairs flagged
- Minor countertops — Cluttered and worn
- Minor kitchen cabinets — Some wear
- Minor bathroom shelves — Cluttered and worn
Value-add opportunities
- Both paint interior walls — Fresh paint enhances curb appeal and interior aesthetics
- Both replace countertops — New countertops improve functionality and aesthetics
- Both install new kitchen cabinets — New cabinets provide more storage and a fresh look
Renovation cost estimate screening
| Repair item | Severity | Est. cost |
|---|---|---|
| countertops · Cluttered and worn | Minor | $500–3,000 |
| kitchen cabinets · Some wear | Minor | $500–3,000 |
| bathroom shelves · Cluttered and worn | Minor | $500–3,000 |
| Total estimated repair cost · 3 items | $1,500–9,000 |
Value-add ROI direction
- Both paint interior walls — Fresh paint enhances curb appeal and interior aesthetics ↑
- Both replace countertops — New countertops improve functionality and aesthetics ↑
- Both install new kitchen cabinets — New cabinets provide more storage and a fresh look ↑
ⓘ Cost ranges are severity-bucket heuristics (US national rule-of-thumb). Get contractor quotes + a written scope before underwriting a rehab budget.
Schools (NCES district)
- District
- East Poinsett County School District
- NCES district ID
- 0500048
- Math proficiency
- 36% ▼ -7.00%
- Reading proficiency
- 37% ▼ -4.00%
- Median HH income
- $33,882
- Composite
- 30.05/100
- National rank
- #6352
- State rank
- #113 of 238 in AR
Livability — Lepanto
- Score
- 66/100
- State rank
- #133
- US rank
- #12069
Category grades
Schools grade is shown separately in the Schools card above.
Census & demographics
- Census place
- Lepanto, AR
- Population (ZIP)
- 2,431
Population outlook (Poinsett County) Hauer SSP2
- Today (2025)
- 22,998 people
- By 2030
- 22,356 · -2.8%
- By 2040
- 21,150 · -8.0%
- By 2050
- 20,035 · -12.9%
- By 2075
- 17,745 · -22.8%
- By 2100
- 15,358 · -33.2%
Race, ethnicity, and origin ACS 2023
- Neighborhood character
- Predominantly White (75%)
- Race & ethnicity
- White 75% Two or more races 15% Black 9% Hispanic / Latino 7%
- Hispanic origin (detail)
- Mexican 7%
- Common ancestry
- Italian 2%
- Foreign-born
- 2% · Canada
- Languages at home
- 96% English-only · Spanish 4%
Political lean MEDSL · Poinsett
- 2024 margin
- Solid R (+63.5) · D 17.4% · R 81.0% · Other 1.6%
- 2008→2024 swing
- -36.3pp toward R · 2008: -27.2pp · 2024: -63.5pp
- All cycles
- 2024: R+63.5 2020: R+59.8 2016: R+24.1 2012: R+34.2 2008: R+27.2
Not yet ingested
- Civics
- —
Market trends
- HPI YoY
- ▼ -2.02%
- Current HPI
- 176.3774
- Rent YoY
- —
- Metro
- —
- State GDP YoY
- ▲ 3.80%
- F500 in state
- 10
Industry mix (Fortune 500 HQ in AR)
| Industry | F500 HQs | Revenue |
|---|---|---|
| Retail | 1 | $681B |
|
||
| Food / Agriculture | 1 | $53B |
|
||
| Retail / Energy | 1 | $22B |
|
||
| Transportation / Logistics | 1 | $12B |
|
||
| Energy | 1 | $4B |
|
||
Price history
1 event — show timeline
- 2026-01-14 Listed $75,000 NEABOR MLS
Cash-flow waterfall
monthlySold comps — $/sqft
last 12 mo · ≤1 miLoading sold comps…