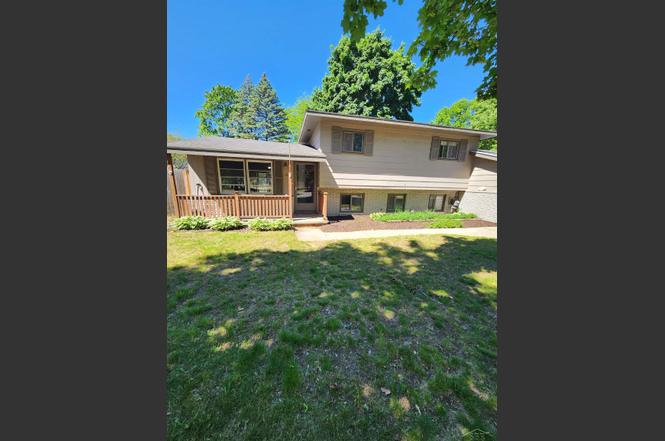
2304 Judith Ct · Midland, MI
Flood risk 1/10 · Minimal
- FEMA flood zone
- X (unshaded)
- Chance of flooding over 30 yrs
- 0.0%
- Est. flood insurance / yr
- $507 – $1,088
Fire risk 1/10 · Minimal
- Est. fire insurance / yr
- $784 – $1,456
Heat risk 2/10 · Minimal
- Hot days now (above 98°F)
- 7 days/yr
- Hot days in 30 yrs
- 14 days/yr
Wind risk 1/10 · Minimal
- Chance of severe wind over 30 yrs
- —
Air-quality risk 2/10 · Minimal
- Unhealthy air days now
- 1 days/yr
- Unhealthy air days in 30 yrs
- 1 days/yr
Risk factors via First Street. Map © Google.
Why this score? — see what drove the C- grade
The composite is a weighted blend of 9 inputs, each scored 0–100. Each bar is that input's sub-score; the figure is the points it added to the 100-point composite (weight × sub-score).
- Cash flow +18.7/30.0
- ARV discount +8.9/15.0
- DSCR +5.9/10.0
- Schools +4.9/10.0
- 1% rule +4.7/10.0
- Livability +4.2/5.0
- Rent growth +2.7/5.0
- Condition / age +2.5/5.0
- Appreciation +0.0/10.0
$205,000
🖨 Deal sheet 📄 Offer letter ✓ Due diligence
Listing remarks MLS
Welcome to this spacious 4-bedroom, 1.5-bath tri-level home tucked away on a quiet private cul-de-sac in Midland. Built in 1963, this well-laid-out home offers multiple living spaces and plenty of natural light throughout, creating a warm and inviting feel from the moment you walk in. With four bedrooms and generous living areas, there’s room for everyone to spread out and make it your own. The large yard provides great space for entertaining, relaxing, gardening, or play. Affordable taxes add even more value, making this an excellent opportunity for homeowners looking for space and long-term comfort. If you’ve been searching for a solid home in a peaceful setting that’s ready for its next chapter, 2304 Judith Ct. is ready to welcome you.
Key facts
- Natural light
- Large yard
- Private cul-de-sac
Tags
Property features AI
Finance
- Other: Pets allowed
- HOA & community: Homeowners association present
Exterior
- Parking: Attached garage; Assigned parking; 1.5 garage spaces
- Utilities: Public water; Public sewer
- Home design: Single-family residence; Residential zoning; Facing information not provided; 1,483 square feet above grade
- Construction: Brick and vinyl siding exterior; Block foundation
- Exterior features: Garden; Porch; Fenced yard; City lot
Interior
- Kitchen: Dishwasher; Microwave; Oven; Range; Refrigerator
- Bathrooms: 1 full bathroom; 1 half bathroom
- Heating & cooling: Natural gas heating; Steam heating; Ceiling fans; Wall/window air conditioning
- Interior features: Gas water heater; Disposal; Crawl space/block basement; 11 total rooms
- Laundry & utility: Washer; Dryer
Neighborhood map
What this means for you Summary
Snapshot
- This is a 4-bed/1.5-bath single-family listed at $205k.
Deal economics
- At list price, monthly cash flow is $201 ($2k/yr) — positive.
- The deal already cash-flows at list — no discount required.
- To meet the 1% rule (rent ≥ 1% of price), the offer needs to be $200k (2.6% below list).
- Recommended offer: $193k (6.0% below list) — sets the bar for market timing.
- Cap rate 7.5% vs local median 4.4% in Midland — top-decile yield for the area; either an underpriced asset or a hidden risk that comps aren't pricing in. Stress-test before assuming the spread holds.
Location & tenants
- Location reads 85/100 on livability (#28 in MI, #578 nationally) — a professional / high-income tenant draw. Strengths: crime A+, cost of living A+, housing A+; Watch: commute F.
- Midland Public Schools (urban): math 49% / reading 64% proficiency, ranked #62 of 540 in MI (top 12%) — acceptable for families but not a draw, mixed tenant base, ~2y average lease.
- Market conditions: Rents flat; 95 active listings in the ZIP; solid renter incomes; 320 units permitted in Midland County in 2024 (204 in 5+ unit buildings).
- This rent runs 31% of the median local income ($78k/yr) — at the standard rent-burdened threshold; future hikes will face affordability resistance.
Forward outlook
- Local home prices are declining (-3.0%/yr); year-one equity from $1k of loan paydown is wiped out by about $6k of value loss. Plan a longer hold.
- Midland County population projected to shrink 9% by 2050 — rents likely to lag national; underwrite the cash flow, not the appreciation.
Negotiation context
- It's been on market 76 days — a 6% lower offer ($193k) is reasonable based on typical stale-listing flexibility.
- 7 sale attempts; this cycle's ask has dropped $35k (15%) from the opening price — seller is motivated, your offer sets the floor, not the list.
- Current owner paid $117k; list at $205k implies a 75% gain — meaningful room to come down on a strong offer.
Questions for the listing agent
- It's been on market 76 days. Have you received any prior offers? Is the seller open to a 6% concession, seller financing, or rate buy-down credit?
- Built in 1963 — when were the roof, HVAC, electrical panel, plumbing, and water heater last replaced?
- Why hasn't it sold? Are there any deal-killer items the seller is aware of (foundation, flood, title, zoning, code violations)?
- Is there a deadline driving the sale (1031 exchange, divorce, estate, relocation)? That informs how much negotiation room exists.
- Schools are A-rated — typically a magnet for longer-tenancy family renters. What's the average tenant stay here, and is there a school-zone premium baked into asking?
- What's the average days-on-market for RENTAL listings here right now (not sales)? A rising rental-DOM trend means longer vacancies and softer asking-rent achievability than the comps imply.
- What's the recent tenant-quality profile in this submarket — average credit score on applications, eviction rate, late-payment / NSF rate, and stable-employment percentage? A property-management company in the area should have these aggregated.
- How much new for-sale + rental construction is in the pipeline within 1–3 miles? Heavy new supply typically softens prices + rents 12–24 months out; constrained supply supports both.
Investment metrics
- 1% rule
- 0.97% ✗
- Cap rate
- 7.47%
- Cash-on-cash
- 4.20%
- DSCR
- 1.19
- GRM
- 8.6
CMA / ARV
- ARV (on-the-fly)
- $211,438
- Comps found
- 12
Show comp detail 12 sales within ~0.75 mi
| Address | Dist | Beds/Ba | Sqft | Sold | Price | $/sf | Match |
|---|---|---|---|---|---|---|---|
| 2605 E Ashman St | 0.24mi | 3/1.5 (-1) | 1,500 (+1%) | 6mo | $203,000 | $135 | 78 |
| 2108 E Wyllys St | 0.16mi | 4/2.0 | 1,593 (+7%) | 7mo | $305,000 | $191 | 73 |
| 3214 Birchfield Dr | 0.24mi | 3/2.0 (-1) | 1,397 (-6%) | 2mo | $241,500 | $173 | 70 |
| 2203 Lambros St | 0.37mi | 3/1.0 (-1) | 1,550 (+4%) | 3mo | $200,000 | $129 | 66 |
| 3323 Birchfield Dr | 0.34mi | 3/1.0 (-1) | 1,512 (+2%) | 12mo | $230,000 | $152 | 65 |
| 2111 E Ashman St | 0.21mi | 5/1.5 (+1) | 1,386 (-7%) | 12mo | $191,000 | $138 | 64 |
| 3614 McKeith Rd | 0.54mi | 3/2.0 (-1) | 1,514 (+2%) | 6mo | $248,000 | $164 | 60 |
| 3300 Fairlane St | 0.27mi | 4/1.0 | 1,364 (-8%) | 14mo | $182,000 | $133 | 60 |
| 2301 Carol Ct | 0.08mi | 3/2.0 (-1) | 1,673 (+12%) | 14mo | $234,073 | $140 | 57 |
| 1824 E Ashman St | 0.31mi | 3/2.0 (-1) | 1,704 (+14%) | 7mo | $241,500 | $142 | 49 |
| 3404 Waldo Ave | 0.68mi | 3/1.0 (-1) | 1,360 (-9%) | 11mo | $173,000 | $127 | 37 |
| 2206 Laurel Ln | 0.72mi | 3/2.5 (-1) | 1,312 (-12%) | 13mo | $248,500 | $189 | 27 |
Match score weights: distance 35% · size 25% · config 20% · recency 20%. Top-matched comps best support the ARV.
Projected returns pro-forma
-3.0% appreciation · 0.6% rent growth · sell at horizon
- IRR
- -12.4%
- Equity multiple
- 0.56×
- Total profit
- $-25,119
- Equity at exit
- $30,566
- IRR
- -7.3%
- Equity multiple
- 0.59×
- Total profit
- $-23,777
- Equity at exit
- $17,725
Cash invested: $57,400 (down + closing). Projections, not guarantees.
Landlord ↔ Tenant lean methodology
- Overall (STATE)
- 62 Landlord-Friendly
- State Michigan
- 62 Landlord-Friendly · EVEN
- County
- — inherits STATE
- City
- — inherits STATE
ZIP-level market 48642
- Home prices YoY
- -31.4%
- Rents YoY
- 0.6%
- Active inventory
- 95
- Price-to-rent
- 8.6×
Monthly cashflow live
- Estimated rent
- $1,996 medium interval (Pro) →
- Mortgage (P&I)
- −$1,075
- Tax from tax record
- −$215 /mo · $2,586/yr
- Insurance
- −$85
- HOA
- −$0
- Vacancy / Maint / Mgmt
- −$419
- Net cashflow
- $201
Break-even live
UW: 25.0% down · 7.5% · 30yr · 1.5% tax · 5.0% vac · 8.0% maint · 8.0% mgmt
Financing live
Cash to close
- Down payment
- $51,250
- Closing costs
- $6,150
- Reserves months
- —
- Total cash needed
- —
Loan-product check · same deal, 3 products live
Conventional
25% down · 7.5% · 30yr
- Down + closing
- —
- Monthly P&I
- —
- Monthly cashflow
- —
- DSCR
- —
- Eligible?
- —
Personal DTI + credit; lowest rate.
DSCR
20% down · 8.5% · 30yr
- Down + closing
- —
- Monthly P&I
- —
- Monthly cashflow
- —
- DSCR
- —
- Eligible?
- —
No personal income docs; deal must DSCR.
Hard money
10% down · 12.0% · 12mo
- Down + closing
- —
- Monthly P&I
- —
- Monthly cashflow
- —
- DSCR
- —
- Eligible?
- —
Short-term bridge; refi at stabilization.
Listing history 15 events
-
2026-06-19days on market $205,000 Active 76 DOM
-
2026-06-18days on market $205,000 Active 75 DOM
-
2026-06-17days on market $205,000 Active 74 DOM
-
2026-06-16days on market $205,000 Active 73 DOM
-
2026-06-15days on market $205,000 Active 72 DOM
-
2026-06-14days on market $205,000 Active 70 DOM
-
2026-06-13days on market $205,000 Active 69 DOM
-
2026-06-10pricedays on market $205,000 Active 67 DOM
-
2026-06-09days on market $215,000 Active 66 DOM
-
2026-06-08days on market $215,000 Active 65 DOM
-
2026-06-07days on market $215,000 Active 64 DOM
-
2026-06-02days on market $215,000 Active 59 DOM
-
2026-06-01days on market $215,000 Active 58 DOM
-
2026-05-31days on market $215,000 Active 57 DOM
-
2026-05-30days on market $215,000 Active 56 DOM
ⓘ Source: listings_history table (triggers on properties + properties_extension) + one-shot
backfill from property_details.listing_events for pre-trigger history.
Tax reassessment forecast MI · Partial reset (capped growth)
- Current annual tax
- $2,586 · $215/mo
- Projected year-2 tax
- $2,871 · $239/mo
- Expected delta
- +$286/yr (+$24/mo · 11.1%)
ⓘ Screening estimate from a state-policy table — verify with the county assessor before closing.
Climate risk First Street
- Flood 1/10 Low FEMA zone X (unshaded) · 0% chance over 30 yrs
- Wildfire 1/10 Low
- Heat 2/10 Low 7 d/yr ≥98°F today · 14 d/yr by 30 yrs out
- Wind 1/10 Low
- Air quality 2/10 Low 1 unhealthy d/yr today · 1 by 30 yrs out
Nearby sold comps map
Loading sold comps map…
Walkable amenities ~0.75 mi
Loading nearby amenities…
Taxation est. · year 1
- Rental income
- $23,953
- − Mortgage interest
- −$11,483
- − Property taxes
- −$2,586
- − Insurance
- −$1,025
- − Repairs & maintenance
- −$1,916
- − Management
- −$1,916
- − Depreciation
- −$5,964
- Taxable loss
- −$937
- Est. tax savings @ 24.0%
- +$225
- After-tax cash flow
- $2,637/yr
For passive investors: Depreciation is non-cash, so a rental often shows a tax loss while cash-flowing — sheltering income. Rental losses are passive: they offset passive income freely, and up to $25,000/yr can offset ordinary (W-2) income if you actively participate and your MAGI is under $100k (phasing out to $0 by $150k); unused losses carry forward. On sale, claimed depreciation is recaptured at up to 25%, and gains may owe capital-gains tax (a 1031 exchange can defer both). Figures are a year-1 estimate at your 24.0% rate — not tax advice; consult a CPA.
Schools (NCES district)
- District
- Midland Public Schools
- NCES district ID
- 2623820
- Math proficiency
- 49% ▼ -6.00%
- Reading proficiency
- 64% ▼ -3.00%
- Median HH income
- $55,844
- Composite
- 48.67/100
- National rank
- #2105
- State rank
- #62 of 540 in MI
Livability — Midland
- Score
- 85/100
- State rank
- #28
- US rank
- #578
Category grades
Schools grade is shown separately in the Schools card above.
Census & demographics
- Census place
- Midland, MI
- County
- Midland County · 66,531 people
- City population
- 66,531
- Metro
- Midland, MI
- Population (ZIP)
- 34,039
- Household income
- $77,847
- Rent vs Own
- Severe rent burden
- 935.0
Population outlook (Midland County) Hauer SSP2
- Today (2025)
- 83,968 people
- By 2030
- 83,368 · -0.7%
- By 2040
- 80,713 · -3.9%
- By 2050
- 76,698 · -8.7%
- By 2075
- 67,617 · -19.5%
- By 2100
- 57,529 · -31.5%
Race, ethnicity, and origin ACS 2023
- Neighborhood character
- Predominantly White (88%)
- Race & ethnicity
- White 88% Hispanic / Latino 4% Asian 4% Two or more races 3% Black 2%
- Common ancestry
- Romanian 8% Lithuanian 5% Italian 3%
- Foreign-born
- 5% · Canada, China, Vietnam
- Languages at home
- 95% English-only · Other Indo-European 1% Spanish 1% Chinese 1%
Political lean MEDSL · Midland
- 2024 margin
- R (+15.2) · D 41.6% · R 56.8% · Other 1.6%
- 2008→2024 swing
- -11.6pp toward R · 2008: -3.6pp · 2024: -15.2pp
- All cycles
- 2024: R+15.2 2020: R+14.6 2016: R+19.4 2012: R+15.5 2008: R+3.6
Not yet ingested
- Civics
- —
Market trends
- HPI YoY
- ▼ -87.89%
- Current HPI
- 192.0812
- Rent YoY
- ▲ 0.60%
- Metro
- Midland, MI
- State GDP YoY
- ▲ 1.37%
- F500 in state
- 28
Industry mix (Fortune 500 HQ in MI)
| Industry | F500 HQs | Revenue |
|---|---|---|
| Automotive Parts | 3 | $48B |
|
||
| Automotive | 2 | $372B |
|
||
| Chemicals | 1 | $45B |
|
||
| Automotive Retail | 1 | $29B |
|
||
| Healthcare / Medical Devices | 1 | $23B |
|
||
| Automotive Technology | 1 | $20B |
|
||
Price history
+83.8% since first listed16 events — show timeline
- 2026-05-29 Relisted — REALCOMP
- 2026-05-29 Relisted — MiRealSource-MiMLS
- 2026-04-15 Listing Removed — MiRealSource-MiMLS
- 2026-04-06 Relisted — REALCOMP
- 2026-04-06 Relisted — MiRealSource-MiMLS
- 2026-03-26 Contingent — REALCOMP
- 2026-03-25 Contingent — MiRealSource-MiMLS
- 2026-03-23 Price Changed $215,000 MiRealSource-MiMLS
- 2026-03-23 Price Changed $215,000 REALCOMP
- 2026-03-12 Relisted — REALCOMP
- 2026-03-11 Listing Removed — REALCOMP
- 2026-03-10 Price Changed $225,000 MiRealSource-MiMLS
- 2026-03-09 Price Changed $225,000 REALCOMP
- 2026-02-18 Listed $240,000 MiRealSource-MiMLS
- 2026-02-18 Listed $240,000 REALCOMP
- 2016-11-15 Sold (Public Records) $117,000 Public Records
Property tax history
+3.6%/yrLatest (2024): $2,586 · +4.9% YoY. Source: county tax records.
Cash-flow waterfall
monthlySold comps — $/sqft
last 12 mo · ≤1 miLoading sold comps…