1549 Sandpiper St #42 · Naples, FL
Flood risk 9/10 · Severe
- FEMA flood zone
- AE
- Chance of flooding over 30 yrs
- 0.99%
- Est. flood insurance / yr
- $1,737 – $8,500
Fire risk 3/10 · Minor
- Est. fire insurance / yr
- $947 – $1,759
Heat risk 10/10 · Severe
- Hot days now (above 107°F)
- 7 days/yr
- Hot days in 30 yrs
- 28 days/yr
Wind risk 10/10 · Severe
- Chance of severe wind over 30 yrs
- 99.0%
Air-quality risk 3/10 · Minor
- Unhealthy air days now
- 3 days/yr
- Unhealthy air days in 30 yrs
- 3 days/yr
Risk factors via First Street. Map © Google.
Why this score? — see what drove the A- grade
The composite is a weighted blend of 9 inputs, each scored 0–100. Each bar is that input's sub-score; the figure is the points it added to the 100-point composite (weight × sub-score).
- Cash flow +30.0/30.0
- 1% rule +10.0/10.0
- DSCR +10.0/10.0
- ARV discount +7.5/15.0
- Appreciation +7.0/10.0
- Schools +5.0/10.0
- Rent growth +4.7/5.0
- Livability +4.0/5.0
- Condition / age +2.5/5.0
$305,000
🖨 Deal sheet 📄 Offer letter ✓ Due diligence
Listing remarks
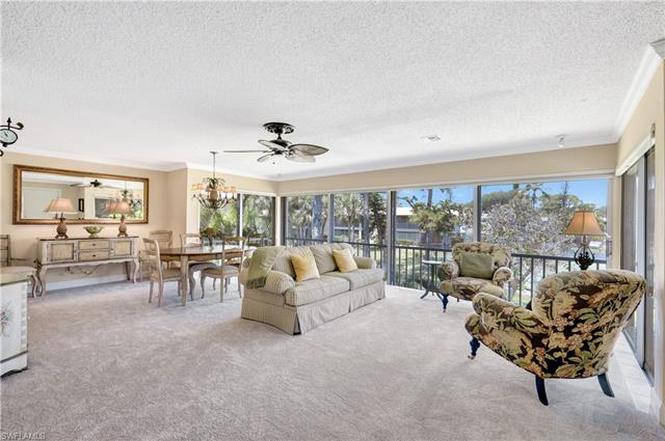
Discover the perfect blend of comfort and convenience in this beautifully appointed 2-bedroom, 2-bathroom house just minutes from the beach! Nestled on the 2nd floor, this corner unit offers an extended lanai under air, creating a serene space for relaxation or entertaining. Step inside to find a bright, open floor plan accentuated by recessed sliders, crown molding, and elegant plantation shutters. Enjoy modern living with GE appliances, California closets, and ample storage space, all designed for your ease and enjoyment. With an HVAC compressor updated in 2023 and a condenser from 2014, you can rest easy knowing your comfort is well-maintained. Benefit from two assigned parking spaces an
Key facts
- Recessed sliders
- Plantation shutters
- Ge appliances
Tags
Property features AI
Finance
- Other: Multi-unit complex with 92 units; 4 units in building; 1 floor; 2 units per floor
- Financial info: Information not provided
- HOA & community: Mandatory HOA; Quarterly condo fee; HOA covers cable, insurance, lawn/land maintenance, legal/accounting, management, exterior pest control, reserves, sewer, street lights, trash removal and water; Professional management; Community amenities include bike storage, community pool, extra storage, internet access, pickleball, streetlights and tennis court; Non-gated community with tennis facilities; Total annual recurring HOA fees listed
Exterior
- Parking: Information not provided
- Security: Impact resistant windows
- Utilities: Central water; Central sewer; Cable available
- Home design: Residential property; Low-rise building (1-3 stories); Corner end-unit, traditional style; Rear exposure faces north; Zero lot line
- Construction: Concrete block construction; Stucco exterior finish; Built in 1976; Built-up/flat and metal roof
- Exterior features: Courtyard; Automatic sprinkler system; Extra storage; Tennis court
Interior
- Kitchen: Electric cooktop; Dishwasher; Disposal; Microwave; Refrigerator/Freezer
- Bedrooms: 2 bedrooms
- Flooring: Carpet; Tile
- Bathrooms: 2 full bathrooms; Master bathroom with shower only
- Heating & cooling: Central electric heat; Central electric cooling; Ceiling fans
- Interior features: Cable prewire and high-speed internet available; Smoke detectors; Walk-in closet; Window coverings; Breakfast bar and dining (living) area; Family room; Split bedroom floor plan; Furnished negotiable
- Laundry & utility: Washer and dryer included; Washer/Dryer hookup; Laundry in residence
Neighborhood map
What this means for you Summary
Snapshot
- This is a 2-bed/2.0-bath condo listed at $305k.
Deal economics
- At list price, monthly cash flow is $1k ($13k/yr) — positive.
- The deal already cash-flows at list — no discount required.
- Meets the 1% rule at list price ($5k rent vs $305k).
- Recommended offer: $268k (12.0% below list) — sets the bar for market timing.
Location & tenants
- Location reads 80/100 on livability (#126 in FL, #1,903 nationally) — a professional / high-income tenant draw. Strengths: crime A+, amenities A+, employment A+; Watch: commute D+, cost of living F.
- Collier (suburban): math 60% / reading 56% proficiency, ranked #16 of 73 in FL (top 22%) — acceptable for families but not a draw, mixed tenant base, ~2y average lease.
- Market conditions: Rents rising fast (+8.8%/yr); 614 active listings in the ZIP; 40 comparable units currently listed for rent nearby; rentals at typical pace (median 23d on market — plan ~3-4 weeks tenant-placement turnaround); high-income renter base; 3,520 units permitted in Collier County in 2024 (959 in 5+ unit buildings).
- At $5,447/mo this rent would consume 50% of the median local household income ($131k/yr) (locally 333% of renters already pay >50% of income on rent) — very limited rent-growth headroom before tenants either downsize or default.
Forward outlook
- In year one you build about $15k of equity ($2k loan paydown + $12k appreciation (4.1% local appreciation)).
- Collier County population projected at +30% by 2050 — long-run rental-demand tailwind backs the buy-and-hold thesis.
- At projected returns (4.1% appreciation + 8.0% rent growth), your $85k cash investment doubles in ~3 years — after that, you're playing with house money.
- By year 3, paydown + projected appreciation supports a ~$36k cash-out refi (75% LTV) — recoverable capital for the next deal without selling this one.
Negotiation context
- It's been on market 214 days — a 12% lower offer ($268k) is reasonable based on typical stale-listing flexibility.
- 5 sale attempts since 4y ago; this cycle's ask has dropped $25k (8%) from the opening price — seller is motivated, your offer sets the floor, not the list.
Risks & watch-outs
- Watch-outs: flood insurance adds $427/mo.
- Climate carrying-cost: in FEMA flood zone AE (mandatory federal flood insurance); severe wind risk, 99% chance of damaging wind over 30y; extreme-heat days projected 7→28/yr by 2055 (HVAC capex compounding) — expect insurance premiums to compound above CPI over the hold.
Questions for the listing agent
- It's been on market 214 days. Have you received any prior offers? Is the seller open to a 12% concession, seller financing, or rate buy-down credit?
- Built in 1976 — when were the roof, HVAC, electrical panel, plumbing, and water heater last replaced?
- What's the actual annual flood-insurance premium (NFIP or private), and is the property in a SFHA with mandatory coverage?
- What does the HOA fee cover, when was the last increase, and are there any pending special assessments or reserve-fund shortfalls?
- Any open or pending special assessments — roof, HVAC, plumbing, elevator, façade? What's the per-unit balance and payoff schedule, and is the seller paying it off at close or rolling it to the buyer?
- Why hasn't it sold? Are there any deal-killer items the seller is aware of (foundation, flood, title, zoning, code violations)?
- Is there a deadline driving the sale (1031 exchange, divorce, estate, relocation)? That informs how much negotiation room exists.
- Schools are B-rated — typically a magnet for longer-tenancy family renters. What's the average tenant stay here, and is there a school-zone premium baked into asking?
- What's the average days-on-market for RENTAL listings here right now (not sales)? A rising rental-DOM trend means longer vacancies and softer asking-rent achievability than the comps imply.
- What's the recent tenant-quality profile in this submarket — average credit score on applications, eviction rate, late-payment / NSF rate, and stable-employment percentage? A property-management company in the area should have these aggregated.
- How much new apartment / multifamily construction is in the pipeline within 1–3 miles? Heavy new supply (>2% of stock underway) typically softens rents 12–24 months out; light construction supports rent growth.
Investment metrics
- 1% rule
- 1.79% ✓
- Cap rate
- 12.29%
- Cash-on-cash
- 21.42%
- DSCR
- 1.95
- GRM
- 4.7
CMA / ARV
No comps found within radius.
Projected returns pro-forma
4.08% appreciation · 8.0% rent growth · sell at horizon
- IRR
- 28.8%
- Equity multiple
- 2.80×
- Total profit
- $154,048
- Equity at exit
- $156,130
- IRR
- 31.6%
- Equity multiple
- 6.67×
- Total profit
- $484,071
- Equity at exit
- $256,560
Cash invested: $85,400 (down + closing). Projections, not guarantees.
Landlord ↔ Tenant lean methodology
- Overall (STATE)
- 87 Strongly Landlord-Friendly
- State Florida
- 87 Strongly Landlord-Friendly · R+3
- County
- — inherits STATE
- City
- — inherits STATE
ZIP-level market 34102
- Home prices YoY
- 1.3%
- Rents YoY
- 8.8%
- Active inventory
- 614
- Price-to-rent
- 4.7×
Monthly cashflow live
- Estimated rent
- $5,447 high interval (Pro) →
- Mortgage (P&I)
- −$1,599
- Tax from tax record
- −$217 /mo · $2,601/yr
- Insurance
- −$127
- Flood insurance flood zone
- −$427 /mo · $5,118/yr
- HOA
- −$836
- Vacancy / Maint / Mgmt
- −$1,144
- Net cashflow
- $1,098
Break-even live
UW: 25.0% down · 7.5% · 30yr · 1.5% tax · 5.0% vac · 8.0% maint · 8.0% mgmt
Financing live
Cash to close
- Down payment
- $76,250
- Closing costs
- $9,150
- Reserves months
- —
- Total cash needed
- —
Loan-product check · same deal, 3 products live
Conventional
25% down · 7.5% · 30yr
- Down + closing
- —
- Monthly P&I
- —
- Monthly cashflow
- —
- DSCR
- —
- Eligible?
- —
Personal DTI + credit; lowest rate.
DSCR
20% down · 8.5% · 30yr
- Down + closing
- —
- Monthly P&I
- —
- Monthly cashflow
- —
- DSCR
- —
- Eligible?
- —
No personal income docs; deal must DSCR.
Hard money
10% down · 12.0% · 12mo
- Down + closing
- —
- Monthly P&I
- —
- Monthly cashflow
- —
- DSCR
- —
- Eligible?
- —
Short-term bridge; refi at stabilization.
Rent comps 40 comps
| Address | Beds | Baths | Sqft | Rent | $/sqft | DOM | Units | Dist |
|---|---|---|---|---|---|---|---|---|
| 1549 Sandpiper St #36 Naples, FL | 2.0 | 2.0 | 1073 | $2,195 | $2.05 | 23d | 1 | 0.03mi |
| 105 Georgetown Blvd #105 Naples, FL | 2.0 | 2.0 | 1450 | $6,500 | $4.48 | 23d | 1 | 0.09mi |
| 24 Rivard Rd Naples, FL | 3.0 | 2.0 | 1314 | $6,500 | $4.95 | 23d | 1 | 0.09mi |
| 1437 Sandpiper St Naples, FL | 3.0 | 2.0 | 1200 | $16,000 | $13.33 | 23d | 1 | 0.10mi |
| 69 Georgetown Blvd #69 Naples, FL | 2.0 | 2.0 | 1450 | $5,500 | $3.79 | 23d | 1 | 0.12mi |
| 91 Georgetown Blvd #91 Naples, FL | 2.0 | 2.0 | 1450 | $7,000 | $4.83 | 23d | 1 | 0.12mi |
| 1747 Sandpiper St Unit B Naples, FL | 3.0 | 2.0 | 1800 | $9,000 | $5.00 | 21d | 1 | 0.15mi |
| 84 Georgetown Blvd #84 Naples, FL | 2.0 | 2.0 | 1450 | $5,500 | $3.79 | 23d | 1 | 0.17mi |
| 1625 Chesapeake Ave #203 Naples, FL | 2.0 | 2.0 | 1200 | $4,500 | $3.75 | 23d | 1 | 0.18mi |
| 235 Lanchester Ct #42 Naples, FL | 2.0 | 2.0 | 1200 | $2,350 | $1.96 | 23d | 1 | 0.21mi |
| 12 Knights Bridge Rd Unit A32 Naples, FL | 2.0 | 2.0 | 1095 | $3,200 | $2.92 | 21d | 1 | 0.21mi |
| 1686 Blue Point Ave Unit B1 Naples, FL | 2.0 | 2.0 | 1198 | $6,500 | $5.43 | 23d | 1 | 0.22mi |
| 1686 Blue Point Ave Naples, FL | 2.0 | 2.0 | 1057 | $5,500 | $5.20 | 13d | 2 | 0.22mi |
| 3001 Sandpiper Bay Cir Unit B106 Naples, FL | 2.0 | 2.0 | 1100 | $1,950 | $1.77 | 13d | 1 | 0.22mi |
| 1535 Chesapeake Ave Unit A2 Naples, FL | 2.0 | 2.0 | 1080 | $2,000 | $1.85 | 23d | 1 | 0.23mi |
| 3002 Sandpiper Bay Cir Unit A203 Naples, FL | 2.0 | 2.0 | 1200 | $2,200 | $1.83 | 23d | 1 | 0.23mi |
| 9 Knights Bridge Rd #30 Naples, FL | 2.0 | 2.0 | 1296 | $3,000 | $2.31 | 13d | 1 | 0.24mi |
| 280 Lanchester Ct #38 Naples, FL | 2.0 | 2.0 | 1325 | $2,500 | $1.89 | 21d | 1 | 0.25mi |
| 1501 Chesapeake Ave Unit 1296210P Naples, FL | 2.0 | 2.0 | 1377 | $4,110 | $2.98 | 13d | 1 | 0.25mi |
| 3011 Sandpiper Bay Cir Unit C102 Naples, FL | 2.0 | 2.0 | 1200 | $1,900 | $1.58 | 23d | 1 | 0.27mi |
| 3062 Sandpiper Bay Cir Naples, FL | 2.0 | 2.0 | 1150 | $4,250 | $3.70 | 23d | 2 | 0.29mi |
| 1555 Blue Point Ave Unit 3 Naples, FL | 2.0 | 2.0 | 1025 | $1,745 | $1.70 | 13d | 1 | 0.30mi |
| 3032 Sandpiper Bay Cir Naples, FL | 2.0 | 2.0 | 1150 | $4,100 | $3.57 | 23d | 2 | 0.30mi |
| 1155 Sandpiper St Naples, FL | 2.0 | 2.0 | 1062 | $3,950 | $3.72 | 21d | 3 | 0.31mi |
| 1155 Sandpiper St Naples, FL | 2.0 | 2.0 | 1062 | $4,050 | $3.81 | 23d | 2 | 0.31mi |
| 1186 Cherrystone Ct Naples, FL | 2.0 | 2.0 | 1163 | $1,995 | $1.72 | 23d | 1 | 0.31mi |
| 1376 Chesapeake Ave #2 Naples, FL | 2.0 | 2.0 | 1218 | $2,300 | $1.89 | 23d | 1 | 0.32mi |
| 1400 Blue Point Ave #104 Naples, FL | 2.0 | 2.0 | 1550 | $2,900 | $1.87 | 23d | 1 | 0.34mi |
| 1200 Cherrystone Ct Unit A203 Naples, FL | 2.0 | 2.0 | 1276 | $4,950 | $3.88 | 23d | 1 | 0.34mi |
| 1495 Blue Point Ave Unit C Naples, FL | 2.0 | 2.5 | 1529 | $12,000 | $7.85 | 23d | 1 | 0.34mi |
| 3051 Sandpiper Bay Cir Naples, FL | 2.0 | 2.0 | 1150 | $4,000 | $3.48 | 23d | 2 | 0.35mi |
| 3051 Sandpiper Bay Cir Unit I304 Naples, FL | 2.0 | 2.0 | 1200 | $3,000 | $2.50 | 13d | 1 | 0.35mi |
| 3041 Sandpiper Bay Cir Unit H201 Naples, FL | 2.0 | 2.0 | 1100 | $1,999 | $1.82 | 23d | 1 | 0.36mi |
| 1165 Clam Ct #7 Naples, FL | 2.0 | 2.5 | 1449 | $2,900 | $2.00 | 23d | 1 | 0.36mi |
| 985 Sandpiper St Unit 1I-204 Naples, FL | 3.0 | 2.0 | 1769 | $4,850 | $2.74 | 23d | 1 | 0.40mi |
| 1666 Osprey Ave #203 Naples, FL | 2.0 | 2.0 | 1200 | $7,000 | $5.83 | 23d | 1 | 0.44mi |
| 1120 Little Neck Ct Unit E40 Naples, FL | 3.0 | 2.0 | 1400 | $2,999 | $2.14 | 23d | 1 | 0.45mi |
| 1589 Osprey Ave Naples, FL | 3.0 | 2.0 | 1868 | $3,750 | $2.01 | 13d | 1 | 0.48mi |
| 1589 Osprey Ave Naples, FL | 3.0 | 2.0 | 1868 | $3,950 | $2.11 | 23d | 1 | 0.48mi |
| 1353 Pelican Ave Naples, FL | 2.0 | 2.0 | 1203 | $8,500 | $7.07 | 23d | 1 | 0.49mi |
HOA detail condo
- Monthly dues
- $836 · $10,032/yr
- Likely covers
- parking
- Assessments
- None detected in remarks — confirm with the listing agent.
Listing history 28 events
-
2026-06-18days on market $305,000 Active 214 DOM
-
2026-06-17days on market $305,000 Active 213 DOM
-
2026-06-16days on market $305,000 Active 212 DOM
-
2026-06-15days on market $305,000 Active 211 DOM
-
2026-06-10days on market $305,000 Active 206 DOM
-
2026-06-09days on market $305,000 Active 205 DOM
-
2026-06-08days on market $305,000 Active 204 DOM
-
2026-06-07days on market $305,000 Active 203 DOM
-
2026-06-03days on market $305,000 Active 199 DOM
-
2026-06-02days on market $305,000 Active 198 DOM
-
2026-06-01days on market $305,000 Active 197 DOM
-
2026-05-31days on market $305,000 Active 196 DOM
-
2026-05-30days on market $305,000 Active 195 DOM
-
2026-05-09price $305,000
-
2026-02-14price $320,000
-
2025-11-16$330,000 Active
-
2025-05-31historical
-
2025-01-21price $360,000
-
2024-05-28status Active
-
2024-03-19historical
-
2024-02-18$379,000 Active
-
2023-07-31historical
-
2023-02-10$369,000 Active
-
2022-09-30historical
-
2022-04-11$435,000 Active
-
2005-03-11soldstatus $290,000
-
2004-08-10soldstatus $167,000
-
1988-08-01soldstatus $62,545
ⓘ Source: listings_history table (triggers on properties + properties_extension) + one-shot
backfill from property_details.listing_events for pre-trigger history.
Tax reassessment forecast FL · Resets to sale price
- Current annual tax
- $2,601 · $217/mo
- Projected year-2 tax
- $2,601 · $217/mo
- Expected delta
- $0/yr ($0/mo · 0.0%)
ⓘ Screening estimate from a state-policy table — verify with the county assessor before closing.
Climate risk First Street
- Flood 9/10 Extreme FEMA zone AE · 99% chance over 30 yrs
- Wildfire 3/10 Moderate
- Heat 10/10 Extreme 7 d/yr ≥107°F today · 28 d/yr by 30 yrs out
- Wind 10/10 Extreme 99% chance of damaging wind over 30 yrs
- Air quality 3/10 Moderate 3 unhealthy d/yr today · 3 by 30 yrs out
Nearby sold comps map
Loading sold comps map…
Walkable amenities ~0.75 mi
Loading nearby amenities…
Taxation est. · year 1
- Rental income
- $65,369
- − Mortgage interest
- −$17,085
- − Property taxes
- −$2,601
- − Insurance
- −$6,644
- − Repairs & maintenance
- −$5,230
- − Management
- −$5,230
- − HOA
- −$10,032
- − Depreciation
- −$8,873
- Taxable income
- $9,676
- Est. tax owed @ 24.0%
- −$2,322
- After-tax cash flow
- $10,850/yr
For passive investors: Depreciation is non-cash, so a rental often shows a tax loss while cash-flowing — sheltering income. Rental losses are passive: they offset passive income freely, and up to $25,000/yr can offset ordinary (W-2) income if you actively participate and your MAGI is under $100k (phasing out to $0 by $150k); unused losses carry forward. On sale, claimed depreciation is recaptured at up to 25%, and gains may owe capital-gains tax (a 1031 exchange can defer both). Figures are a year-1 estimate at your 24.0% rate — not tax advice; consult a CPA.
Schools (NCES district)
- District
- Collier
- NCES district ID
- 1200330
- Math proficiency
- 60% ▼ -4.00%
- Reading proficiency
- 56% ▼ -2.00%
- Median HH income
- $58,275
- Composite
- 50.23/100
- National rank
- #1892
- State rank
- #16 of 73 in FL
Livability — Naples
- Score
- 80/100
- State rank
- #126
- US rank
- #1903
Category grades
Schools grade is shown separately in the Schools card above.
Census & demographics
- County
- Collier County · 396,295 people
- City population
- 344,941
- Metro
- Naples-Marco Island, FL
- Population (ZIP)
- 11,179
- Household income
- $130,929
- Rent vs Own
- Severe rent burden
- 333.0
Population outlook (Collier County) Hauer SSP2
- Today (2025)
- 420,858 people
- By 2030
- 450,054 · +6.9%
- By 2040
- 502,232 · +19.3%
- By 2050
- 544,932 · +29.5%
- By 2075
- 627,203 · +49.0%
- By 2100
- 659,015 · +56.6%
Race, ethnicity, and origin ACS 2023
- Neighborhood character
- Predominantly White (79%)
- Race & ethnicity
- White 79% Hispanic / Latino 9% Two or more races 8% Black 8% Asian 1%
- Hispanic origin (detail)
- Cuban 6%
- Common ancestry
- Hispanic 4% Lithuanian 4% Romanian 4%
- Foreign-born
- 17% · Canada, China
- Languages at home
- 87% English-only · Spanish 7% French/Haitian/Cajun 4% German/W. Germanic 1%
Political lean MEDSL · Collier
- 2024 margin
- Solid R (+33.1) · D 33.1% · R 66.2%
- 2008→2024 swing
- -10.6pp toward R · 2008: -22.5pp · 2024: -33.1pp
- All cycles
- 2024: R+33.1 2020: R+24.7 2016: R+26.0 2012: R+30.1 2008: R+22.5
Not yet ingested
- Civics
- —
Market trends
- HPI YoY
- ▲ 4.08%
- Current HPI
- 328.2755
- Rent YoY
- ▲ 8.75%
- Metro
- Naples-Marco Island, FL
- State GDP YoY
- ▲ 3.28%
- F500 in state
- 36
Industry mix (Fortune 500 HQ in FL)
| Industry | F500 HQs | Revenue |
|---|---|---|
| Industrial Technology | 2 | $29B |
|
||
| Insurance | 2 | $17B |
|
||
| Retail | 1 | $60B |
|
||
| Technology Distribution | 1 | $58B |
|
||
| Homebuilding | 1 | $35B |
|
||
| Technology Manufacturing | 1 | $35B |
|
||
Price history
+387.6% since first listed15 events — show timeline
- 2026-05-09 Price Changed $305,000 NAPLESMLS
- 2026-02-14 Price Changed $320,000 NAPLESMLS
- 2025-11-16 Listed $330,000 NAPLESMLS
- 2025-05-31 Listing Removed — NAPLESMLS
- 2025-01-21 Price Changed $360,000 NAPLESMLS
- 2024-05-28 Relisted — NAPLESMLS
- 2024-03-19 Listing Removed — NAPLESMLS
- 2024-02-18 Listed $379,000 NAPLESMLS
- 2023-07-31 Listing Removed — NAPLESMLS
- 2023-02-10 Listed $369,000 NAPLESMLS
- 2022-09-30 Listing Removed — NAPLESMLS
- 2022-04-11 Listed $435,000 NAPLESMLS
- 2005-03-11 Sold (Public Records) $290,000 Public Records
- 2004-08-10 Sold (Public Records) $167,000 Public Records
- 1988-08-01 Sold (Public Records) $62,545 Public Records
Property tax history
+7.2%/yrLatest (2025): $2,601 · +9.3% YoY. Source: county tax records.
Cash-flow waterfall
monthlySold comps — $/sqft
last 12 mo · ≤1 miLoading sold comps…