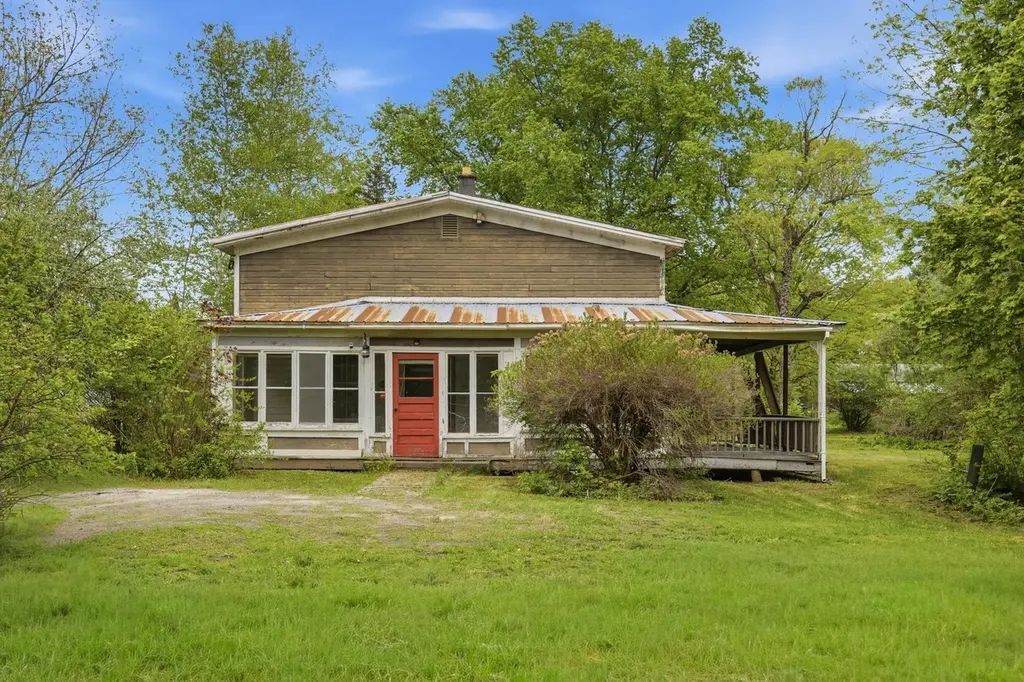
4 Spring St · Randolph, VT
Flood risk 4/10 · Minor
- FEMA flood zone
- X
- Chance of flooding over 30 yrs
- 0.22%
- Est. flood insurance / yr
- $473 – $860
Fire risk 1/10 · Minimal
- Est. fire insurance / yr
- $480 – $892
Heat risk 2/10 · Minimal
- Hot days now (above 90°F)
- 7 days/yr
- Hot days in 30 yrs
- 18 days/yr
Wind risk 3/10 · Minor
- Chance of severe wind over 30 yrs
- 4.0%
Air-quality risk 1/10 · Minimal
- Unhealthy air days now
- 0 days/yr
- Unhealthy air days in 30 yrs
- 0 days/yr
Risk factors via First Street. Map © Google.
Why this score? — see what drove the D+ grade
The composite is a weighted blend of 9 inputs, each scored 0–100. Each bar is that input's sub-score; the figure is the points it added to the 100-point composite (weight × sub-score).
- Cash flow +18.7/30.0
- ARV discount +7.5/15.0
- DSCR +5.9/10.0
- Schools +5.0/10.0
- 1% rule +4.5/10.0
- Livability +3.2/5.0
- Rent growth +2.5/5.0
- Condition / age +2.5/5.0
- Appreciation +0.0/10.0
$129,000
🖨 Deal sheet 📄 Offer letter ✓ Due diligence
Listing remarks
Opportunity awaits in a convenient Randolph location just a short walk from downtown shops, restaurants, schools, and community amenities. This home is ready for its next chapter. Portions of the property have been opened up while other areas remain intact, offering buyers flexibility to complete the project according to their vision and budget. A standout feature is the property’s direct access to Randolph’s growing network of mountain biking, hiking, and outdoor recreation trails located just beyond the large, level backyard. Enjoy the convenience of village living combined with immediate access to Vermont’s outdoor lifestyle. Whether you’re an investor, builder, o
Key facts
- Outdoor recreation
- Large level backyard
- 0.33 acre lot
Tags
Property features AI
Exterior
- Parking: Dirt driveway access
- Utilities: Public water; Public sewer; Circuit breaker electrical service; High-speed internet available
- Home design: Conversion / Historic vintage style; Rehab needed; Existing structure; Metal roof; Built in 1890
- Construction: Wood frame construction
- Exterior features: Level lot; Near trails and in-town location; Close to shopping, public transportation, and railroad; Dirt driveway; Gray exterior color
Interior
- Bathrooms: One quarter-bath (1/4)
- Heating & cooling: Oil heating
- Interior features: Six total rooms; Partial, unfinished crawl space basement with interior access
Neighborhood map
What this means for you Summary
Snapshot
- This is a 2-bed/1.0-bath single-family listed at $129k.
Deal economics
- At list price, monthly cash flow is $128 ($2k/yr) — positive.
- The deal already cash-flows at list — no discount required.
- To meet the 1% rule (rent ≥ 1% of price), the offer needs to be $123k (5.0% below list).
- Recommended offer: $123k (5.0% below list) — sets the bar for 1% rule.
- Cap rate 7.5% vs local median 1.5% in Randolph — top-decile yield for the area; either an underpriced asset or a hidden risk that comps aren't pricing in. Stress-test before assuming the spread holds.
Location & tenants
- Location reads 63/100 on livability (#70 in VT) — a middle-class / working-renter tenant base. Strengths: crime A+, cost of living A, housing A-; Watch: amenities F, commute F, employment F.
- Zoned schools: Randolph Elementary School (math 17% / reading 32%, grade F, #164 of 192 statewide, top 91%, 335 students, 25% FRL).
- Market conditions: 33 active listings in the ZIP; 74 units permitted in Orange County in 2024 (28 in 5+ unit buildings).
Forward outlook
- Local home prices are declining (-3.0%/yr); year-one equity from $892 of loan paydown is wiped out by about $4k of value loss. Plan a longer hold.
- Orange County population projected at -18% by 2050 — secular population decline; favor cash flow + early exit over multi-decade hold.
Negotiation context
- Only 6 days on market — expect competitive offers; lowballing is unlikely to land.
- Current owner paid $45k; list at $129k implies a 187% gain — meaningful room to come down on a strong offer.
Risks & watch-outs
- Watch-outs: built in 1890 — expect roof / HVAC / electrical / plumbing capex.
Questions for the listing agent
- Built in 1890 — when were the roof, HVAC, electrical panel, plumbing, and water heater last replaced?
- Is there a deadline driving the sale (1031 exchange, divorce, estate, relocation)? That informs how much negotiation room exists.
- Schools are F-rated, which usually means shorter tenancies and higher turnover. Who's the typical renter profile here, and what's been the actual vacancy rate?
- The area grade is low — what's the realistic commute time and amenity access for the typical tenant pool here? Any planned neighborhood developments (good or bad) we should know about?
- What's the average days-on-market for RENTAL listings here right now (not sales)? A rising rental-DOM trend means longer vacancies and softer asking-rent achievability than the comps imply.
- What's the recent tenant-quality profile in this submarket — average credit score on applications, eviction rate, late-payment / NSF rate, and stable-employment percentage? A property-management company in the area should have these aggregated.
- How much new for-sale + rental construction is in the pipeline within 1–3 miles? Heavy new supply typically softens prices + rents 12–24 months out; constrained supply supports both.
Investment metrics
- 1% rule
- 0.95% ✗
- Cap rate
- 7.48%
- Cash-on-cash
- 4.26%
- DSCR
- 1.19
- GRM
- 8.8
CMA / ARV
- ARV (on-the-fly)
- $289,800
- Comps found
- 6
Show comp detail 6 sales within ~0.75 mi
| Address | Dist | Beds/Ba | Sqft | Sold | Price | $/sf | Match |
|---|---|---|---|---|---|---|---|
| 27 School St | 0.22mi | 3/1.0 (+1) | 1,822 (+1%) | 12mo | $260,000 | $143 | 73 |
| 12 Pearl St | 0.48mi | 3/2.0 (+1) | 1,800 (0%) | 6mo | $330,000 | $183 | 63 |
| 22 Highland Ave | 0.40mi | 2/2.0 | 1,709 (-5%) | 16mo | $275,000 | $161 | 56 |
| 33 Maple St | 0.59mi | 3/1.0 (+1) | 1,690 (-6%) | 6mo | $255,000 | $151 | 52 |
| 15 Park St | 0.45mi | 3/2.0 (+1) | 1,591 (-12%) | 16mo | $77,500 | $49 | 37 |
| 6 Deer Run | 0.57mi | 3/2.0 (+1) | 1,624 (-10%) | 18mo | $380,000 | $234 | 33 |
Match score weights: distance 35% · size 25% · config 20% · recency 20%. Top-matched comps best support the ARV.
Projected returns pro-forma
-3.0% appreciation · 3.0% rent growth · sell at horizon
- IRR
- -9.7%
- Equity multiple
- 0.65×
- Total profit
- $-12,756
- Equity at exit
- $19,234
- IRR
- -0.3%
- Equity multiple
- 0.98×
- Total profit
- $-653
- Equity at exit
- $11,154
Cash invested: $36,120 (down + closing). Projections, not guarantees.
Landlord ↔ Tenant lean methodology
- Overall (STATE)
- 41 Moderately Tenant-Leaning
- State Vermont
- 41 Moderately Tenant-Leaning · D+15
- County
- — inherits STATE
- City
- — inherits STATE
ZIP-level market 05060
- Home prices YoY
- -3.4%
- Active inventory
- 33
- Price-to-rent
- 8.8×
Monthly cashflow live
- Estimated rent
- $1,226 medium interval (Pro) →
- Mortgage (P&I)
- −$676
- Tax from tax record
- −$110 /mo · $1,320/yr
- Insurance
- −$54
- HOA
- −$0
- Vacancy / Maint / Mgmt
- −$257
- Net cashflow
- $128
Break-even live
UW: 25.0% down · 7.5% · 30yr · 1.5% tax · 5.0% vac · 8.0% maint · 8.0% mgmt
Financing live
Cash to close
- Down payment
- $32,250
- Closing costs
- $3,870
- Reserves months
- —
- Total cash needed
- —
Loan-product check · same deal, 3 products live
Conventional
25% down · 7.5% · 30yr
- Down + closing
- —
- Monthly P&I
- —
- Monthly cashflow
- —
- DSCR
- —
- Eligible?
- —
Personal DTI + credit; lowest rate.
DSCR
20% down · 8.5% · 30yr
- Down + closing
- —
- Monthly P&I
- —
- Monthly cashflow
- —
- DSCR
- —
- Eligible?
- —
No personal income docs; deal must DSCR.
Hard money
10% down · 12.0% · 12mo
- Down + closing
- —
- Monthly P&I
- —
- Monthly cashflow
- —
- DSCR
- —
- Eligible?
- —
Short-term bridge; refi at stabilization.
Listing history 7 events
-
2026-06-18days on market $129,000 Active 6 DOM
-
2026-06-17days on market $129,000 Active 5 DOM
-
2026-06-16days on market $129,000 Active 4 DOM
-
2026-06-15days on market $129,000 Active 3 DOM
-
2026-06-15days on market $129,000 Active 2 DOM
-
2026-06-12remarks 675-char remark
-
2026-06-12$129,000 Active 1 DOM
ⓘ Source: listings_history table (triggers on properties + properties_extension) + one-shot
backfill from property_details.listing_events for pre-trigger history.
Tax reassessment forecast VT · Partial reset (capped growth)
- Current annual tax
- $1,320 · $110/mo
- Projected year-2 tax
- $1,885 · $157/mo
- Expected delta
- +$566/yr (+$47/mo · 42.9%)
ⓘ Screening estimate from a state-policy table — verify with the county assessor before closing.
Climate risk First Street
- Flood 4/10 Moderate FEMA zone X · 22% chance over 30 yrs
- Wildfire 1/10 Low
- Heat 2/10 Low 7 d/yr ≥90°F today · 18 d/yr by 30 yrs out
- Wind 3/10 Moderate 4% chance of damaging wind over 30 yrs
- Air quality 1/10 Low 0 unhealthy d/yr today · 0 by 30 yrs out
Nearby sold comps map
Loading sold comps map…
Walkable amenities ~0.75 mi
Loading nearby amenities…
Taxation est. · year 1
- Rental income
- $14,709
- − Mortgage interest
- −$7,226
- − Property taxes
- −$1,320
- − Insurance
- −$645
- − Repairs & maintenance
- −$1,177
- − Management
- −$1,177
- − Depreciation
- −$3,753
- Taxable loss
- −$588
- Est. tax savings @ 24.0%
- +$141
- After-tax cash flow
- $1,679/yr
For passive investors: Depreciation is non-cash, so a rental often shows a tax loss while cash-flowing — sheltering income. Rental losses are passive: they offset passive income freely, and up to $25,000/yr can offset ordinary (W-2) income if you actively participate and your MAGI is under $100k (phasing out to $0 by $150k); unused losses carry forward. On sale, claimed depreciation is recaptured at up to 25%, and gains may owe capital-gains tax (a 1031 exchange can defer both). Figures are a year-1 estimate at your 24.0% rate — not tax advice; consult a CPA.
Schools (NCES district)
No district data.
Livability — Randolph
- Score
- 63/100
- State rank
- #70
- US rank
- #15566
Category grades
Schools grade is shown separately in the Schools card above.
Census & demographics
- Census place
- Randolph, VT
- Population (ZIP)
- 4,064
Population outlook (Orange County) Hauer SSP2
- Today (2025)
- 28,186 people
- By 2030
- 27,359 · -2.9%
- By 2040
- 25,221 · -10.5%
- By 2050
- 23,023 · -18.3%
- By 2075
- 18,621 · -33.9%
- By 2100
- 14,477 · -48.6%
Race, ethnicity, and origin ACS 2023
- Neighborhood character
- Predominantly White (92%)
- Race & ethnicity
- White 92% Two or more races 7% Hispanic / Latino 2%
- Common ancestry
- Lithuanian 8% Slovak 7% Romanian 4%
- Foreign-born
- 2% · Canada
- Languages at home
- 98% English-only · French/Haitian/Cajun 1% Spanish 1%
Political lean MEDSL · Orange
- 2024 margin
- Strong D (+20.2) · D 58.3% · R 38.1% · Other 3.6%
- 2008→2024 swing
- -11.1pp toward R · 2008: 31.3pp · 2024: 20.2pp
- All cycles
- 2024: D+20.2 2020: D+24.1 2016: D+18.8 2012: D+32.1 2008: D+31.3
Not yet ingested
- Civics
- —
Market trends
- HPI YoY
- ▼ -10.90%
- Current HPI
- 314.3879
- Rent YoY
- —
- Metro
- —
- State GDP YoY
- —
- F500 in state
- 0
Price history
+186.7% since first listed2 events — show timeline
- 2026-06-12 Listed $129,000 PrimeMLS
- 1989-04-04 Sold (Public Records) $45,000 Public Records
Property tax history
+15.4%/yrLatest (2024): $1,320 · -22.2% YoY. Source: county tax records.
Cash-flow waterfall
monthlySold comps — $/sqft
last 12 mo · ≤1 miLoading sold comps…