 Duplex
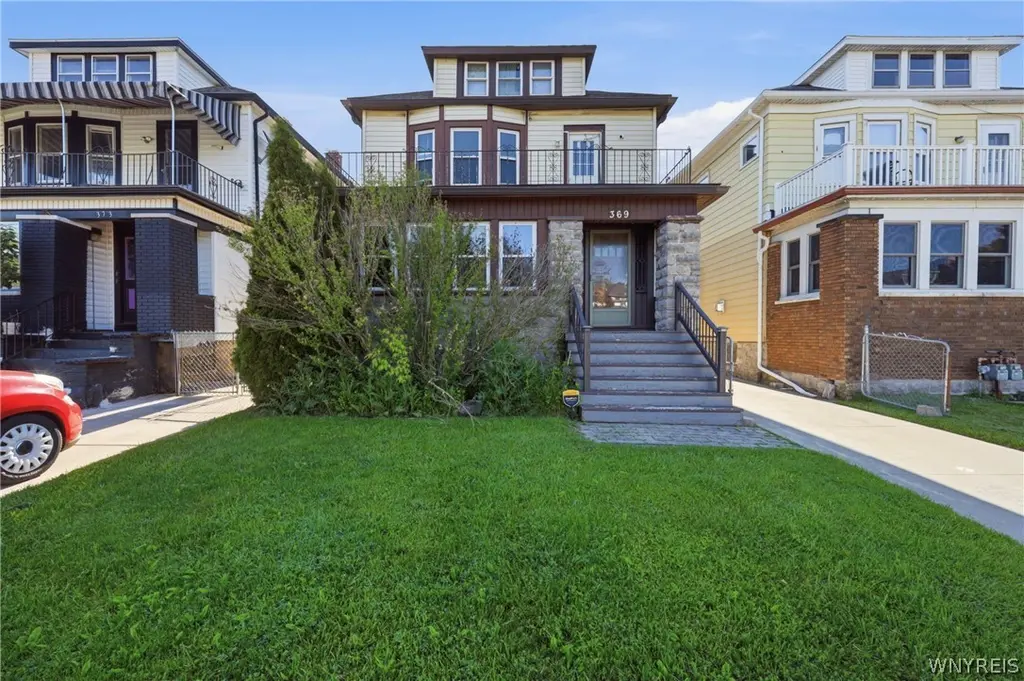
369 Colvin Ave · Buffalo, NY
Flood risk 1/10 · Minimal
- FEMA flood zone
- X (unshaded)
- Chance of flooding over 30 yrs
- 0.0%
- Est. flood insurance / yr
- $473 – $860
Fire risk 1/10 · Minimal
- Est. fire insurance / yr
- $691 – $1,283
Heat risk 3/10 · Minor
- Hot days now (above 92°F)
- 7 days/yr
- Hot days in 30 yrs
- 15 days/yr
Wind risk 1/10 · Minimal
- Chance of severe wind over 30 yrs
- —
Air-quality risk 3/10 · Minor
- Unhealthy air days now
- 3 days/yr
- Unhealthy air days in 30 yrs
- 4 days/yr
Risk factors via First Street. Map © Google.
Why this score? — see what drove the D- grade
The composite is a weighted blend of 9 inputs, each scored 0–100. Each bar is that input's sub-score; the figure is the points it added to the 100-point composite (weight × sub-score).
- Cash flow +14.5/30.0
- DSCR +4.4/10.0
- ARV discount +4.4/15.0
- Livability +3.9/5.0
- Rent growth +3.4/5.0
- Schools +3.3/10.0
- 1% rule +2.8/10.0
- Condition / age +2.5/5.0
- Appreciation +0.0/10.0
$430,000
🖨 Deal sheet (PDF) 📄 Offer letter ✓ Due diligence
Multi-family units
County records classify this as Multi-Family (2-4 Unit). Listing-text estimate: 2 units. confirmed
Listing remarks MLS
Welcome to 369 Colvin ! An Excellent location in a desirable North Buffalo neighborhood, this beautiful, classic and nicely renovated 3/3 multi family Home has a lot to offer ! First floor has a great open layout. Trendy kitchen opens to a modern dining room with a cozy living room area and a sun room to relax in! An oversized primary bedroom with hardwood floors & new light fixtures. The upper unit is very traditional with a large dining room & a living room that opens to a beautiful & updated porch for you to enjoy!. 3 Good size bedrooms and a bonus room - perfect for an office space, study or a walk-in closet. Modern vinyl plank flooring and a new carpet! Both units offer newer appliances- with gas stove & refrigerator; and freshly painted interior!! Excellent fully fenced back yard with a new large concrete parking pad and a gorgeous patio. New full tear off roof, full attic & large basement with glass block windows! This property has great potential for a rental income in a high demand area. Open House on Saturday 11/11th from1-3pm and Offers to be reviewed on Tuesday 11/14th at 2pm
Key facts
- Large concrete pad
- Two-family home
- Full tear-off roof
Tags
Property features AI
Finance
- Other: Two-unit property with separate gas and electric meters for each unit
- Financial info: Tenant responsible for all utilities; Operating expense details: See remarks
Exterior
- Parking: Concrete parking; Two or more parking spaces
- Utilities: Public water connected; Sewer connected; Circuit breaker electric service
- Home design: 2-story building; Resale property
- Construction: Built with aluminum siding, vinyl siding and stone exterior; Stone foundation; Asphalt roof; Copper and PEX plumbing; Attic/crawl hatchway(s) insulated
- Exterior features: Balcony; Near public transit; Rectangular residential lot; City street frontage
Interior
- Flooring: Hardwood; Laminate; Tile; Varies
- Bathrooms: Two full bathrooms
- Heating & cooling: Gas forced-air heating; Central air conditioning
- Interior features: Natural woodwork; Hardwood, laminate, tile and varied flooring; Full basement
- Laundry & utility: Gas water heater
Neighborhood map
What this means for you Summary
Snapshot
- This is a 2 × 3-bed/1.0-bath units multifamily listed at $430k.
Deal economics
- At list price, monthly cash flow is $91 ($1k/yr) — positive. Per door: $45/mo.
- The deal already cash-flows at list — no discount required.
- To meet the 1% rule (rent ≥ 1% of price), the offer needs to be $335k (22.1% below list).
- Recommended offer: $335k (22.1% below list) — sets the bar for 1% rule.
Location & tenants
- Location reads 77/100 on livability (#195 in NY, #3,011 nationally) — a middle-class / working-renter tenant base. Strengths: commute A+, housing A+, health & safety A+; Watch: crime F, employment D-.
- Buffalo City School District (urban): math 41% / reading 40% proficiency, ranked #535 of 590 in NY (top 91%) — families likely to look elsewhere, expect single-tenant / working-renter base with shorter leases; 75% free/reduced lunch — lower-income household profile, screen leases tightly.
- Market conditions: Rents rising (+3.6%/yr); 88 active listings in the ZIP; 1,244 units permitted in Erie County in 2024 (563 in 5+ unit buildings).
- At $3,350/mo this rent would consume 58% of the median local household income ($70k/yr) (locally 1831% of renters already pay >50% of income on rent) — very limited rent-growth headroom before tenants either downsize or default.
Forward outlook
- Local home prices are declining (-3.0%/yr); year-one equity from $3k of loan paydown is wiped out by about $13k of value loss. Plan a longer hold.
Negotiation context
- It's been on market 17 days — a 2% lower offer ($424k) is reasonable based on typical stale-listing flexibility.
- 5 sale attempts since 6y ago with the ask held roughly flat each time — persistent listings suggest the price (not the market) is what's stuck; bring a comps-based counter.
Risks & watch-outs
- Watch-outs: built in 1923 — expect roof / HVAC / electrical / plumbing capex.
Questions for the listing agent
- Can we see the unit-by-unit rent roll, current vacancy, and any below-market leases? What's the average tenancy length?
- What capital expenditures (roof, boiler, parking lot, exteriors) have been made in the last 5 years, and what's planned in the next 2?
- Built in 1923 — when were the roof, HVAC, electrical panel, plumbing, and water heater last replaced?
- Is there a deadline driving the sale (1031 exchange, divorce, estate, relocation)? That informs how much negotiation room exists.
- Crime grade is F in this area — have there been break-ins, vandalism, or insurance claims at this property in the last 3 years? What carrier currently insures it and at what premium?
- The area grade is low — what's the realistic commute time and amenity access for the typical tenant pool here? Any planned neighborhood developments (good or bad) we should know about?
- What's the average days-on-market for RENTAL listings here right now (not sales)? A rising rental-DOM trend means longer vacancies and softer asking-rent achievability than the comps imply.
- What's the recent tenant-quality profile in this submarket — average credit score on applications, eviction rate, late-payment / NSF rate, and stable-employment percentage? A property-management company in the area should have these aggregated.
- How much new apartment / multifamily construction is in the pipeline within 1–3 miles? Heavy new supply (>2% of stock underway) typically softens rents 12–24 months out; light construction supports rent growth.
Investment metrics
- 1% rule
- 0.78% ✗
- Cap rate
- 6.55%
- Cash-on-cash
- 0.90%
- DSCR
- 1.04
- GRM
- 10.7
CMA / ARV
- ARV (on-the-fly)
- $402,144
- Comps found
- 12
Show comp detail 12 sales within ~0.75 mi
| Address | Dist | Beds/Ba | Sqft | Sold | Price | $/sf | Match |
|---|---|---|---|---|---|---|---|
| 310 Colvin Ave | 0.13mi | 6/2.0 | 2,829 (-0%) | 0mo | $367,000 | $130 | 94 |
| 162 N Park Ave | 0.18mi | 6/2.0 | 2,876 (+2%) | 8mo | $407,500 | $142 | 83 |
| 190 Commonwealth Ave | 0.19mi | 6/2.0 | 2,672 (-6%) | 4mo | $310,000 | $116 | 79 |
| 12 Lovering Ave | 0.32mi | 6/2.0 | 2,876 (+2%) | 5mo | $294,000 | $102 | 79 |
| 24 Lovering Ave | 0.30mi | 6/2.0 | 2,716 (-4%) | 4mo | $340,000 | $125 | 75 |
| 246 Crestwood Ave | 0.13mi | 6/3.0 | 2,665 (-6%) | 7mo | $430,000 | $161 | 74 |
| 131 Tacoma Ave | 0.47mi | 6/2.0 | 2,808 (-1%) | 3mo | $330,000 | $118 | 74 |
| 21 Sterling Ave | 0.50mi | 6/2.0 | 2,910 (+3%) | 2mo | $441,000 | $152 | 70 |
| 1164 Hertel Ave | 0.39mi | 5/3.0 (-1) | 2,702 (-5%) | 2mo | $420,000 | $155 | 64 |
| 32 Sterling Ave | 0.46mi | 6/3.0 | 2,662 (-6%) | 7mo | $470,300 | $177 | 58 |
| 292 Hartwell Rd | 0.38mi | 6/2.0 | 2,446 (-14%) | 7mo | $355,000 | $145 | 54 |
| 64 Delham Ave | 0.73mi | 6/2.0 | 3,068 (+8%) | 1mo | $375,000 | $122 | 51 |
Match score weights: distance 35% · size 25% · config 20% · recency 20%. Top-matched comps best support the ARV.
Projected returns pro-forma
-3.0% appreciation · 3.65% rent growth · sell at horizon
- IRR
- -14.3%
- Equity multiple
- 0.49×
- Total profit
- $-61,900
- Equity at exit
- $64,114
- IRR
- -4.7%
- Equity multiple
- 0.68×
- Total profit
- $-38,124
- Equity at exit
- $37,179
Cash invested: $120,400 (down + closing). Projections, not guarantees.
Landlord ↔ Tenant lean methodology
- Overall (STATE)
- 15 Strongly Tenant-Friendly
- State New York
- 15 Strongly Tenant-Friendly · D+10
- County
- — inherits STATE
- City
- — inherits STATE
ZIP-level market 14216
- Rents YoY
- 3.6%
- Active inventory
- 88
- Price-to-rent
- 21.4×
Monthly cashflow live
- Estimated rent
- $3,350 high interval (Pro) →
- Mortgage (P&I)
- −$2,255
- Tax from tax record
- −$122 /mo · $1,460/yr
- Insurance
- −$179
- HOA
- −$0
- Vacancy / Maint / Mgmt
- −$704
- Net cashflow
- $91
Break-even live
Sensitivity live
| Price | -10% $334 | -5% $212 | +0% $91 | +5% $-31 | +10% $-153 |
|---|---|---|---|---|---|
| Rent | -10% $-174 | -5% $-42 | +0% $91 | +5% $223 | +10% $355 |
| Rate | -1.0pp $307 | -0.5pp $200 | base $91 | +0.5pp $-21 | +1.0pp $-134 |
2-unit breakdown (identical units grouped — click to expand)
| Units | Beds | Baths | Est. rent |
|---|---|---|---|
| 2× units | 3 | 1 | $3,350 |
| #1 | 3 | 1 | $1,675 |
| #2 | 3 | 1 | $1,675 |
| Total (2 units) | $3,350 | ||
UW: 25.0% down · 7.5% · 30yr · 1.5% tax · 5.0% vac · 8.0% maint · 8.0% mgmt
Financing live
Cash to close
- Down payment
- $107,500
- Closing costs
- $12,900
- Reserves months
- —
- Total cash needed
- —
Loan-product check · same deal, 3 products live
Conventional
25% down · 7.5% · 30yr
- Down + closing
- —
- Monthly P&I
- —
- Monthly cashflow
- —
- DSCR
- —
- Eligible?
- —
Personal DTI + credit; lowest rate.
DSCR
20% down · 8.5% · 30yr
- Down + closing
- —
- Monthly P&I
- —
- Monthly cashflow
- —
- DSCR
- —
- Eligible?
- —
No personal income docs; deal must DSCR.
Hard money
10% down · 12.0% · 12mo
- Down + closing
- —
- Monthly P&I
- —
- Monthly cashflow
- —
- DSCR
- —
- Eligible?
- —
Short-term bridge; refi at stabilization.
Listing history 14 events
-
2026-06-18days on market $430,000 Active 17 DOM
-
2026-06-17price $430,000 Active 16 DOM
-
2026-06-17days on market $450,000 Active 16 DOM
-
2026-06-16days on market $450,000 Active 15 DOM
-
2026-06-15days on market $450,000 Active 14 DOM
-
2026-06-13days on market $450,000 Active 12 DOM
-
2026-06-13days on market $450,000 Active 11 DOM
-
2026-06-10days on market $450,000 Active 9 DOM
-
2026-06-09days on market $450,000 Active 8 DOM
-
2026-06-08days on market $450,000 Active 7 DOM
-
2026-06-07days on market $450,000 Active 6 DOM
-
2026-06-03days on market $450,000 Active 2 DOM
-
2026-06-02remarks 699-char remark
-
2026-06-02$450,000 Active 1 DOM
ⓘ Source: listings_history table (triggers on properties + properties_extension) + one-shot
backfill from property_details.listing_events for pre-trigger history.
Tax reassessment forecast NY · Partial reset (capped growth)
- Current annual tax
- $1,460 · $122/mo
- Projected year-2 tax
- $4,363 · $364/mo
- Expected delta
- +$2,904/yr (+$242/mo · 198.9%)
ⓘ Screening estimate from a state-policy table — verify with the county assessor before closing.
Climate risk First Street
- Flood 1/10 Low FEMA zone X (unshaded) · 0% chance over 30 yrs
- Wildfire 1/10 Low
- Heat 3/10 Moderate 7 d/yr ≥92°F today · 15 d/yr by 30 yrs out
- Wind 1/10 Low
- Air quality 3/10 Moderate 3 unhealthy d/yr today · 4 by 30 yrs out
Nearby sold comps map
Loading sold comps map…
Walkable amenities ~0.75 mi
Loading nearby amenities…
Taxation est. · year 1
- Rental income
- $40,200
- − Mortgage interest
- −$24,087
- − Property taxes
- −$1,460
- − Insurance
- −$2,150
- − Repairs & maintenance
- −$3,216
- − Management
- −$3,216
- − Depreciation
- −$12,509
- Taxable loss
- −$6,437
- Est. tax savings @ 24.0%
- +$1,545
- After-tax cash flow
- $2,634/yr
For passive investors: Depreciation is non-cash, so a rental often shows a tax loss while cash-flowing — sheltering income. Rental losses are passive: they offset passive income freely, and up to $25,000/yr can offset ordinary (W-2) income if you actively participate and your MAGI is under $100k (phasing out to $0 by $150k); unused losses carry forward. On sale, claimed depreciation is recaptured at up to 25%, and gains may owe capital-gains tax (a 1031 exchange can defer both). Figures are a year-1 estimate at your 24.0% rate — not tax advice; consult a CPA.
Schools (NCES district)
- District
- Buffalo City School District
- NCES district ID
- 3605850
- Math proficiency
- 41% ▲ 11.00%
- Reading proficiency
- 40% ▲ 7.00%
- Median HH income
- $31,665
- Composite
- 33.17/100
- National rank
- #5544
- State rank
- #535 of 590 in NY
Livability — Buffalo
- Score
- 77/100
- State rank
- #195
- US rank
- #3011
Category grades
Schools grade is shown separately in the Schools card above.
Census & demographics
- Census place
- Buffalo, NY
- County
- Erie County · 714,559 people
- City population
- 440,021
- Metro
- Buffalo-Cheektowaga, NY
- Population (ZIP)
- 22,849
- Household income
- $69,629
- Rent vs Own
- Severe rent burden
- 1831.0
Population outlook (Erie County) Hauer SSP2
- Today (2025)
- 933,037 people
- By 2030
- 935,181 · +0.2%
- By 2040
- 928,531 · -0.5%
- By 2050
- 905,725 · -2.9%
- By 2075
- 834,037 · -10.6%
- By 2100
- 708,033 · -24.1%
Race, ethnicity, and origin ACS 2023
- Neighborhood character
- Predominantly White (72%)
- Race & ethnicity
- White 72% Black 16% Hispanic / Latino 7% Two or more races 5% Asian 1%
- Hispanic origin (detail)
- Puerto Rican 5%
- Common ancestry
- Romanian 10% Iranian 2% Lithuanian 1%
- Foreign-born
- 5% · Canada, China
- Languages at home
- 90% English-only · Spanish 5% French/Haitian/Cajun 1% Other Indo-European 1%
Political lean MEDSL · Erie
- 2024 margin
- Lean D (+9.7) · D 54.8% · R 45.2%
- 2008→2024 swing
- -7.9pp toward R · 2008: 17.5pp · 2024: 9.7pp
- All cycles
- 2024: D+9.7 2020: D+14.7 2016: D+4.8 2012: D+15.6 2008: D+17.5
Not yet ingested
- Civics
- —
Market trends
- HPI YoY
- ▼ -264.53%
- Current HPI
- 421.1138
- Rent YoY
- ▲ 3.65%
- Metro
- Buffalo-Cheektowaga, NY
- State GDP YoY
- ▲ 2.60%
- F500 in state
- 92
Industry mix (Fortune 500 HQ in NY)
| Industry | F500 HQs | Revenue |
|---|---|---|
| Financial Services | 10 | $950B |
|
||
| Consumer Goods | 9 | $162B |
|
||
| Insurance | 4 | $225B |
|
||
| Telecommunications | 2 | $144B |
|
||
| Pharmaceuticals | 2 | $112B |
|
||
| Media / Entertainment | 2 | $69B |
|
||
Price history
+100.0% since first listed17 events — show timeline
- 2026-06-01 Listed $450,000 WNYREIS
- 2024-01-25 Sold (Public Records) $420,000 Public Records
- 2024-01-16 Sold (MLS) $420,000 WNYREIS
- 2023-12-27 Pending — WNYREIS
- 2023-11-20 Pending — WNYREIS
- 2023-11-15 Contingent — WNYREIS
- 2023-11-09 Listed $379,900 WNYREIS
- 2021-10-27 Sold (Public Records) $270,000 Public Records
- 2021-10-20 Sold (MLS) $270,000 WNYREIS
- 2021-09-09 Pending — WNYREIS
- 2021-08-02 Pending — WNYREIS
- 2021-07-20 Listed $269,900 WNYREIS
- 2021-07-20 Listing Removed — WNYREIS
- 2021-07-20 Listed $269,900 WNYREIS
- 2020-10-16 Listing Removed — WNYREIS
- 2020-09-25 Listed $269,000 WNYREIS
- 2018-09-24 Sold (Public Records) $225,000 Public Records
Property tax history
+7.0%/yrLatest (2025): $1,460 · +16.8% YoY. Source: county tax records.
Cash-flow waterfall
monthlySold comps — $/sqft
last 12 mo · ≤1 miLoading sold comps…