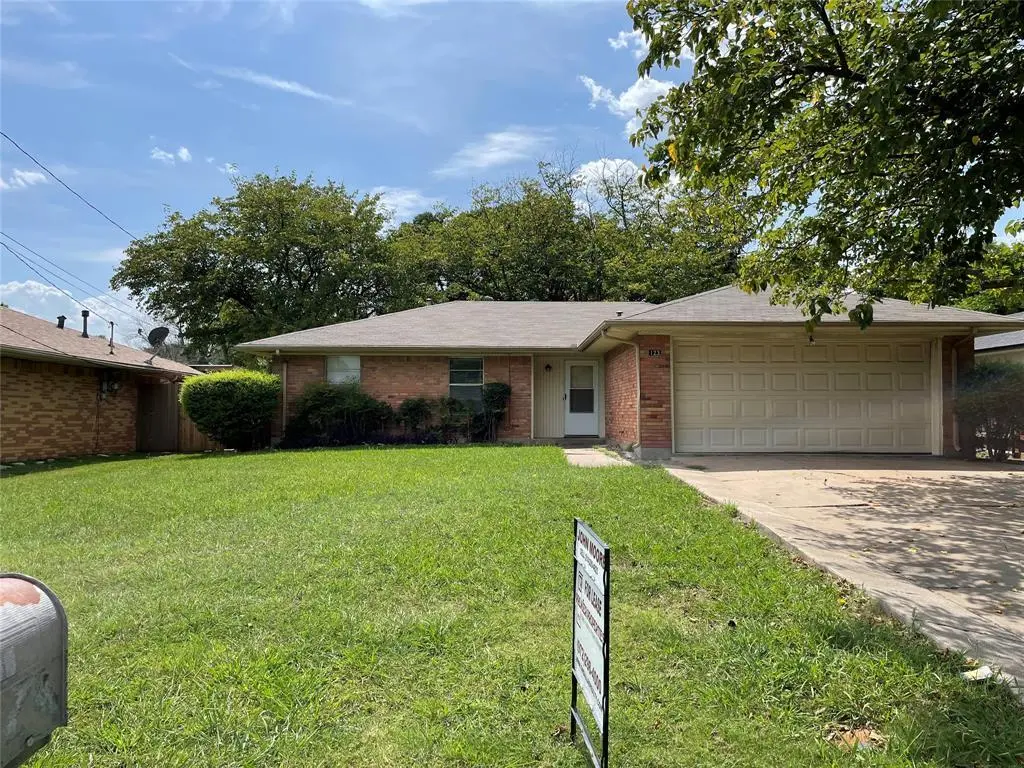
123 Evelyn St · DeSoto, TX
Flood risk 1/10 · Minimal
- FEMA flood zone
- X (unshaded)
- Chance of flooding over 30 yrs
- 0.0%
- Est. flood insurance / yr
- $507 – $1,088
Fire risk 4/10 · Minor
- Est. fire insurance / yr
- $1,222 – $2,270
Heat risk 7/10 · Major
- Hot days now (above 109°F)
- 7 days/yr
- Hot days in 30 yrs
- 24 days/yr
Wind risk 6/10 · Moderate
- Chance of severe wind over 30 yrs
- 27.0%
Air-quality risk 3/10 · Minor
- Unhealthy air days now
- 2 days/yr
- Unhealthy air days in 30 yrs
- 3 days/yr
Risk factors via First Street. Map © Google.
Why this score? — see what drove the D grade
The composite is a weighted blend of 9 inputs, each scored 0–100. Each bar is that input's sub-score; the figure is the points it added to the 100-point composite (weight × sub-score).
- ARV discount +14.7/15.0
- Cash flow +10.1/30.0
- 1% rule +4.0/10.0
- Livability +3.3/5.0
- DSCR +2.9/10.0
- Condition / age +2.5/5.0
- Rent growth +1.9/5.0
- Schools +1.9/10.0
- Appreciation +0.0/10.0
$225,000
🖨 Deal sheet 📄 Offer letter ✓ Due diligence
Listing remarks MLS
NICE 3 BED 1.5 BATH HOME WITH 2 CAR GARAGE. FRESH PAINT, RECENTLY REPLACED FLOORING.LARGE LIVING AREA OPEN TO KITCHEN. HUGE FENCED YARD IN WELL ESTABLISHED NEIGHBORHOOD. THE HOME IS CURRENTLY RENTED AS INVESTMENT HOME. LEASE EXPIRES JULY 2026. MONTHLY RENT IS $1750.
Key facts
- Fenced yard
- 2 garage spots
- Built 1968
Tags
Neighborhood map
What this means for you Summary
Snapshot
- This is a 3-bed/1.5-bath single-family listed at $225k.
Deal economics
- At list price, monthly cash flow is $-131 ($-2k/yr) — negative.
- To cash-flow at today's rent, offer at most $202k (10.3% below list).
- To meet the 1% rule (rent ≥ 1% of price), the offer needs to be $202k (10.2% below list).
- Recommended offer: $202k (10.3% below list) — sets the bar for cash-flow.
- Cap rate 5.6% vs local median 3.4% in DeSoto — top-decile yield for the area; either an underpriced asset or a hidden risk that comps aren't pricing in. Stress-test before assuming the spread holds.
Location & tenants
- Location reads 66/100 on livability (#589 in TX) — a middle-class / working-renter tenant base. Strengths: cost of living A+, housing A+; Watch: schools D+, amenities F, commute F.
- Desoto ISD (suburban): math 14% / reading 26% proficiency, ranked #754 of 826 in TX (top 91%) — low school quality limits family demand, transient renter base, plan for 1-2y turnover; 66% free/reduced lunch — lower-income household profile, screen leases tightly.
- Market conditions: Rents soft (-2.6%/yr); 472 active listings in the ZIP; 24 comparable units currently listed for rent nearby; rentals at typical pace (median 25d on market — plan ~3-4 weeks tenant-placement turnaround); solid renter incomes; 12,577 units permitted in Dallas County in 2024 (6,829 in 5+ unit buildings).
Forward outlook
- Local home prices are declining (-3.0%/yr); year-one equity from $2k of loan paydown is wiped out by about $7k of value loss. Plan a longer hold.
- Dallas County population projected at +35% by 2050 — long-run rental-demand tailwind backs the buy-and-hold thesis.
Negotiation context
- It's been on market 106 days — a 9% lower offer ($205k) is reasonable based on typical stale-listing flexibility.
- 2 sale attempts with the ask held roughly flat each time — persistent listings suggest the price (not the market) is what's stuck; bring a comps-based counter.
Risks & watch-outs
- Climate carrying-cost: major wind risk, 27% chance of damaging wind over 30y; extreme-heat days projected 7→24/yr by 2055 (HVAC capex compounding) — expect insurance premiums to compound above CPI over the hold.
Questions for the listing agent
- What do current leases actually rent for vs. the listed asking? Can we see a recent rent roll and the last 12 months of T-12 income?
- It's been on market 106 days. Have you received any prior offers? Is the seller open to a 10% concession, seller financing, or rate buy-down credit?
- Built in 1968 — when were the roof, HVAC, electrical panel, plumbing, and water heater last replaced?
- Why hasn't it sold? Are there any deal-killer items the seller is aware of (foundation, flood, title, zoning, code violations)?
- Is there a deadline driving the sale (1031 exchange, divorce, estate, relocation)? That informs how much negotiation room exists.
- Schools are D-rated, which usually means shorter tenancies and higher turnover. Who's the typical renter profile here, and what's been the actual vacancy rate?
- The area grade is low — what's the realistic commute time and amenity access for the typical tenant pool here? Any planned neighborhood developments (good or bad) we should know about?
- What's the average days-on-market for RENTAL listings here right now (not sales)? A rising rental-DOM trend means longer vacancies and softer asking-rent achievability than the comps imply.
- What's the recent tenant-quality profile in this submarket — average credit score on applications, eviction rate, late-payment / NSF rate, and stable-employment percentage? A property-management company in the area should have these aggregated.
- How much new for-sale + rental construction is in the pipeline within 1–3 miles? Heavy new supply typically softens prices + rents 12–24 months out; constrained supply supports both.
Investment metrics
- 1% rule
- 0.90% ✗
- Cap rate
- 5.59%
- Cash-on-cash
- -2.50%
- DSCR
- 0.89
- GRM
- 9.3
CMA / ARV
- ARV (median comp)
- $267,654
- List price
- $225,000
- Delta
- -15.94%
- Verdict
- UNDERPRICED
- Comps
- 20 within 1.0 mi
Show comp detail 12 sales within ~0.75 mi
| Address | Dist | Beds/Ba | Sqft | Sold | Price | $/sf | Match |
|---|---|---|---|---|---|---|---|
| 200 Evelyn St | 0.05mi | 3/2.0 | 1,493 (+2%) | 4mo | $189,000 | $127 | 88 |
| 118 Evelyn St | 0.04mi | 4/2.0 (+1) | 1,410 (-3%) | 2mo | $286,000 | $203 | 84 |
| 236 Evelyn St | 0.32mi | 3/2.0 | 1,450 (-0%) | 4mo | $265,000 | $183 | 79 |
| 208 Evelyn St | 0.10mi | 3/2.0 | 1,341 (-8%) | 8mo | $275,000 | $205 | 74 |
| 221 Evelyn St | 0.21mi | 3/2.0 | 1,408 (-3%) | 11mo | $285,000 | $202 | 73 |
| 523 Faye St | 0.09mi | 3/2.0 | 1,642 (+13%) | 6mo | $270,000 | $164 | 67 |
| 627 Randa Ln | 0.18mi | 3/2.0 | 1,276 (-12%) | 7mo | $259,000 | $203 | 64 |
| 709 Priscilla | 0.38mi | 3/2.0 | 1,525 (+5%) | 16mo | $240,000 | $157 | 59 |
| 422 Brookview Dr | 0.73mi | 3/2.0 | 1,552 (+7%) | 1mo | $245,000 | $158 | 52 |
| 405 Derby Ln | 0.42mi | 3/2.0 | 1,662 (+14%) | 12mo | $310,000 | $187 | 45 |
| 911 Whitewater Trl | 0.69mi | 3/2.0 | 1,556 (+7%) | 12mo | $264,000 | $170 | 45 |
| 612 Desoto Dr | 0.61mi | 3/2.0 | 1,662 (+14%) | 11mo | $260,000 | $156 | 36 |
Match score weights: distance 35% · size 25% · config 20% · recency 20%. Top-matched comps best support the ARV.
Projected returns pro-forma
-3.0% appreciation · 0.0% rent growth · sell at horizon
- IRR
- -24.2%
- Equity multiple
- 0.20×
- Total profit
- $-50,590
- Equity at exit
- $33,548
- IRR
- -33.4%
- Equity multiple
- -0.22×
- Total profit
- $-77,132
- Equity at exit
- $19,454
Cash invested: $63,000 (down + closing). Projections, not guarantees.
Landlord ↔ Tenant lean methodology
- Overall (STATE)
- 87 Strongly Landlord-Friendly
- State Texas
- 87 Strongly Landlord-Friendly · R+5
- County
- — inherits STATE
- City
- — inherits STATE
ZIP-level market 75115
- Rents YoY
- -2.6%
- Active inventory
- 472
- Price-to-rent
- 9.3×
Monthly cashflow live
- Estimated rent
- $2,021 high interval (Pro) →
- Mortgage (P&I)
- −$1,180
- Tax from tax record
- −$454 /mo · $5,447/yr
- Insurance
- −$94
- HOA
- −$0
- Vacancy / Maint / Mgmt
- −$424
- Net cashflow
- $-131
Break-even live
UW: 25.0% down · 7.5% · 30yr · 1.5% tax · 5.0% vac · 8.0% maint · 8.0% mgmt
Financing live
Cash to close
- Down payment
- $56,250
- Closing costs
- $6,750
- Reserves months
- —
- Total cash needed
- —
Loan-product check · same deal, 3 products live
Conventional
25% down · 7.5% · 30yr
- Down + closing
- —
- Monthly P&I
- —
- Monthly cashflow
- —
- DSCR
- —
- Eligible?
- —
Personal DTI + credit; lowest rate.
DSCR
20% down · 8.5% · 30yr
- Down + closing
- —
- Monthly P&I
- —
- Monthly cashflow
- —
- DSCR
- —
- Eligible?
- —
No personal income docs; deal must DSCR.
Hard money
10% down · 12.0% · 12mo
- Down + closing
- —
- Monthly P&I
- —
- Monthly cashflow
- —
- DSCR
- —
- Eligible?
- —
Short-term bridge; refi at stabilization.
Rent comps 24 comps
| Address | Beds | Baths | Sqft | Rent | $/sqft | DOM | Units | Dist |
|---|---|---|---|---|---|---|---|---|
| 207 Evelyn St Desoto, TX | 3.0 | 2.0 | 1592 | $1,900 | $1.19 | 43d | 1 | 0.11mi |
| 508 Nora Ln Desoto, TX | 3.0 | 2.0 | 1837 | $2,125 | $1.16 | 43d | 1 | 0.18mi |
| 120 Westmoreland Rd Unit 2201 DeSoto, TX | 2.0 | 2.0 | 949 | $1,899 | $2.00 | 24d | 1 | 0.31mi |
| 426 Newcastle Dr DeSoto, TX | 3.0 | 2.5 | 1834 | $1,600 | $0.87 | 4d | 1 | 0.45mi |
| 720 Nora Ln Desoto, TX | 3.0 | 2.0 | 1733 | $1,950 | $1.13 | 4d | 1 | 0.47mi |
| 928 Eagle Dr Desoto, TX | 4.0 | 2.5 | 1766 | $2,195 | $1.24 | 4d | 1 | 0.77mi |
| 532 Saddle Head Dr Desoto, TX | 3.0 | 2.0 | 1751 | $2,420 | $1.38 | 43d | 1 | 0.85mi |
| 518 N Hampton Rd Desoto, TX | 1.0–3.0 | 1.0–1.5 | 850 | $1,610 | $1.89 | 43d | 1 | 0.89mi |
| 1052 Twin Falls Dr Desoto, TX | 3.0 | 2.0 | 1730 | $1,995 | $1.15 | 43d | 1 | 0.90mi |
| 216 Wesley Dr Desoto, TX | 4.0 | 2.0 | 1769 | $2,299 | $1.30 | 22d | 1 | 0.94mi |
| 221 Connie Dr Desoto, TX | 3.0 | 2.0 | 1755 | $2,095 | $1.19 | 4d | 1 | 0.97mi |
| 115 Brook Hollow Dr Desoto, TX | 3.0 | 2.0 | 1520 | $1,931 | $1.27 | 24d | 1 | 0.98mi |
| 115 Brook Hollow Dr Desoto, TX | 3.0 | 2.0 | 1520 | $1,835 | $1.21 | 20d | 1 | 0.98mi |
| 439 Chestnut Ln Desoto, TX | 3.0 | 2.0 | 1440 | $1,795 | $1.25 | 43d | 1 | 1.09mi |
| 816 Red Bud Dr Desoto, TX | 2.0 | 1.5 | 1216 | $1,350 | $1.11 | 43d | 1 | 1.10mi |
| 434 Chestnut Ln DeSoto, TX | 4.0 | 2.0 | 1258 | $1,950 | $1.55 | 20d | 1 | 1.12mi |
| 432 Chestnut Ln Unit 434 DeSoto, TX | 4.0 | 2.0 | 1258 | $1,950 | $1.55 | 10d | 1 | 1.12mi |
| 432 Chestnut Ln Unit 434 DeSoto, TX | 4.0 | 2.0 | 1258 | $1,950 | $1.55 | 20d | 1 | 1.12mi |
| 522 E Lanett Dr Desoto, TX | 3.0 | 2.0 | 1822 | $2,385 | $1.31 | 43d | 1 | 1.16mi |
| 514 E Belt Line Rd Unit B13 DeSoto, TX | 2.0 | 1.5 | 1106 | $1,550 | $1.40 | 24d | 1 | 1.20mi |
| 632 Mockingbird Ln Desoto, TX | 3.0 | 2.0 | 1783 | $2,400 | $1.35 | 7d | 1 | 1.24mi |
| 912 Oak Trl Desoto, TX | 3.0 | 2.0 | 1722 | $2,000 | $1.16 | 7d | 1 | 1.26mi |
| 511 Amber Ln Desoto, TX | 3.0 | 2.0 | 1353 | $2,200 | $1.63 | 24d | 1 | 1.28mi |
| 828 Haverford Ln Desoto, TX | 3.0 | 2.0 | 1394 | $2,000 | $1.43 | 7d | 1 | 1.39mi |
Listing history 18 events
-
2026-06-18days on market $225,000 Active 106 DOM
-
2026-06-17days on market $225,000 Active 105 DOM
-
2026-06-16days on market $225,000 Active 104 DOM
-
2026-06-15days on market $225,000 Active 103 DOM
-
2026-06-13days on market $225,000 Active 101 DOM
-
2026-06-13days on market $225,000 Active 100 DOM
-
2026-06-09days on market $225,000 Active 97 DOM
-
2026-06-08days on market $225,000 Active 96 DOM
-
2026-06-07days on market $225,000 Active 95 DOM
-
2026-06-04days on market $225,000 Active 92 DOM
-
2026-06-03days on market $225,000 Active 91 DOM
-
2026-06-02days on market $225,000 Active 90 DOM
-
2026-06-01days on market $225,000 Active 89 DOM
-
2026-05-31days on market $225,000 Active 88 DOM
-
2026-03-01$225,000 Active 268-char remark
Show marketing remark (268 chars)
NICE 3 BED 1.5 BATH HOME WITH 2 CAR GARAGE. FRESH PAINT, RECENTLY REPLACED FLOORING.LARGE LIVING AREA OPEN TO KITCHEN. HUGE FENCED YARD IN WELL ESTABLISHED NEIGHBORHOOD. THE HOME IS CURRENTLY RENTED AS INVESTMENT HOME. LEASE EXPIRES JULY 2026. MONTHLY RENT IS $1750.
-
2026-02-28historical
-
2025-11-20$225,000 Active
-
2003-06-10soldstatus
ⓘ Source: listings_history table (triggers on properties + properties_extension) + one-shot
backfill from property_details.listing_events for pre-trigger history.
Tax reassessment forecast TX · Resets to sale price
- Current annual tax
- $5,447 · $454/mo
- Projected year-2 tax
- $5,447 · $454/mo
- Expected delta
- $0/yr ($0/mo · 0.0%)
ⓘ Screening estimate from a state-policy table — verify with the county assessor before closing.
Climate risk First Street
- Flood 1/10 Low FEMA zone X (unshaded) · 0% chance over 30 yrs
- Wildfire 4/10 Moderate
- Heat 7/10 Severe 7 d/yr ≥109°F today · 24 d/yr by 30 yrs out
- Wind 6/10 Major 27% chance of damaging wind over 30 yrs
- Air quality 3/10 Moderate 2 unhealthy d/yr today · 3 by 30 yrs out
Nearby sold comps map
Loading sold comps map…
Walkable amenities ~0.75 mi
Loading nearby amenities…
Taxation est. · year 1
- Rental income
- $24,252
- − Mortgage interest
- −$12,603
- − Property taxes
- −$5,447
- − Insurance
- −$1,125
- − Repairs & maintenance
- −$1,940
- − Management
- −$1,940
- − Depreciation
- −$6,545
- Taxable loss
- −$5,349
- Est. tax savings @ 24.0%
- +$1,284
- After-tax cash flow
- $-288/yr
For passive investors: Depreciation is non-cash, so a rental often shows a tax loss while cash-flowing — sheltering income. Rental losses are passive: they offset passive income freely, and up to $25,000/yr can offset ordinary (W-2) income if you actively participate and your MAGI is under $100k (phasing out to $0 by $150k); unused losses carry forward. On sale, claimed depreciation is recaptured at up to 25%, and gains may owe capital-gains tax (a 1031 exchange can defer both). Figures are a year-1 estimate at your 24.0% rate — not tax advice; consult a CPA.
Schools (NCES district)
- District
- Desoto ISD
- NCES district ID
- 4816860
- Math proficiency
- 14% ▼ -19.00%
- Reading proficiency
- 26% ▼ -8.00%
- Median HH income
- $61,556
- Composite
- 18.98/100
- National rank
- #8851
- State rank
- #754 of 826 in TX
Livability — DeSoto
- Score
- 66/100
- State rank
- #589
- US rank
- #11236
Category grades
Schools grade is shown separately in the Schools card above.
Census & demographics
- Census place
- DeSoto, TX
- County
- Dallas County · 2,612,404 people
- City population
- 56,211
- Metro
- Dallas-Fort Worth-Arlington, TX
- Population (ZIP)
- 56,211
- Household income
- $82,782
- Rent vs Own
- Severe rent burden
- 1867.0
Population outlook (Dallas County) Hauer SSP2
- Today (2025)
- 2,979,839 people
- By 2030
- 3,191,823 · +7.1%
- By 2040
- 3,619,611 · +21.5%
- By 2050
- 4,026,915 · +35.1%
- By 2075
- 4,957,073 · +66.4%
- By 2100
- 5,508,725 · +84.9%
Race, ethnicity, and origin ACS 2023
- Neighborhood character
- Predominantly Black (68%)
- Race & ethnicity
- Black 68% Hispanic / Latino 19% Two or more races 11% White 8%
- Hispanic origin (detail)
- Mexican 17%
- Common ancestry
- Swedish 1%
- Foreign-born
- 9% · Canada, Dominican Republic
- Languages at home
- 83% English-only · Spanish 15% French/Haitian/Cajun 1%
Political lean MEDSL · Dallas
- 2024 margin
- Strong D (+22.2) · D 60.2% · R 38.0% · Other 1.8%
- 2008→2024 swing
- +6.9pp toward D · 2008: 15.3pp · 2024: 22.2pp
- All cycles
- 2024: D+22.2 2020: D+31.6 2016: D+26.2 2012: D+15.4 2008: D+15.3
Not yet ingested
- Civics
- —
Market trends
- HPI YoY
- ▼ -170.49%
- Current HPI
- 272.1565
- Rent YoY
- ▼ -2.60%
- Metro
- Dallas-Fort Worth-Arlington, TX
- State GDP YoY
- ▲ 3.95%
- F500 in state
- 110
Industry mix (Fortune 500 HQ in TX)
| Industry | F500 HQs | Revenue |
|---|---|---|
| Energy | 16 | $1,198B |
|
||
| Technology | 5 | $198B |
|
||
| Engineering / Construction | 4 | $72B |
|
||
| Energy Services | 3 | $60B |
|
||
| Utilities | 3 | $41B |
|
||
| Healthcare | 2 | $330B |
|
||
Price history
+0.0% since first listed4 events — show timeline
- 2026-03-01 Listed $225,000 NTREIS
- 2026-02-28 Listing Removed — NTREIS
- 2025-11-20 Listed $225,000 NTREIS
- 2003-06-10 Sold (Public Records) — Public Records
Property tax history
+4.6%/yrLatest (2025): $5,447 · +7.1% YoY. Source: county tax records.
Cash-flow waterfall
monthlySold comps — $/sqft
last 12 mo · ≤1 miLoading sold comps…