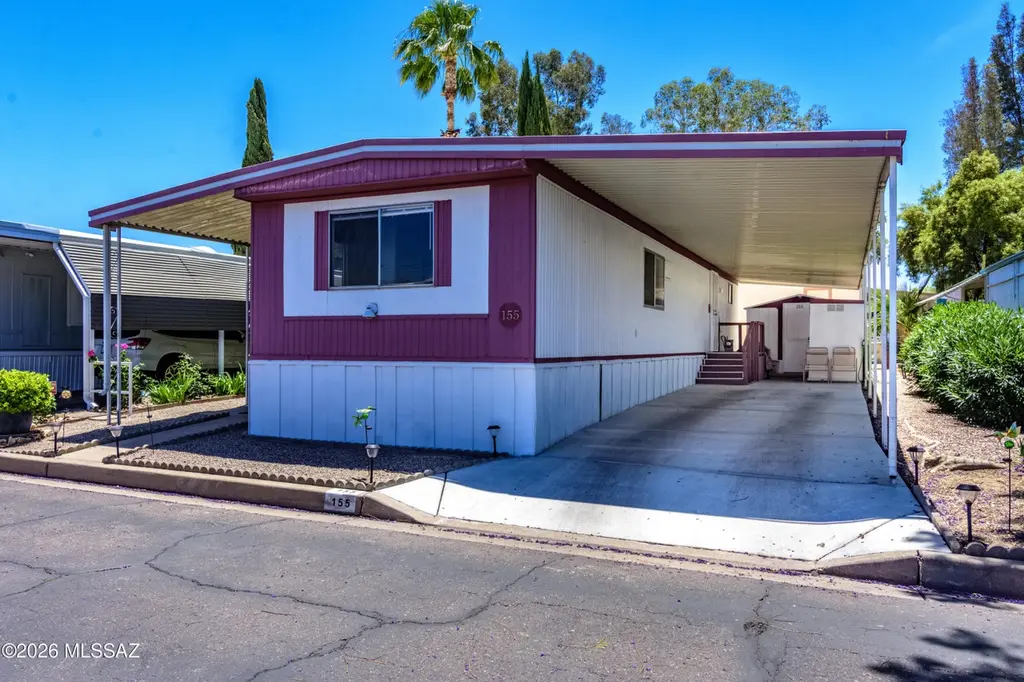
4550 N Flowing Wells Rd #155 · Flowing Wells, AZ
Flood risk 1/10 · Minimal
- FEMA flood zone
- X (unshaded)
- Chance of flooding over 30 yrs
- 0.0%
- Est. flood insurance / yr
- $507 – $1,088
Fire risk 3/10 · Minor
- Est. fire insurance / yr
- $610 – $1,132
Heat risk 8/10 · Major
- Hot days now (above 107°F)
- 5 days/yr
- Hot days in 30 yrs
- 12 days/yr
Wind risk 1/10 · Minimal
- Chance of severe wind over 30 yrs
- —
Air-quality risk 1/10 · Minimal
- Unhealthy air days now
- 0 days/yr
- Unhealthy air days in 30 yrs
- 0 days/yr
Risk factors via First Street. Map © Google.
Why this score? — see what drove the B+ grade
The composite is a weighted blend of 9 inputs, each scored 0–100. Each bar is that input's sub-score; the figure is the points it added to the 100-point composite (weight × sub-score).
- Cash flow +30.0/30.0
- ARV discount +15.0/15.0
- 1% rule +10.0/10.0
- DSCR +10.0/10.0
- Condition / age +4.0/5.0
- Livability +3.7/5.0
- Schools +3.1/10.0
- Rent growth +2.6/5.0
- Appreciation +0.0/10.0
$69,900
🖨 Deal sheet (PDF) 📄 Offer letter ✓ Due diligence
Listing remarks
Well maintained 2 bed/2 bath home located in a gated 55 + community, New interior paint, new awnings, newer HVAC, New upgraded kitchen with upgraded countertop Reverse Osmosis system, farm sink, cabinets have been upgraded. Lots of light from a very large window, vinyl plank flooring and Stainless Steel stove, dishwasher and microwave, huge pantry with lots of storage, newer carpet, 2 large sheds for storage, exterior porch that runs the length of the home, Water, Garbage, Sewer, Property Taxes are included in the land rent, super quiet area, clubhouse, pool located close to shopping, buses, restaurants, do not miss out on this home,
Key facts
- Gated community
- Huge pantry
- Upgraded kitchen
Tags
Property features AI
Finance
- Other: Zoning: Tucson - MU
- HOA & community: Has association; Gated community with shared amenities (pool, spa, fitness center, shuffleboard, pickleball, lake)
Exterior
- Parking: Attached garage; 2 covered/carport spaces
- Security: Smoke detector(s)
- Utilities: Public water; Sewer connected
- Home design: Mobile home; One level; Faces north
- Construction: Metal roof; Kaufman and Broad model
- Exterior features: Shed(s); Paved road access; North/South exposure; Community pool and spa; Shuffleboard and pickleball courts; Fitness center; Gated community; Lake; Paved street
Interior
- Kitchen: Gas oven; Microwave; Dishwasher; Garbage disposal
- Flooring: Carpet; Laminate
- Bathrooms: 2 full bathrooms
- Heating & cooling: Forced air heating; Central air conditioning; Ceiling fans pre-wired
- Interior features: Reverse osmosis water filtration; Exhaust fan; Smoke detectors
- Laundry & utility: Electric dryer hookup
Neighborhood map
What this means for you Summary
Snapshot
- This is a 2-bed/2.0-bath manufactured listed at $70k. Condition is rated good.
Deal economics
- At list price, monthly cash flow is $439 ($5k/yr) — positive.
- The deal already cash-flows at list — no discount required.
- Meets the 1% rule at list price ($1k rent vs $70k).
- Recommended offer: $69k (1.5% below list) — sets the bar for market timing.
- Cap rate 13.8% vs local median 6.1% in Flowing Wells — top-decile yield for the area; either an underpriced asset or a hidden risk that comps aren't pricing in. Stress-test before assuming the spread holds.
Location & tenants
- Location reads 73/100 on livability (#21 in AZ) — a middle-class / working-renter tenant base. Strengths: commute A+, cost of living A+, health & safety A+; Watch: schools D+, crime F, amenities F.
- Amphitheater Unified District (4406) (suburban): math 32% / reading 40% proficiency, ranked #85 of 249 in AZ (top 34%) — families likely to look elsewhere, expect single-tenant / working-renter base with shorter leases.
- Market conditions: Rents flat; 180 active listings in the ZIP; 39 comparable units currently listed for rent nearby; rentals at typical pace (median 25d on market — plan ~3-4 weeks tenant-placement turnaround); 41% of comp listings sitting > 30 days — soft ceiling on asking rent; lower-income renter base — watch delinquency; 5,268 units permitted in Pima County in 2024 (996 in 5+ unit buildings).
- This rent runs 38% of the median local income ($37k/yr) — at the standard rent-burdened threshold; future hikes will face affordability resistance.
Forward outlook
- Local home prices are declining (-3.0%/yr); year-one equity from $483 of loan paydown is wiped out by about $2k of value loss. Plan a longer hold.
- Pima County population projected at +8% by 2050 — modest demand growth; plan on rents tracking national, not racing it.
- At projected returns (-3.0% appreciation + 0.3% rent growth), your $20k cash investment doubles in ~6 years — after that, you're playing with house money.
Negotiation context
- It's been on market 30 days — a 2% lower offer ($69k) is reasonable based on typical stale-listing flexibility.
Risks & watch-outs
- Climate carrying-cost: extreme-heat days projected 5→12/yr by 2055 (HVAC capex compounding) — expect insurance premiums to compound above CPI over the hold.
Questions for the listing agent
- Built in 1978 — when were the roof, HVAC, electrical panel, plumbing, and water heater last replaced?
- Is there a deadline driving the sale (1031 exchange, divorce, estate, relocation)? That informs how much negotiation room exists.
- Schools are D-rated, which usually means shorter tenancies and higher turnover. Who's the typical renter profile here, and what's been the actual vacancy rate?
- Crime grade is F in this area — have there been break-ins, vandalism, or insurance claims at this property in the last 3 years? What carrier currently insures it and at what premium?
- What's the average days-on-market for RENTAL listings here right now (not sales)? A rising rental-DOM trend means longer vacancies and softer asking-rent achievability than the comps imply.
- What's the recent tenant-quality profile in this submarket — average credit score on applications, eviction rate, late-payment / NSF rate, and stable-employment percentage? A property-management company in the area should have these aggregated.
- How much new for-sale + rental construction is in the pipeline within 1–3 miles? Heavy new supply typically softens prices + rents 12–24 months out; constrained supply supports both.
Investment metrics
- 1% rule
- 1.67% ✓
- Cap rate
- 13.83%
- Cash-on-cash
- 26.93%
- DSCR
- 2.20
- GRM
- 5.0
CMA / ARV
- ARV (on-the-fly)
- $134,400
- Comps found
- 12
Show comp detail 12 sales within ~0.75 mi
| Address | Dist | Beds/Ba | Sqft | Sold | Price | $/sf | Match |
|---|---|---|---|---|---|---|---|
| 1257 W Garnette St | 0.41mi | 3/2.5 (+1) | 841 (+0%) | 1mo | $140,000 | $166 | 73 |
| 1218 W Allegheny St | 0.17mi | 2/2.0 | 960 (+14%) | 3mo | $195,000 | $203 | 65 |
| 1537 W Wabash St | 0.41mi | 2/2.0 | 780 (-7%) | 8mo | $150,000 | $192 | 62 |
| 4761 N Brookline Ct | 0.64mi | 2/2.0 | 882 (+5%) | 4mo | $209,900 | $238 | 59 |
| 1358 W Mohawk Dr | 0.30mi | 2/1.0 | 720 (-14%) | 0mo | $115,000 | $160 | 58 |
| 4611 N Camino Feliz | 0.38mi | 2/1.0 | 900 (+7%) | 13mo | $125,000 | $139 | 55 |
| 4737 N Kenwood Ct | 0.58mi | 2/1.0 | 784 (-7%) | 4mo | $199,900 | $255 | 54 |
| 620 W Limberlost Dr #18 | 0.70mi | 2/2.0 | 780 (-7%) | 3mo | $25,000 | $32 | 53 |
| 850 W Limberlost Dr | 0.51mi | 3/1.0 (+1) | 911 (+8%) | 14mo | $118,000 | $130 | 41 |
| 1741 W Wetmore Rd #34 | 0.65mi | 3/2.0 (+1) | 720 (-14%) | 0mo | $19,000 | $26 | 41 |
| 1741 W Wetmore Rd #33 | 0.68mi | 2/2.0 | 720 (-14%) | 5mo | $16,000 | $22 | 40 |
| 1741 W Wetmore Rd #23 | 0.68mi | 3/1.5 (+1) | 720 (-14%) | 8mo | $17,500 | $24 | 30 |
Match score weights: distance 35% · size 25% · config 20% · recency 20%. Top-matched comps best support the ARV.
Projected returns pro-forma
-3.0% appreciation · 0.3% rent growth · sell at horizon
- IRR
- 17.8%
- Equity multiple
- 1.69×
- Total profit
- $13,573
- Equity at exit
- $10,422
- IRR
- 24.2%
- Equity multiple
- 2.83×
- Total profit
- $35,902
- Equity at exit
- $6,044
Cash invested: $19,572 (down + closing). Projections, not guarantees.
Landlord ↔ Tenant lean methodology
- Overall (STATE)
- 87 Strongly Landlord-Friendly
- State Arizona
- 87 Strongly Landlord-Friendly · R+3
- County
- — inherits STATE
- City
- — inherits STATE
ZIP-level market 85705
- Rents YoY
- 0.3%
- Active inventory
- 180
- Price-to-rent
- 5.0×
Monthly cashflow live
- Estimated rent
- $1,167 high interval (Pro) →
- Mortgage (P&I)
- −$367
- Tax est. 1.5%
- −$87 /mo · $1,048/yr
- Insurance
- −$29
- HOA
- −$0
- Vacancy / Maint / Mgmt
- −$245
- Net cashflow
- $439
Break-even live
Sensitivity live
| Price | -10% $487 | -5% $463 | +0% $439 | +5% $415 | +10% $391 |
|---|---|---|---|---|---|
| Rent | -10% $347 | -5% $393 | +0% $439 | +5% $485 | +10% $531 |
| Rate | -1.0pp $474 | -0.5pp $457 | base $439 | +0.5pp $421 | +1.0pp $403 |
UW: 25.0% down · 7.5% · 30yr · 1.5% tax · 5.0% vac · 8.0% maint · 8.0% mgmt
Financing live
Cash to close
- Down payment
- $17,475
- Closing costs
- $2,097
- Reserves months
- —
- Total cash needed
- —
Loan-product check · same deal, 3 products live
Conventional
25% down · 7.5% · 30yr
- Down + closing
- —
- Monthly P&I
- —
- Monthly cashflow
- —
- DSCR
- —
- Eligible?
- —
Personal DTI + credit; lowest rate.
DSCR
20% down · 8.5% · 30yr
- Down + closing
- —
- Monthly P&I
- —
- Monthly cashflow
- —
- DSCR
- —
- Eligible?
- —
No personal income docs; deal must DSCR.
Hard money
10% down · 12.0% · 12mo
- Down + closing
- —
- Monthly P&I
- —
- Monthly cashflow
- —
- DSCR
- —
- Eligible?
- —
Short-term bridge; refi at stabilization.
Rent comps 39 comps
| Address | Beds | Baths | Sqft | Rent | $/sqft | DOM | Units | Dist |
|---|---|---|---|---|---|---|---|---|
| 1326 W Hadley St Tucson, AZ | 1.0 | 1.0 | 900 | $725 | $0.81 | 4d | 1 | 0.32mi |
| 4111 N Flowing Wells Rd Tucson, AZ | 2.0 | 2.0–2.5 | 1131 | $1,625 | $1.44 | 24d | 3 | 0.52mi |
| 1100 W River Rd Unit 7 Tucson, AZ | 2.0 | 2.5 | 1026 | $2,200 | $2.14 | 21d | 1 | 0.63mi |
| 620 W Limberlost Dr Unit E24 Tucson, AZ | 2.0 | 1.0 | 672 | $1,200 | $1.79 | 24d | 1 | 0.66mi |
| 1215 W Roger Rd Unit 1241-04 Tucson, AZ | 2.0 | 1.0 | 770 | $1,100 | $1.43 | 17d | 1 | 0.68mi |
| 1215 W Roger Rd Unit 1201-01 Tucson, AZ | 3.0 | 1.5 | 1000 | $1,595 | $1.59 | 44d | 1 | 0.68mi |
| 1215 W Roger Rd Unit 1241-14 Tucson, AZ | 1.0 | 1.0 | 670 | $895 | $1.34 | 44d | 1 | 0.68mi |
| 1215 W Roger Rd Unit 1201-13 Tucson, AZ | 3.0 | 1.5 | 1000 | $1,595 | $1.59 | 4d | 1 | 0.68mi |
| 1215 W Roger Rd Unit 1215-11 Tucson, AZ | 2.0 | 1.0 | 770 | $1,100 | $1.43 | 4d | 1 | 0.68mi |
| 1355 W Roger Rd Tucson, AZ | 1.0–2.0 | 1.0–2.0 | 627 | $1,084 | $1.73 | 44d | 4 | 0.72mi |
| 5100 N La Canada Dr Tucson, AZ | 1.0 | 1.0 | 686 | $1,343 | $1.96 | 45d | 1 | 0.72mi |
| 5100 N La Canada Dr Tucson, AZ | 2.0 | 2.0 | 938 | $1,408 | $1.50 | 44d | 1 | 0.72mi |
| 1501 W Roger Rd Tucson, AZ | 2.0 | 1.0 | 850 | $995 | $1.17 | 44d | 1 | 0.75mi |
| 4213 N Romero Rd Tucson, AZ | 2.0 | 1.0 | 825 | $1,045 | $1.27 | 44d | 5 | 0.80mi |
| 1865 W La Osa St Tucson, AZ | 2.0 | 1.0 | 821 | $1,450 | $1.77 | 44d | 1 | 0.81mi |
| 3802 N Flowing Wells Rd Tucson, AZ | 1.0–2.0 | 1.0 | 555 | $1,100 | $1.98 | 44d | 5 | 0.87mi |
| 1990 W Amy Pl Unit B Tucson, AZ | 1.0 | 1.0 | 600 | $900 | $1.50 | 21d | 1 | 1.03mi |
| 239 W Limberlost Dr Tucson, AZ | 1.0 | 1.0 | 680 | $795 | $1.17 | 44d | 1 | 1.08mi |
| 822 W Thurber Rd Unit B Tucson, AZ | 2.0 | 1.0 | 750 | $825 | $1.10 | 44d | 1 | 1.11mi |
| 4190 N Western Winds Dr Tucson, AZ | 2.0 | 1.0 | 918 | $1,349 | $1.47 | 24d | 1 | 1.12mi |
| 4190 N Western Winds Dr Tucson, AZ | 2.0 | 1.0 | 918 | $1,349 | $1.47 | 44d | 1 | 1.12mi |
| 532 W Simmons Rd Tucson, AZ | 1.0 | 1.0 | 566 | $1,000 | $1.77 | 18d | 1 | 1.13mi |
| 115 W Limberlost Dr Tucson, AZ | 1.0–2.0 | 1.0–2.0 | 806 | $1,350 | $1.67 | 24d | 1 | 1.19mi |
| 1700 W Prince Rd Tucson, AZ | 1.0–2.0 | 1.0 | 618 | $1,099 | $1.78 | 2d | 25 | 1.19mi |
| 557 W Thurber Rd Tucson, AZ | 2.0 | 1.0 | 800 | $1,050 | $1.31 | 44d | 3 | 1.22mi |
| 570 W Prince Rd Tucson, AZ | 1.0–2.0 | 1.0 | 788 | $975 | $1.24 | 44d | 13 | 1.27mi |
| 331 W Pastime Rd Tucson, AZ | 2.0 | 2.0 | 850 | $1,082 | $1.27 | 12d | 2 | 1.29mi |
| 60 W Stone Loop Tucson, AZ | 2.0 | 1.0 | 588 | $1,395 | $2.37 | 3d | 46 | 1.31mi |
| 520 W Prince Rd Tucson, AZ | 1.0–2.0 | 1.0 | 557 | $1,076 | $1.93 | 4d | 16 | 1.32mi |
| 311 W Pastime Rd Tucson, AZ | 1.0 | 1.0 | 720 | $995 | $1.38 | 22d | 1 | 1.33mi |
| 1448 W Kilburn St Tucson, AZ | 2.0 | 1.0 | 910 | $1,350 | $1.48 | 44d | 1 | 1.33mi |
| 1925 W River Rd Tucson, AZ | 1.0–3.0 | 1.0–2.0 | 1049 | $1,856 | $1.77 | 2d | 32 | 1.33mi |
| 3985 N Stone Ave Tucson, AZ | 1.0–2.0 | 1.0–2.0 | 625 | $1,075 | $1.72 | 17d | 21 | 1.36mi |
| 3985 N Stone Ave Tucson, AZ | 1.0–2.0 | 1.0–2.0 | 625 | $1,280 | $2.05 | 44d | 1 | 1.36mi |
| 3985 N Stone Ave Unit 248 Tucson, AZ | 2.0 | 1.0 | 700 | $979 | $1.40 | 12d | 1 | 1.37mi |
| 124 W Pastime Rd Tucson, AZ | 2.0 | 1.0 | 650 | $1,075 | $1.65 | 4d | 1 | 1.42mi |
| 50 W King Rd Unit 09 Tucson, AZ | 1.0 | 1.0 | 600 | $775 | $1.29 | 4d | 1 | 1.49mi |
| 50 W King Rd Apt 11 Tucson, AZ | 1.0 | 1.0 | 650 | $795 | $1.22 | 21d | 1 | 1.49mi |
| 269 E Calle Arizona Tucson, AZ | 2.0 | 1.0 | 800 | $1,195 | $1.49 | 4d | 1 | 1.50mi |
Listing history 16 events
-
2026-06-21days on market $69,900 Active 30 DOM
-
2026-06-18days on market $69,900 Active 27 DOM
-
2026-06-17days on market $69,900 Active 26 DOM
-
2026-06-16days on market $69,900 Active 25 DOM
-
2026-06-15days on market $69,900 Active 24 DOM
-
2026-06-13days on market $69,900 Active 22 DOM
-
2026-06-10days on market $69,900 Active 19 DOM
-
2026-06-09days on market $69,900 Active 18 DOM
-
2026-06-08days on market $69,900 Active 17 DOM
-
2026-06-07days on market $69,900 Active 16 DOM
-
2026-06-05days on market $69,900 Active 13 DOM
-
2026-06-03days on market $69,900 Active 12 DOM
-
2026-06-02days on market $69,900 Active 11 DOM
-
2026-06-01days on market $69,900 Active 10 DOM
-
2026-05-31days on market $69,900 Active 9 DOM
-
2026-05-22$69,900 Active
ⓘ Source: listings_history table (triggers on properties + properties_extension) + one-shot
backfill from property_details.listing_events for pre-trigger history.
Climate risk First Street
- Flood 1/10 Low FEMA zone X (unshaded) · 0% chance over 30 yrs
- Wildfire 3/10 Moderate
- Heat 8/10 Severe 5 d/yr ≥107°F today · 12 d/yr by 30 yrs out
- Wind 1/10 Low
- Air quality 1/10 Low 0 unhealthy d/yr today · 0 by 30 yrs out
Nearby sold comps map
Loading sold comps map…
Walkable amenities ~0.75 mi
Loading nearby amenities…
Taxation est. · year 1
- Rental income
- $14,008
- − Mortgage interest
- −$3,915
- − Property taxes
- −$1,048
- − Insurance
- −$350
- − Repairs & maintenance
- −$1,121
- − Management
- −$1,121
- − Depreciation
- −$2,033
- Taxable income
- $4,420
- Est. tax owed @ 24.0%
- −$1,061
- After-tax cash flow
- $4,209/yr
For passive investors: Depreciation is non-cash, so a rental often shows a tax loss while cash-flowing — sheltering income. Rental losses are passive: they offset passive income freely, and up to $25,000/yr can offset ordinary (W-2) income if you actively participate and your MAGI is under $100k (phasing out to $0 by $150k); unused losses carry forward. On sale, claimed depreciation is recaptured at up to 25%, and gains may owe capital-gains tax (a 1031 exchange can defer both). Figures are a year-1 estimate at your 24.0% rate — not tax advice; consult a CPA.
Condition & rehab AI · 30 photos
This well-maintained 2-bedroom, 2-bathroom home in a gated 55+ community offers a good investment opportunity with upgrades and a good condition score.
Value-add opportunities
- Both Paint exterior — Enhances curb appeal and value
- Both Replace carpet — Improves comfort and value
- Both Upgrade lighting — Enhances ambiance and value
Renovation cost estimate screening
Value-add ROI direction
- Both Paint exterior — Enhances curb appeal and value ↑
- Both Replace carpet — Improves comfort and value ↑
- Both Upgrade lighting — Enhances ambiance and value ↑
ⓘ Cost ranges are severity-bucket heuristics (US national rule-of-thumb). Get contractor quotes + a written scope before underwriting a rehab budget.
Schools (NCES district)
- District
- Amphitheater Unified District (4406)
- NCES district ID
- 0400680
- Math proficiency
- 32% ▼ -13.00%
- Reading proficiency
- 40% ▼ -8.00%
- Median HH income
- $46,524
- Composite
- 30.82/100
- National rank
- #6135
- State rank
- #85 of 249 in AZ
Livability — Flowing Wells
- Score
- 73/100
- State rank
- #21
- US rank
- #5288
Category grades
Schools grade is shown separately in the Schools card above.
Census & demographics
- Census place
- Flowing Wells, AZ
- County
- Pima County · 1,012,107 people
- Metro
- Tucson, AZ
- Population (ZIP)
- 54,700
- Household income
- $37,194
- Rent vs Own
- Severe rent burden
- 4240.0
Population outlook (Pima County) Hauer SSP2
- Today (2025)
- 1,066,056 people
- By 2030
- 1,086,684 · +1.9%
- By 2040
- 1,117,160 · +4.8%
- By 2050
- 1,149,778 · +7.9%
- By 2075
- 1,271,480 · +19.3%
- By 2100
- 1,321,160 · +23.9%
Race, ethnicity, and origin ACS 2023
- Neighborhood character
- Diverse neighborhood (Simpson 0.63)
- Race & ethnicity
- Hispanic / Latino 45% White 41% Two or more races 18% Asian 4% Black 3% Native American 3%
- Hispanic origin (detail)
- Mexican 41%
- Common ancestry
- Portuguese 2% Romanian 2% Lithuanian 2%
- Foreign-born
- 18% · Canada, China, Vietnam
- Languages at home
- 65% English-only · Spanish 30% Chinese 1% Vietnamese 1%
Political lean MEDSL · Pima
- 2024 margin
- D (+15.2) · D 57.0% · R 41.8% · Other 1.2%
- 2008→2024 swing
- +9.1pp toward D · 2008: 6.1pp · 2024: 15.2pp
- All cycles
- 2024: D+15.2 2020: D+18.7 2016: D+13.5 2012: D+5.8 2008: D+6.1
Not yet ingested
- Civics
- —
Market trends
- HPI YoY
- ▼ -163.31%
- Current HPI
- 283.0647
- Rent YoY
- ▲ 0.30%
- Metro
- Tucson, AZ
- State GDP YoY
- ▲ 4.54%
- F500 in state
- 20
Industry mix (Fortune 500 HQ in AZ)
| Industry | F500 HQs | Revenue |
|---|---|---|
| Technology | 2 | $13B |
|
||
| Mining / Metals | 1 | $23B |
|
||
| Environmental Services | 1 | $16B |
|
||
| Metals / Steel | 1 | $14B |
|
||
| Technology Distribution | 1 | $9B |
|
||
| Homebuilding | 1 | $8B |
|
||
Price history
1 event — show timeline
- 2026-05-22 Listed $69,900 MLSSAZ
Cash-flow waterfall
monthlySold comps — $/sqft
last 12 mo · ≤1 miLoading sold comps…