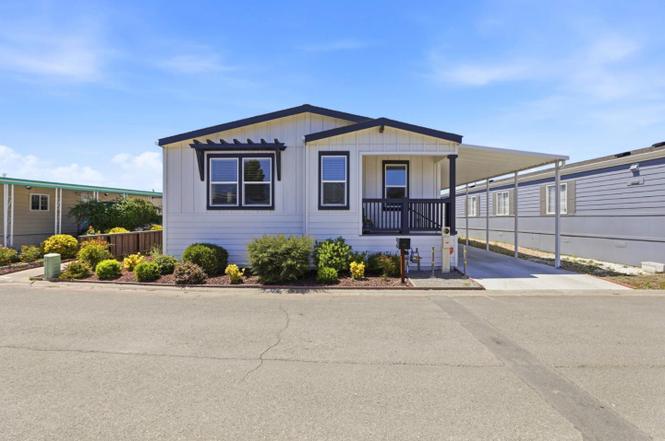
1220 Tasman Dr #399 · Sunnyvale, CA
Flood risk 3/10 · Minor
- FEMA flood zone
- X
- Chance of flooding over 30 yrs
- 0.2%
- Est. flood insurance / yr
- $507 – $1,088
Fire risk 1/10 · Minimal
- Est. fire insurance / yr
- $659 – $1,223
Heat risk 5/10 · Moderate
- Hot days now (above 91°F)
- 7 days/yr
- Hot days in 30 yrs
- 15 days/yr
Wind risk 1/10 · Minimal
- Chance of severe wind over 30 yrs
- —
Air-quality risk 7/10 · Major
- Unhealthy air days now
- 13 days/yr
- Unhealthy air days in 30 yrs
- 13 days/yr
Risk factors via First Street. Map © Google.
Why this score? — see what drove the D grade
The composite is a weighted blend of 9 inputs, each scored 0–100. Each bar is that input's sub-score; the figure is the points it added to the 100-point composite (weight × sub-score).
- Cash flow +14.3/30.0
- Schools +5.3/10.0
- DSCR +4.3/10.0
- Livability +4.1/5.0
- 1% rule +4.0/10.0
- Condition / age +4.0/5.0
- Appreciation +3.2/10.0
- Rent growth +3.2/5.0
- ARV discount +0.0/15.0
$549,000
🖨 Deal sheet 📄 Offer letter ✓ Due diligence
Listing remarks MLS
Experience an incredible opportunity to own a like-new home in the heart of Silicon Valley within the highly desirable, family-friendly Adobe Wells community. This beautifully customized 3 bedroom, 3 bathroom home offers a unique floor plan designed for modern living. The open-concept layout seamlessly connects the living, dining, and kitchen areas, creating the perfect space for both everyday comfort and entertaining. The chef-inspired kitchen features quartz countertops, a large center island with breakfast bar seating, premium cabinetry, a microwave pantry, stainless steel appliances, and expansive dual-pane windows that fill the home with natural light. Privately situated at the rear of the home, the spacious primary suite offers a large walk-in closet, dual quartz vanities, and an upgraded walk-in shower. A second primary suite provides ample closet space and its own private updated bathroom, making it ideal for guests or multigenerational living. Additional features include central air conditioning, an EV charger, Ring security system, storage shed, and all appliances included. Enjoy resort-style community amenities just steps away, including the greenbelt, basketball and tennis courts, a clubhouse, swimming pool, spa, fitness center, and so much more.
Key facts
- Large center island
- Dual quartz vanities
- Premium cabinetry
Tags
Property features AI
Finance
- Other: Age restrictions: no restrictions (board and neighborhood approval may apply); Pets: rules vary (dogs permitted, number restrictions may apply); Listing subject to board approval
- Financial info: Park home site on leased land; unit will remain
- HOA & community: Community amenities include clubhouse, community pool, gym/exercise facility, playground, tennis courts, game courts, billiard room, recreation room, putting green, garden/greenbelt/trails, car wash area, common utility room, RV/boat storage
Exterior
- Parking: Carport parking (3 minimum); Covered parking; Tandem parking; Common parking area; Guest/visitor parking; Assigned space number 399
- Security: Safe/panic room
- Utilities: Individual water meter; Water on site; Sewer (public) and connected; Individual electric meters; Individual gas meters; Primary meter
- Home design: Manufactured/mobile home (park home); Living area approximately 1,736
- Construction: Shingle/composition roof
- Exterior features: Composition/shingle roof; Leased land (park home site will remain); Directions: Enter the community, continue straight, turn right at the stop sign toward the clubhouse; home is directly across from the clubhouse on the right
Interior
- Kitchen: Granite and other countertops; Island; Pantry cabinet; Gas oven/range; Microwave; Dishwasher; Garbage disposal; Range hood; Exhaust fan; Refrigerator included; Gas hookups available
- Bedrooms: 3 bedrooms (one on the ground floor); Walk-in closet
- Flooring: Laminate flooring; Tile flooring; Vinyl/linoleum flooring
- Bathrooms: 3 full bathrooms; Double sinks; Granite and solid-surface counters; Stall shower and tub; Tile and stone finishes; Updated bathrooms
- Heating & cooling: Central forced air heating; Central forced air cooling; Other cooling features (see remarks)
- Interior features: High ceilings; Safe/panic room; Kitchen and family room combined; Breakfast bar and eat-in kitchen
- Laundry & utility: Washer/dryer hookups only; Laundry room
Neighborhood map
What this means for you Summary
Snapshot
- This is a 3-bed/3.0-bath manufactured listed at $549k. Condition is rated good.
Deal economics
- At list price, monthly cash flow is $100 ($1k/yr) — positive.
- The deal already cash-flows at list — no discount required.
- To meet the 1% rule (rent ≥ 1% of price), the offer needs to be $493k (10.2% below list).
- Recommended offer: $493k (10.2% below list) — sets the bar for 1% rule.
- Cap rate 6.5% vs local median 1.2% in Sunnyvale — top-decile yield for the area; either an underpriced asset or a hidden risk that comps aren't pricing in. Stress-test before assuming the spread holds.
Location & tenants
- Location reads 82/100 on livability (#37 in CA, #1,258 nationally) — a professional / high-income tenant draw. Strengths: amenities A+, commute A+, employment A+; Watch: cost of living F.
- Santa Clara Unified (urban): math 49% / reading 66% proficiency, ranked #75 of 517 in CA (top 14%) — acceptable for families but not a draw, mixed tenant base, ~2y average lease.
- Zoned schools: George Mayne Elementary (300 students, 65% FRL); Adrian Wilcox High (math 55% / reading 72%, grade B-, #182 of 1,170 statewide, top 16%, 1,859 students, 40% FRL) — zoned schools average 52% FRL vs 33% district-wide (20 pts higher); higher-poverty schools than district average — tighter screening recommended.
- Market conditions: Rents rising (+2.6%/yr); 69 active listings in the ZIP; 13 comparable units currently listed for rent nearby; rentals leasing fast (median 2d on market — plan ~1-2 weeks tenant-placement turnaround); high-income renter base; 3,838 units permitted in Santa Clara County in 2024 (1,886 in 5+ unit buildings).
- This rent runs 37% of the median local income ($158k/yr) — at the standard rent-burdened threshold; future hikes will face affordability resistance.
Forward outlook
- Local home prices are declining (-3.0%/yr); year-one equity from $4k of loan paydown is wiped out by about $16k of value loss. Plan a longer hold.
- Santa Clara County population projected at +24% by 2050 — long-run rental-demand tailwind backs the buy-and-hold thesis.
Negotiation context
- Only 8 days on market — expect competitive offers; lowballing is unlikely to land.
- 2 sale attempts with the ask held roughly flat each time — persistent listings suggest the price (not the market) is what's stuck; bring a comps-based counter.
Risks & watch-outs
- Climate carrying-cost: extreme-heat days projected 7→15/yr by 2055 (HVAC capex compounding) — expect insurance premiums to compound above CPI over the hold.
Questions for the listing agent
- Is there a deadline driving the sale (1031 exchange, divorce, estate, relocation)? That informs how much negotiation room exists.
- Schools are B-rated — typically a magnet for longer-tenancy family renters. What's the average tenant stay here, and is there a school-zone premium baked into asking?
- The area grade is low — what's the realistic commute time and amenity access for the typical tenant pool here? Any planned neighborhood developments (good or bad) we should know about?
- What's the average days-on-market for RENTAL listings here right now (not sales)? A rising rental-DOM trend means longer vacancies and softer asking-rent achievability than the comps imply.
- What's the recent tenant-quality profile in this submarket — average credit score on applications, eviction rate, late-payment / NSF rate, and stable-employment percentage? A property-management company in the area should have these aggregated.
- How much new for-sale + rental construction is in the pipeline within 1–3 miles? Heavy new supply typically softens prices + rents 12–24 months out; constrained supply supports both.
Investment metrics
- 1% rule
- 0.90% ✗
- Cap rate
- 6.51%
- Cash-on-cash
- 0.78%
- DSCR
- 1.03
- GRM
- 9.3
CMA / ARV
- ARV (on-the-fly)
- $387,128
- Comps found
- 12
Show comp detail 12 sales within ~0.75 mi
| Address | Dist | Beds/Ba | Sqft | Sold | Price | $/sf | Match |
|---|---|---|---|---|---|---|---|
| 1220 Vienna Dr #707 | 0.35mi | 3/2.0 | 1,716 (-1%) | 2mo | $287,000 | $167 | 76 |
| 1225 Vienna Dr #336 | 0.56mi | 3/3.0 | 1,755 (+1%) | 0mo | $428,000 | $244 | 72 |
| 1085 Tasman Dr #620 | 0.48mi | 3/2.0 | 1,725 (-1%) | 1mo | $399,000 | $231 | 72 |
| 1225 Vienna Dr #141 | 0.49mi | 3/2.0 | 1,738 (+0%) | 2mo | $380,000 | $219 | 72 |
| 1225 Vienna Dr #604 | 0.42mi | 4/2.0 (+1) | 1,740 (+0%) | 1mo | $320,000 | $184 | 71 |
| 1085 Tasman Dr #496 | 0.48mi | 3/2.0 | 1,780 (+2%) | 2mo | $405,000 | $228 | 68 |
| 1085 Tasman Dr #225 | 0.48mi | 3/2.0 | 1,790 (+3%) | 1mo | $400,000 | $223 | 67 |
| 1225 Vienna Dr #937 | 0.49mi | 3/2.0 | 1,795 (+3%) | 2mo | $400,000 | $223 | 66 |
| 1225 Vienna Dr #44 | 0.49mi | 3/2.0 | 1,658 (-4%) | 1mo | $349,000 | $210 | 65 |
| 1225 Vienna Dr #114 | 0.42mi | 3/2.0 | 1,600 (-8%) | 2mo | $380,000 | $238 | 62 |
| 1225 Vienna Dr #150 | 0.49mi | 3/2.0 | 1,521 (-12%) | 3mo | $374,000 | $246 | 50 |
| 1225 Vienna Dr #925 | 0.49mi | 2/2.0 (-1) | 1,490 (-14%) | 1mo | $305,000 | $205 | 44 |
Match score weights: distance 35% · size 25% · config 20% · recency 20%. Top-matched comps best support the ARV.
Projected returns pro-forma
-3.0% appreciation · 2.63% rent growth · sell at horizon
- IRR
- -15.5%
- Equity multiple
- 0.45×
- Total profit
- $-84,339
- Equity at exit
- $81,858
- IRR
- -7.6%
- Equity multiple
- 0.53×
- Total profit
- $-72,374
- Equity at exit
- $47,467
Cash invested: $153,720 (down + closing). Projections, not guarantees.
Landlord ↔ Tenant lean methodology
- Overall (STATE)
- 18 Strongly Tenant-Friendly
- State California
- 18 Strongly Tenant-Friendly · D+13
- County
- — inherits STATE
- City
- — inherits STATE
ZIP-level market 94089
- Home prices YoY
- -1.1%
- Rents YoY
- 2.6%
- Active inventory
- 69
- Price-to-rent
- 9.3×
Monthly cashflow live
- Estimated rent
- $4,929 high interval (Pro) →
- Mortgage (P&I)
- −$2,879
- Tax est. 1.5%
- −$686 /mo · $8,235/yr
- Insurance
- −$229
- HOA
- −$0
- Vacancy / Maint / Mgmt
- −$1,035
- Net cashflow
- $100
Break-even live
UW: 25.0% down · 7.5% · 30yr · 1.5% tax · 5.0% vac · 8.0% maint · 8.0% mgmt
Financing live
Cash to close
- Down payment
- $137,250
- Closing costs
- $16,470
- Reserves months
- —
- Total cash needed
- —
Loan-product check · same deal, 3 products live
Conventional
25% down · 7.5% · 30yr
- Down + closing
- —
- Monthly P&I
- —
- Monthly cashflow
- —
- DSCR
- —
- Eligible?
- —
Personal DTI + credit; lowest rate.
DSCR
20% down · 8.5% · 30yr
- Down + closing
- —
- Monthly P&I
- —
- Monthly cashflow
- —
- DSCR
- —
- Eligible?
- —
No personal income docs; deal must DSCR.
Hard money
10% down · 12.0% · 12mo
- Down + closing
- —
- Monthly P&I
- —
- Monthly cashflow
- —
- DSCR
- —
- Eligible?
- —
Short-term bridge; refi at stabilization.
Rent comps 13 comps
| Address | Beds | Baths | Sqft | Rent | $/sqft | DOM | Units | Dist |
|---|---|---|---|---|---|---|---|---|
| 1271 Lawrence Station Rd Sunnyvale, CA | 1.0–2.0 | 1.0–2.5 | 1417 | $5,197 | $3.67 | 1d | 7 | 0.41mi |
| 1235 Wildwood Ave Sunnyvale, CA | 1.0–3.0 | 1.0–2.0 | 910 | $3,377 | $3.71 | 1d | 12 | 0.72mi |
| 1220 N Fair Oaks Ave Sunnyvale, CA | 1.0–2.0 | 1.0–2.0 | 887 | $4,780 | $5.39 | 1d | 4 | 0.93mi |
| 621 Tasman Dr Sunnyvale, CA | 1.0–2.0 | 1.0–2.0 | 959 | $4,557 | $4.75 | 1d | 9 | 0.94mi |
| 1257 Lakeside Dr Sunnyvale, CA | 3.0 | 1.0–3.0 | 903 | $5,075 | $5.62 | 1d | 1 | 0.96mi |
| 568 Saco Ter Sunnyvale, CA | 4.0 | 3.0 | 1720 | $5,200 | $3.02 | 1d | 1 | 1.08mi |
| 1171 La Rochelle Ter Unit G Sunnyvale, CA | 3.0 | 2.5 | 2156 | $5,200 | $2.41 | 1d | 1 | 1.13mi |
| 550 E Weddell Dr Sunnyvale, CA | 1.0–3.0 | 1.0–2.0 | 1255 | $5,966 | $4.75 | 1d | 8 | 1.17mi |
| 1030 Indian Wells Ave Sunnyvale, CA | 1.0–2.0 | 1.0–2.0 | 1039 | $6,915 | $6.66 | 1d | 1 | 1.23mi |
| 1063 Morse Ave Sunnyvale, CA | 1.0–2.0 | 1.0–2.0 | 844 | $5,014 | $5.94 | 1d | 14 | 1.37mi |
| 781 N Fair Oaks Ave #6 Sunnyvale, CA | 3.0 | 2.0 | 1134 | $3,795 | $3.35 | 16d | 1 | 1.44mi |
| 2333 Calle del Mundo Santa Clara, CA | 1.0–3.0 | 1.0–2.0 | 991 | $6,214 | $6.27 | 1d | 15 | 1.45mi |
| 4768 Cheeney St Santa Clara, CA | 4.0 | 3.0 | 2223 | $5,199 | $2.34 | 43d | 1 | 1.46mi |
Listing history 7 events
-
2026-06-18days on market $549,000 Active 8 DOM
-
2026-06-17days on market $549,000 Active 7 DOM
-
2026-06-16days on market $549,000 Active 6 DOM
-
2026-06-15days on market $549,000 Active 5 DOM
-
2026-06-13days on market $549,000 Active 3 DOM
-
2026-06-13remarks 699-char remark
-
2026-06-13$549,000 Active 2 DOM
ⓘ Source: listings_history table (triggers on properties + properties_extension) + one-shot
backfill from property_details.listing_events for pre-trigger history.
Climate risk First Street
- Flood 3/10 Moderate FEMA zone X · 20% chance over 30 yrs
- Wildfire 1/10 Low
- Heat 5/10 Major 7 d/yr ≥91°F today · 15 d/yr by 30 yrs out
- Wind 1/10 Low
- Air quality 7/10 Severe 13 unhealthy d/yr today · 13 by 30 yrs out
Nearby sold comps map
Loading sold comps map…
Walkable amenities ~0.75 mi
Loading nearby amenities…
Taxation est. · year 1
- Rental income
- $59,151
- − Mortgage interest
- −$30,753
- − Property taxes
- −$8,235
- − Insurance
- −$2,745
- − Repairs & maintenance
- −$4,732
- − Management
- −$4,732
- − Depreciation
- −$15,971
- Taxable loss
- −$8,016
- Est. tax savings @ 24.0%
- +$1,924
- After-tax cash flow
- $3,125/yr
For passive investors: Depreciation is non-cash, so a rental often shows a tax loss while cash-flowing — sheltering income. Rental losses are passive: they offset passive income freely, and up to $25,000/yr can offset ordinary (W-2) income if you actively participate and your MAGI is under $100k (phasing out to $0 by $150k); unused losses carry forward. On sale, claimed depreciation is recaptured at up to 25%, and gains may owe capital-gains tax (a 1031 exchange can defer both). Figures are a year-1 estimate at your 24.0% rate — not tax advice; consult a CPA.
Condition & rehab AI · 13 photos
This well-maintained, move-in-ready manufactured home in Sunnyvale, CA, offers a modern floor plan and high-end finishes, making it an excellent investment opportunity.
Value-add opportunities
- Both Paint exterior — Enhances curb appeal and resale value
- Both Trim landscaping — Improves curb appeal and rental value
Renovation cost estimate screening
Value-add ROI direction
- Both Paint exterior — Enhances curb appeal and resale value ↑
- Both Trim landscaping — Improves curb appeal and rental value ↑
ⓘ Cost ranges are severity-bucket heuristics (US national rule-of-thumb). Get contractor quotes + a written scope before underwriting a rehab budget.
Schools (NCES district)
- District
- Santa Clara Unified
- NCES district ID
- 0635430
- Math proficiency
- 49% ▼ -3.00%
- Reading proficiency
- 66% ▲ 4.00%
- Median HH income
- $97,320
- Composite
- 53.46/100
- National rank
- #1459
- State rank
- #75 of 517 in CA
Livability — Sunnyvale
- Score
- 82/100
- State rank
- #37
- US rank
- #1258
Category grades
Schools grade is shown separately in the Schools card above.
Census & demographics
- Census place
- Sunnyvale, CA
- County
- Santa Clara County · 1,806,974 people
- City population
- 154,236
- Metro
- San Jose-Sunnyvale-Santa Clara, CA
- Population (ZIP)
- 22,699
- Household income
- $158,304
- Rent vs Own
- Severe rent burden
- 558.0
Population outlook (Santa Clara County) Hauer SSP2
- Today (2025)
- 2,179,074 people
- By 2030
- 2,301,297 · +5.6%
- By 2040
- 2,528,195 · +16.0%
- By 2050
- 2,712,135 · +24.5%
- By 2075
- 2,998,701 · +37.6%
- By 2100
- 2,931,429 · +34.5%
Race, ethnicity, and origin ACS 2023
- Neighborhood character
- Diverse neighborhood (Simpson 0.68)
- Race & ethnicity
- Asian 45% White 24% Hispanic / Latino 24% Two or more races 9% Black 2%
- Hispanic origin (detail)
- Mexican 17%
- Common ancestry
- Scotch-Irish 2% Lithuanian 1% Estonian 1%
- Foreign-born
- 51% · Canada, China, Vietnam
- Languages at home
- 40% English-only · Spanish 18% Chinese 12% Other Asian/Pacific 8%
Political lean MEDSL · Santa Clara
- 2024 margin
- Solid D (+40.0) · D 68.1% · R 28.1% · Other 3.8%
- 2008→2024 swing
- -0.9pp no change · 2008: 40.9pp · 2024: 40.0pp
- All cycles
- 2024: D+40.0 2020: D+47.4 2016: D+52.5 2012: D+42.1 2008: D+40.9
Not yet ingested
- Civics
- —
Market trends
- HPI YoY
- ▼ -3.70%
- Current HPI
- 338.6935
- Rent YoY
- ▲ 2.63%
- Metro
- San Jose-Sunnyvale-Santa Clara, CA
- State GDP YoY
- ▲ 3.21%
- F500 in state
- 116
Industry mix (Fortune 500 HQ in CA)
| Industry | F500 HQs | Revenue |
|---|---|---|
| Technology | 27 | $1,492B |
|
||
| Financial Services | 3 | $174B |
|
||
| Retail | 3 | $44B |
|
||
| Insurance | 3 | $26B |
|
||
| Media / Entertainment | 2 | $115B |
|
||
| Pharmaceuticals / Biotech | 2 | $62B |
|
||
Price history
+0.0% since first listed2 events — show timeline
- 2026-06-10 Listed $549,000 MLSListings
- 2026-06-10 Listed $549,000 bridgeMLS, Bay East AOR, or Contra Costa AOR
Cash-flow waterfall
monthlySold comps — $/sqft
last 12 mo · ≤1 miLoading sold comps…