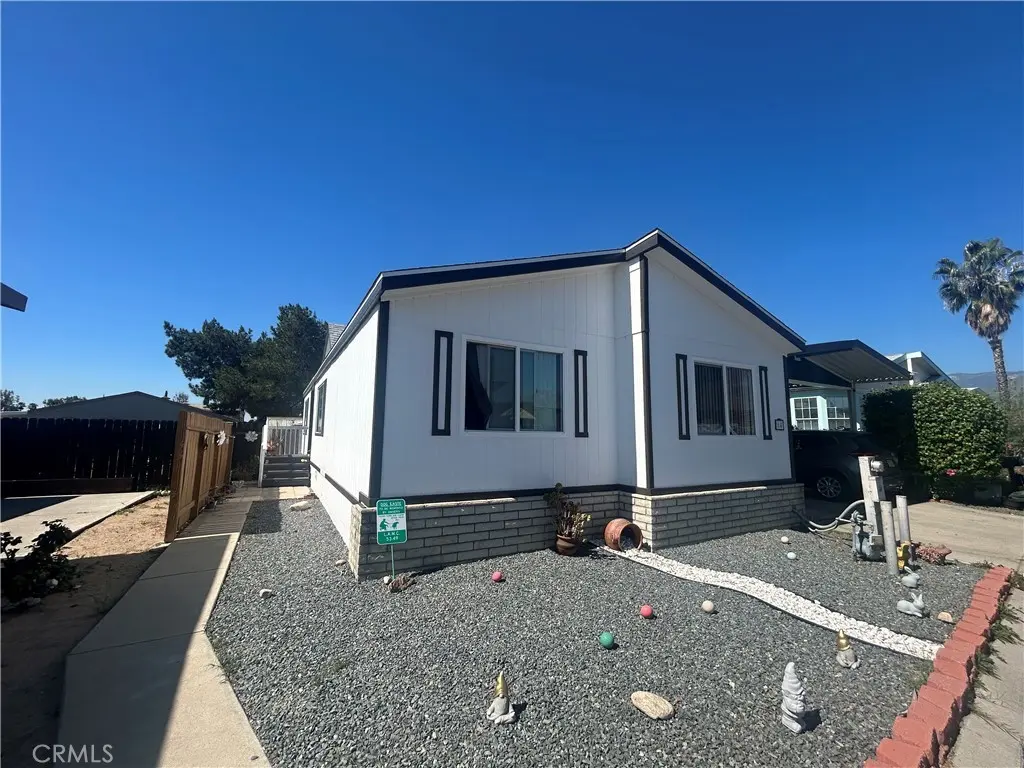
7717 Church Ave #64 · Highland, CA
Flood risk 1/10 · Minimal
- FEMA flood zone
- X
- Chance of flooding over 30 yrs
- 0.0%
- Est. flood insurance / yr
- $507 – $1,088
Fire risk 8/10 · Major
- Est. fire insurance / yr
- $659 – $1,223
Heat risk 8/10 · Major
- Hot days now (above 101°F)
- 6 days/yr
- Hot days in 30 yrs
- 19 days/yr
Wind risk 1/10 · Minimal
- Chance of severe wind over 30 yrs
- —
Air-quality risk 10/10 · Severe
- Unhealthy air days now
- 29 days/yr
- Unhealthy air days in 30 yrs
- 35 days/yr
Risk factors via First Street. Map © Google.
Why this score? — see what drove the C+ grade
The composite is a weighted blend of 9 inputs, each scored 0–100. Each bar is that input's sub-score; the figure is the points it added to the 100-point composite (weight × sub-score).
- Cash flow +30.0/30.0
- DSCR +10.0/10.0
- 1% rule +8.6/10.0
- Rent growth +3.2/5.0
- Schools +3.1/10.0
- Livability +3.0/5.0
- Condition / age +2.5/5.0
- ARV discount +2.0/15.0
- Appreciation +0.0/10.0
$184,999
🖨 Deal sheet 📄 Offer letter ✓ Due diligence
Key facts
- 2 parking spots
- Community pool
- Built 1998
Neighborhood map
What this means for you Summary
Snapshot
- This is a 3-bed/2.0-bath manufactured listed at $185k.
Deal economics
- At list price, monthly cash flow is $715 ($9k/yr) — positive.
- The deal already cash-flows at list — no discount required.
- Meets the 1% rule at list price ($3k rent vs $185k).
- Recommended offer: $174k (6.0% below list) — sets the bar for market timing.
- Cap rate 10.9% vs local median 2.9% in Highland — top-decile yield for the area; either an underpriced asset or a hidden risk that comps aren't pricing in. Stress-test before assuming the spread holds.
Location & tenants
- Location reads 59/100 on livability (#618 in CA) — a working-class tenant base; expect higher turnover. Strengths: housing A-; Watch: schools C-, commute D+, crime D-.
- San Bernardino City Unified (urban): math 27% / reading 40% proficiency, ranked #959 of 1,400 in CA (top 68%) — families likely to look elsewhere, expect single-tenant / working-renter base with shorter leases; 81% free/reduced lunch — lower-income household profile, screen leases tightly.
- Market conditions: Rents rising (+2.9%/yr); 147 active listings in the ZIP; 19 comparable units currently listed for rent nearby; rentals at typical pace (median 24d on market — plan ~3-4 weeks tenant-placement turnaround); solid renter incomes; 5,458 units permitted in San Bernardino County in 2024 (1,500 in 5+ unit buildings).
- This rent runs 36% of the median local income ($85k/yr) — at the standard rent-burdened threshold; future hikes will face affordability resistance.
Forward outlook
- Local home prices are declining (-3.0%/yr); year-one equity from $1k of loan paydown is wiped out by about $6k of value loss. Plan a longer hold.
- San Bernardino County population projected at +15% by 2050 — modest demand growth; plan on rents tracking national, not racing it.
- At projected returns (-3.0% appreciation + 2.9% rent growth), your $52k cash investment doubles in ~8 years — after that, you're playing with house money.
Negotiation context
- It's been on market 89 days — a 6% lower offer ($174k) is reasonable based on typical stale-listing flexibility.
Risks & watch-outs
- Climate carrying-cost: severe wildfire risk; extreme-heat days projected 6→19/yr by 2055 (HVAC capex compounding) — expect insurance premiums to compound above CPI over the hold.
Questions for the listing agent
- It's been on market 89 days. Have you received any prior offers? Is the seller open to a 6% concession, seller financing, or rate buy-down credit?
- Why hasn't it sold? Are there any deal-killer items the seller is aware of (foundation, flood, title, zoning, code violations)?
- Is there a deadline driving the sale (1031 exchange, divorce, estate, relocation)? That informs how much negotiation room exists.
- Crime grade is D in this area — have there been break-ins, vandalism, or insurance claims at this property in the last 3 years? What carrier currently insures it and at what premium?
- What's the average days-on-market for RENTAL listings here right now (not sales)? A rising rental-DOM trend means longer vacancies and softer asking-rent achievability than the comps imply.
- What's the recent tenant-quality profile in this submarket — average credit score on applications, eviction rate, late-payment / NSF rate, and stable-employment percentage? A property-management company in the area should have these aggregated.
- How much new for-sale + rental construction is in the pipeline within 1–3 miles? Heavy new supply typically softens prices + rents 12–24 months out; constrained supply supports both.
Investment metrics
- 1% rule
- 1.36% ✓
- Cap rate
- 10.93%
- Cash-on-cash
- 16.57%
- DSCR
- 1.74
- GRM
- 6.1
CMA / ARV
- ARV (median comp)
- $165,000
- List price
- $184,999
- Delta
- 12.12%
- Verdict
- OVERPRICED
- Comps
- 7 within 1.0 mi
Show comp detail 7 sales within ~0.75 mi
| Address | Dist | Beds/Ba | Sqft | Sold | Price | $/sf | Match |
|---|---|---|---|---|---|---|---|
| 7717 Church Ave #166 | 0.00mi | 3/2.0 | 1,152 (-6%) | 7mo | $128,000 | $111 | 85 |
| 7717 Church Ave #34 | 0.00mi | 2/2.0 (-1) | 1,200 (-2%) | 12mo | $195,000 | $163 | 82 |
| 7717 Church Ave #77 | 0.00mi | 4/2.0 (+1) | 1,152 (-6%) | 7mo | $150,000 | $130 | 79 |
| 7717 Church Ave #163 | 0.00mi | 3/2.0 | 1,232 (+1%) | 24mo | $165,000 | $134 | 79 |
| 7717 Church #48 | 0.00mi | 2/2.0 (-1) | 1,100 (-10%) | 8mo | $65,000 | $59 | 72 |
| 7717 Church Ave #39 | 0.00mi | 3/2.0 | 1,344 (+10%) | 20mo | $198,990 | $148 | 67 |
| 7717 Church Ave #147 | 0.00mi | 3/2.0 | 1,340 (+10%) | 21mo | $155,000 | $116 | 66 |
Match score weights: distance 35% · size 25% · config 20% · recency 20%. Top-matched comps best support the ARV.
Projected returns pro-forma
-3.0% appreciation · 2.91% rent growth · sell at horizon
- IRR
- 7.6%
- Equity multiple
- 1.30×
- Total profit
- $15,377
- Equity at exit
- $27,584
- IRR
- 16.8%
- Equity multiple
- 2.38×
- Total profit
- $71,256
- Equity at exit
- $15,995
Cash invested: $51,800 (down + closing). Projections, not guarantees.
Landlord ↔ Tenant lean methodology
- Overall (STATE)
- 18 Strongly Tenant-Friendly
- State California
- 18 Strongly Tenant-Friendly · D+13
- County
- — inherits STATE
- City
- — inherits STATE
ZIP-level market 92346
- Rents YoY
- 2.9%
- Active inventory
- 147
- Price-to-rent
- 6.1×
Monthly cashflow live
- Estimated rent
- $2,524 high interval (Pro) →
- Mortgage (P&I)
- −$970
- Tax est. 1.5%
- −$231 /mo · $2,775/yr
- Insurance
- −$77
- HOA
- −$0
- Vacancy / Maint / Mgmt
- −$530
- Net cashflow
- $715
Break-even live
UW: 25.0% down · 7.5% · 30yr · 1.5% tax · 5.0% vac · 8.0% maint · 8.0% mgmt
Financing live
Cash to close
- Down payment
- $46,250
- Closing costs
- $5,550
- Reserves months
- —
- Total cash needed
- —
Loan-product check · same deal, 3 products live
Conventional
25% down · 7.5% · 30yr
- Down + closing
- —
- Monthly P&I
- —
- Monthly cashflow
- —
- DSCR
- —
- Eligible?
- —
Personal DTI + credit; lowest rate.
DSCR
20% down · 8.5% · 30yr
- Down + closing
- —
- Monthly P&I
- —
- Monthly cashflow
- —
- DSCR
- —
- Eligible?
- —
No personal income docs; deal must DSCR.
Hard money
10% down · 12.0% · 12mo
- Down + closing
- —
- Monthly P&I
- —
- Monthly cashflow
- —
- DSCR
- —
- Eligible?
- —
Short-term bridge; refi at stabilization.
Rent comps 19 comps
| Address | Beds | Baths | Sqft | Rent | $/sqft | DOM | Units | Dist |
|---|---|---|---|---|---|---|---|---|
| 27531 Temple St Highland, CA | 3.0 | 2.0 | 1144 | $2,650 | $2.32 | 10d | 1 | 0.17mi |
| 7000 La Praix St Highland, CA | 2.0 | 1.0 | 865 | $2,200 | $2.54 | 1d | 1 | 0.90mi |
| 7925 Midhurst Dr Highland, CA | 3.0 | 1.5 | 1326 | $2,450 | $1.85 | 24d | 1 | 0.98mi |
| 7767 Colwyn Ave Highland, CA | 3.0 | 1.5 | 1107 | $2,500 | $2.26 | 24d | 1 | 1.03mi |
| 7257 Wakefield Ct Highland, CA | 3.0 | 2.0 | 1183 | $2,395 | $2.02 | 24d | 1 | 1.14mi |
| 28561 Foxboro Ln Highland, CA | 4.0 | 2.5 | 1437 | $3,150 | $2.19 | 18d | 1 | 1.21mi |
| 6787 Cole Ave Highland, CA | 2.0–3.0 | 2.0 | 1005 | $2,550 | $2.54 | 1d | 1 | 1.26mi |
| 7221 Olive St Highland, CA | 2.0 | 1.0 | 866 | $2,150 | $2.48 | 43d | 1 | 1.26mi |
| 26660 9th St Highland, CA | 1.0–2.0 | 1.0–2.0 | 755 | $2,050 | $2.72 | 1d | 4 | 1.30mi |
| 28349 Saffron Ave Highland, CA | 2.0 | 1.0 | 800 | $2,500 | $3.12 | 43d | 1 | 1.32mi |
| 3511 Rainbow Ln Highland, CA | 2.0 | 1.0 | 780 | $2,050 | $2.63 | 2d | 1 | 1.36mi |
| 28638 Strathmore Rd Highland, CA | 2.0 | 2.0 | 966 | $2,500 | $2.59 | 43d | 1 | 1.37mi |
| 7410 San Francisco St Highland, CA | 2.0 | 2.0 | 864 | $2,400 | $2.78 | 20d | 1 | 1.37mi |
| 7410 San Francisco St Highland, CA | 2.0 | 2.0 | 864 | $2,500 | $2.89 | 24d | 1 | 1.37mi |
| 26814 Mansfield St Highland, CA | 3.0 | 1.0 | 1275 | $2,850 | $2.24 | 43d | 1 | 1.39mi |
| 3532 Rainbow Ln Highland, CA | 2.0 | 1.0 | 882 | $2,100 | $2.38 | 1d | 1 | 1.39mi |
| 3479 20th St Highland, CA | 2.0 | 1.0 | 882 | $1,995 | $2.26 | 43d | 1 | 1.44mi |
| 3495 21st St Unit B Highland, CA | 2.0 | 2.0 | 1000 | $2,000 | $2.00 | 43d | 1 | 1.49mi |
| 3404 20th St #1 Highland, CA | 2.0 | 1.0 | 780 | $2,195 | $2.81 | 2d | 1 | 1.50mi |
Listing history 15 events
-
2026-06-18days on market $184,999 Active 89 DOM
-
2026-06-17days on market $184,999 Active 88 DOM
-
2026-06-16days on market $184,999 Active 87 DOM
-
2026-06-15days on market $184,999 Active 86 DOM
-
2026-06-13days on market $184,999 Active 84 DOM
-
2026-06-09days on market $184,999 Active 80 DOM
-
2026-06-08days on market $184,999 Active 79 DOM
-
2026-06-07days on market $184,999 Active 78 DOM
-
2026-06-04days on market $184,999 Active 75 DOM
-
2026-06-03days on market $184,999 Active 74 DOM
-
2026-06-02days on market $184,999 Active 73 DOM
-
2026-06-01days on market $184,999 Active 72 DOM
-
2026-05-31days on market $184,999 Active 71 DOM
-
2026-05-02price $178,765
-
2026-03-21$184,897 Active
ⓘ Source: listings_history table (triggers on properties + properties_extension) + one-shot
backfill from property_details.listing_events for pre-trigger history.
Climate risk First Street
- Flood 1/10 Low FEMA zone X · 0% chance over 30 yrs
- Wildfire 8/10 Severe
- Heat 8/10 Severe 6 d/yr ≥101°F today · 19 d/yr by 30 yrs out
- Wind 1/10 Low
- Air quality 10/10 Extreme 29 unhealthy d/yr today · 35 by 30 yrs out
Nearby sold comps map
Loading sold comps map…
Walkable amenities ~0.75 mi
Loading nearby amenities…
Taxation est. · year 1
- Rental income
- $30,282
- − Mortgage interest
- −$10,363
- − Property taxes
- −$2,775
- − Insurance
- −$925
- − Repairs & maintenance
- −$2,423
- − Management
- −$2,423
- − Depreciation
- −$5,382
- Taxable income
- $5,993
- Est. tax owed @ 24.0%
- −$1,438
- After-tax cash flow
- $7,143/yr
For passive investors: Depreciation is non-cash, so a rental often shows a tax loss while cash-flowing — sheltering income. Rental losses are passive: they offset passive income freely, and up to $25,000/yr can offset ordinary (W-2) income if you actively participate and your MAGI is under $100k (phasing out to $0 by $150k); unused losses carry forward. On sale, claimed depreciation is recaptured at up to 25%, and gains may owe capital-gains tax (a 1031 exchange can defer both). Figures are a year-1 estimate at your 24.0% rate — not tax advice; consult a CPA.
Schools (NCES district)
- District
- San Bernardino City Unified
- NCES district ID
- 0634170
- Math proficiency
- 27% ▲ 1.00%
- Reading proficiency
- 40% ▬ 0.00%
- Median HH income
- $39,758
- Composite
- 30.8/100
- National rank
- #11385
- State rank
- #959 of 1400 in CA
Livability — Highland
- Score
- 59/100
- State rank
- #618
- US rank
- #19608
Category grades
Schools grade is shown separately in the Schools card above.
Census & demographics
- Census place
- Highland, CA
- County
- San Bernardino County · 2,030,291 people
- City population
- 56,179
- Metro
- Riverside-San Bernardino-Ontario, CA
- Population (ZIP)
- 56,179
- Household income
- $85,163
- Rent vs Own
- Severe rent burden
- 1816.0
Population outlook (San Bernardino County) Hauer SSP2
- Today (2025)
- 2,300,329 people
- By 2030
- 2,378,907 · +3.4%
- By 2040
- 2,523,137 · +9.7%
- By 2050
- 2,642,388 · +14.9%
- By 2075
- 2,880,769 · +25.2%
- By 2100
- 2,909,436 · +26.5%
Race, ethnicity, and origin ACS 2023
- Neighborhood character
- Diverse neighborhood (Simpson 0.63)
- Race & ethnicity
- Hispanic / Latino 53% White 26% Two or more races 14% Black 8% Asian 8% Native American 1%
- Hispanic origin (detail)
- Mexican 46%
- Common ancestry
- Italian 1% Iranian 1% Lithuanian 1%
- Foreign-born
- 19% · Canada, Vietnam, South Korea
- Languages at home
- 60% English-only · Spanish 32% Vietnamese 2% Tagalog/Filipino 2%
Political lean MEDSL · San Bernardino
- 2024 margin
- Toss-up / Even · D 47.5% · R 49.7% · Other 2.8%
- 2008→2024 swing
- -8.5pp toward R · 2008: 6.3pp · 2024: -2.1pp
- All cycles
- 2024: R+2.1 2020: D+10.7 2016: D+9.8 2012: D+5.4 2008: D+6.3
Not yet ingested
- Civics
- —
Market trends
- HPI YoY
- ▼ -328.00%
- Current HPI
- 367.2829
- Rent YoY
- ▲ 2.91%
- Metro
- Riverside-San Bernardino-Ontario, CA
- State GDP YoY
- ▲ 3.21%
- F500 in state
- 116
Industry mix (Fortune 500 HQ in CA)
| Industry | F500 HQs | Revenue |
|---|---|---|
| Technology | 27 | $1,492B |
|
||
| Financial Services | 3 | $174B |
|
||
| Retail | 3 | $44B |
|
||
| Insurance | 3 | $26B |
|
||
| Media / Entertainment | 2 | $115B |
|
||
| Pharmaceuticals / Biotech | 2 | $62B |
|
||
Price history
-3.3% since first listed2 events — show timeline
- 2026-05-02 Price Changed $178,765 CRMLS
- 2026-03-21 Listed $184,897 CRMLS
Property tax history
+0.1%/yrLatest (2025): $283 · +0.1% YoY. Source: county tax records.
Cash-flow waterfall
monthlySold comps — $/sqft
last 12 mo · ≤1 miLoading sold comps…