3627 Treasure Cove Cir · Winding Cypress, FL
Flood risk 8/10 · Major
- FEMA flood zone
- AE
- Chance of flooding over 30 yrs
- 0.99%
- Est. flood insurance / yr
- $1,737 – $8,500
Fire risk 3/10 · Minor
- Est. fire insurance / yr
- $947 – $1,759
Heat risk 10/10 · Severe
- Hot days now (above 108°F)
- 7 days/yr
- Hot days in 30 yrs
- 30 days/yr
Wind risk 10/10 · Severe
- Chance of severe wind over 30 yrs
- 99.0%
Air-quality risk 3/10 · Minor
- Unhealthy air days now
- 3 days/yr
- Unhealthy air days in 30 yrs
- 3 days/yr
Risk factors via First Street. Map © Google.
Why this score? — see what drove the C grade
The composite is a weighted blend of 9 inputs, each scored 0–100. Each bar is that input's sub-score; the figure is the points it added to the 100-point composite (weight × sub-score).
- Cash flow +19.7/30.0
- ARV discount +7.5/15.0
- DSCR +6.2/10.0
- Schools +5.0/10.0
- 1% rule +4.8/10.0
- Appreciation +4.3/10.0
- Rent growth +3.3/5.0
- Livability +2.5/5.0
- Condition / age +2.5/5.0
$665,000
🖨 Deal sheet 📄 Offer letter ✓ Due diligence
Listing remarks MLS
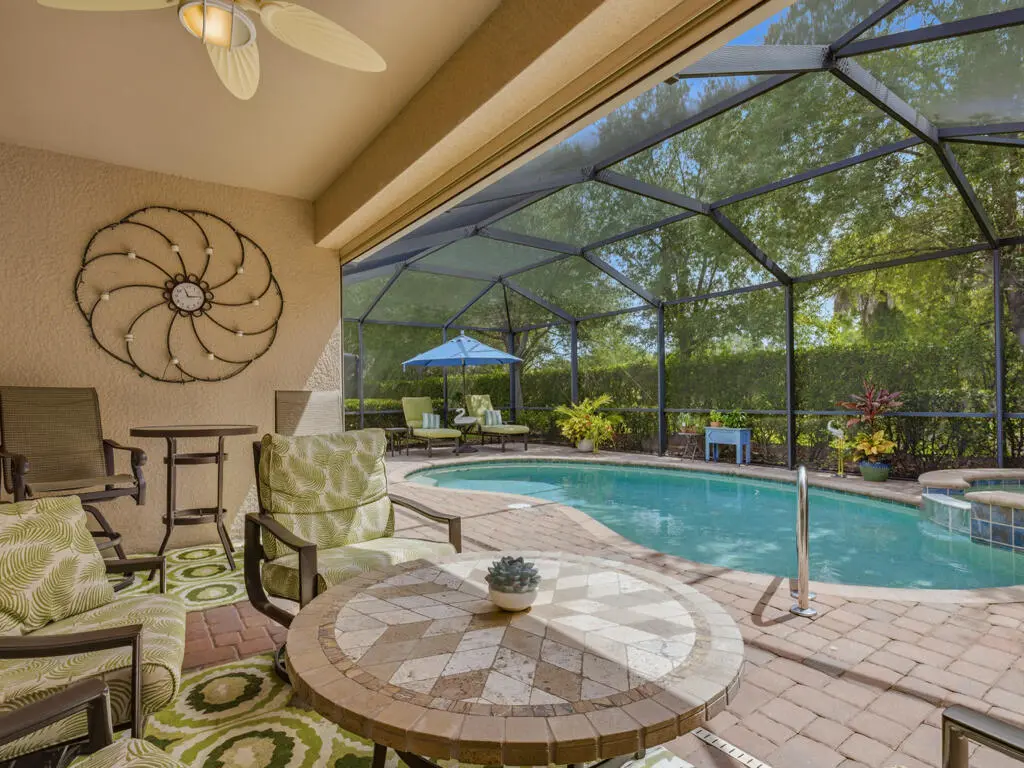
Situated within the gated community of Copper Cove Preserve, this exceptional Naples residence offers an inviting blend of sophistication, comfort, and effortless Florida living. Thoughtfully designed with spacious living areas and refined finishes, the home seamlessly connects indoor and outdoor spaces, creating an ideal setting for both everyday enjoyment and entertaining. The well-appointed floor plan features three bedrooms plus a private den/study, three full baths, elegant gathering spaces, and abundant natural light throughout. The kitchen serves as the heart of the home, offering ample cabinetry, pantry, expansive counter space, and a layout designed for both casual dining and formal occasions. Step outside to your private tropical retreat, where a sparkling pool and spacious covered lanai create the perfect setting for year-round outdoor living. Residents of Copper Cove Preserve enjoy a desirable Naples location with low homeowner association fees and convenient access to Marco Island, downtown Naples, Gulf beaches, championship golf courses, waterfront dining, shopping, and endless recreational opportunities. Offering the ideal combination of luxury, privacy, and location, this residence presents an exceptional opportunity to experience the very best of Southwest Florida living.
Key facts
- Gated community
- Ample cabinetry
- Private den
Tags
Property features AI
Finance
- HOA & community: Mandatory HOA with professional management; Quarterly master HOA fee (reported); HOA covers cable, insurance, internet/Wi‑Fi access, irrigation water, lawn/land maintenance, legal/accounting, manager, exterior pest control, repairs, reserve, and street lights; Community amenities include sidewalks and streetlights; Total annual recurring fees reported; Total one-time fees reported
Exterior
- Parking: Attached 2-car garage
- Security: Gated community
- Utilities: Central water; Central sewer; Cable available
- Home design: Single-family home; One-story / ranch; Residential property; Rear exposure faces north; Located in Copper Cove Preserve
- Construction: Built in 2014; Concrete block construction; Tile roof; Foundation typical for single-family (not otherwise specified)
- Exterior features: Below-ground private pool; Below-ground private spa; Stucco exterior; Sliding windows; Electric and manual shutters
Interior
- Kitchen: Island; Dishwasher; Disposal; Microwave; Range; Refrigerator with icemaker; Self-cleaning oven
- Bedrooms: 3 bedrooms plus den
- Flooring: Tile floors; Vinyl flooring
- Bathrooms: 3 full bathrooms; Master bath with dual sinks and a separate tub and shower
- Heating & cooling: Central electric heat; Central electric cooling
- Interior features: High-speed internet available; Smoke detectors; Island in kitchen; Dining area open to living space; Den / study; Guest room; Guest bath; Screened lanai/porch
- Laundry & utility: Washer and dryer included; Washer/Dryer hookup; Laundry in residence; Auto garage door
Neighborhood map
What this means for you Summary
Snapshot
- This is a 3-bed/3.0-bath single-family listed at $665k.
Deal economics
- At list price, monthly cash flow is $356 ($4k/yr) — positive.
- The deal already cash-flows at list — no discount required.
- To meet the 1% rule (rent ≥ 1% of price), the offer needs to be $651k (2.1% below list).
- Recommended offer: $651k (2.1% below list) — sets the bar for 1% rule.
Location & tenants
- Location reads: area grade C — affects rentability + tenant quality, not the cash-flow math above.
- Collier (suburban): math 60% / reading 56% proficiency, ranked #16 of 73 in FL (top 22%) — acceptable for families but not a draw, mixed tenant base, ~2y average lease.
- Market conditions: Rents rising (+3.2%/yr); 900 active listings in the ZIP; 40 comparable units currently listed for rent nearby; rentals at typical pace (median 23d on market — plan ~3-4 weeks tenant-placement turnaround); solid renter incomes; 3,520 units permitted in Collier County in 2024 (959 in 5+ unit buildings).
- At $6,512/mo this rent would consume 87% of the median local household income ($89k/yr) (locally 550% of renters already pay >50% of income on rent) — very limited rent-growth headroom before tenants either downsize or default.
Forward outlook
- Local home prices are declining (-1.5%/yr); year-one equity from $5k of loan paydown is wiped out by about $10k of value loss. Plan a longer hold.
- Collier County population projected at +30% by 2050 — long-run rental-demand tailwind backs the buy-and-hold thesis.
Negotiation context
- It's been on market 16 days — a 2% lower offer ($655k) is reasonable based on typical stale-listing flexibility.
- 2 sale attempts with the ask held roughly flat each time — persistent listings suggest the price (not the market) is what's stuck; bring a comps-based counter.
Risks & watch-outs
- Watch-outs: flood insurance adds $427/mo.
- Climate carrying-cost: in FEMA flood zone AE (mandatory federal flood insurance); severe wind risk, 99% chance of damaging wind over 30y; extreme-heat days projected 7→30/yr by 2055 (HVAC capex compounding) — expect insurance premiums to compound above CPI over the hold.
Questions for the listing agent
- What's the actual annual flood-insurance premium (NFIP or private), and is the property in a SFHA with mandatory coverage?
- What does the HOA fee cover, when was the last increase, and are there any pending special assessments or reserve-fund shortfalls?
- Is there a deadline driving the sale (1031 exchange, divorce, estate, relocation)? That informs how much negotiation room exists.
- What's the average days-on-market for RENTAL listings here right now (not sales)? A rising rental-DOM trend means longer vacancies and softer asking-rent achievability than the comps imply.
- What's the recent tenant-quality profile in this submarket — average credit score on applications, eviction rate, late-payment / NSF rate, and stable-employment percentage? A property-management company in the area should have these aggregated.
- How much new for-sale + rental construction is in the pipeline within 1–3 miles? Heavy new supply typically softens prices + rents 12–24 months out; constrained supply supports both.
Investment metrics
- 1% rule
- 0.98% ✗
- Cap rate
- 7.71%
- Cash-on-cash
- 5.04%
- DSCR
- 1.22
- GRM
- 8.5
CMA / ARV
No comps found within radius.
Projected returns pro-forma
-1.48% appreciation · 3.21% rent growth · sell at horizon
- IRR
- -5.1%
- Equity multiple
- 0.78×
- Total profit
- $-40,102
- Equity at exit
- $145,311
- IRR
- 2.4%
- Equity multiple
- 1.22×
- Total profit
- $40,585
- Equity at exit
- $139,975
Cash invested: $186,200 (down + closing). Projections, not guarantees.
Landlord ↔ Tenant lean methodology
- Overall (STATE)
- 87 Strongly Landlord-Friendly
- State Florida
- 87 Strongly Landlord-Friendly · R+3
- County
- — inherits STATE
- City
- — inherits STATE
ZIP-level market 34114
- Home prices YoY
- -0.6%
- Rents YoY
- 3.2%
- Active inventory
- 900
- Price-to-rent
- 8.5×
Monthly cashflow live
- Estimated rent
- $6,512 high interval (Pro) →
- Mortgage (P&I)
- −$3,487
- Tax from tax record
- −$294 /mo · $3,533/yr
- Insurance
- −$277
- Flood insurance flood zone
- −$427 /mo · $5,118/yr
- HOA
- −$303
- Vacancy / Maint / Mgmt
- −$1,367
- Net cashflow
- $356
Break-even live
UW: 25.0% down · 7.5% · 30yr · 1.5% tax · 5.0% vac · 8.0% maint · 8.0% mgmt
Financing live
Cash to close
- Down payment
- $166,250
- Closing costs
- $19,950
- Reserves months
- —
- Total cash needed
- —
Loan-product check · same deal, 3 products live
Conventional
25% down · 7.5% · 30yr
- Down + closing
- —
- Monthly P&I
- —
- Monthly cashflow
- —
- DSCR
- —
- Eligible?
- —
Personal DTI + credit; lowest rate.
DSCR
20% down · 8.5% · 30yr
- Down + closing
- —
- Monthly P&I
- —
- Monthly cashflow
- —
- DSCR
- —
- Eligible?
- —
No personal income docs; deal must DSCR.
Hard money
10% down · 12.0% · 12mo
- Down + closing
- —
- Monthly P&I
- —
- Monthly cashflow
- —
- DSCR
- —
- Eligible?
- —
Short-term bridge; refi at stabilization.
Rent comps 40 comps
| Address | Beds | Baths | Sqft | Rent | $/sqft | DOM | Units | Dist |
|---|---|---|---|---|---|---|---|---|
| 3837 Ruby Way Naples, FL | 4.0 | 3.0 | 2293 | $9,500 | $4.14 | 23d | 1 | 0.23mi |
| 3955 Deer Crossing Ct #103 Naples, FL | 3.0 | 2.0 | 1812 | $7,500 | $4.14 | 23d | 1 | 0.48mi |
| 3975 Deer Crossing Ct #201 Naples, FL | 3.0 | 2.0 | 2101 | $7,500 | $3.57 | 23d | 1 | 0.52mi |
| 9515 Campanile Cir Naples, FL | 3.0 | 3.0 | 2318 | $20,000 | $8.63 | 23d | 1 | 0.52mi |
| 3930 Deer Crossing Ct #103 Naples, FL | 3.0 | 2.0 | 1950 | $2,530 | $1.30 | 13d | 1 | 0.52mi |
| 3940 Deer Crossing Ct Unit 4-203 Naples, FL | 3.0 | 2.0 | 2166 | $7,500 | $3.46 | 23d | 1 | 0.52mi |
| 3985 Deer Crossing Ct #201 Naples, FL | 3.0 | 2.0 | 1981 | $5,795 | $2.93 | 23d | 1 | 0.54mi |
| 3960 Deer Crossing Ct Unit 6-204 Naples, FL | 3.0 | 2.0 | 2329 | $8,500 | $3.65 | 23d | 1 | 0.54mi |
| 9571 Mussorie Ct Naples, FL | 3.0 | 3.5 | 2117 | $12,500 | $5.90 | 23d | 1 | 0.55mi |
| 9224 Campanile Cir Unit 203 Naples, FL | 3.0 | 3.0 | 2512 | $6,495 | $2.59 | 13d | 1 | 0.59mi |
| 3860 Cotton Green Path Dr Naples, FL | 4.0 | 3.0 | 2300 | $12,000 | $5.22 | 23d | 1 | 0.60mi |
| 9242 Tesoro Ln Unit 1-102 Naples, FL | 3.0 | 3.0 | 2237 | $3,000 | $1.34 | 23d | 1 | 0.61mi |
| 9205 Museo Cir Unit 201 Naples, FL | 4.0 | 3.0 | 3000 | $10,000 | $3.33 | 13d | 1 | 0.62mi |
| 9243 Tesoro Ln Unit 2 Naples, FL | 3.0 | 3.0 | 2100 | $6,500 | $3.10 | 13d | 1 | 0.62mi |
| 9209 Museo Cir Unit 102 Naples, FL | 3.0 | 3.0 | 2502 | $7,200 | $2.88 | 13d | 1 | 0.66mi |
| 9239 Tesoro Ln Unit 3-203 Naples, FL | 3.0 | 3.0 | 2300 | $8,000 | $3.48 | 23d | 1 | 0.66mi |
| 9630 Campanile Cir Naples, FL | 3.0 | 3.0 | 2283 | $15,000 | $6.57 | 23d | 1 | 0.68mi |
| 1157 Enbrook Loop Naples, FL | 2.0 | 2.0 | 1503 | $3,000 | $2.00 | 23d | 1 | 0.68mi |
| 847 Enbrook Loop Naples, FL | 2.0 | 2.0 | 1503 | $2,950 | $1.96 | 23d | 1 | 0.68mi |
| 842 Enbrook Loop Naples, FL | 2.0 | 2.0 | 1503 | $2,800 | $1.86 | 23d | 1 | 0.69mi |
| 9255 Museo #103 Naples, FL | 3.0 | 3.0 | 2100 | $9,000 | $4.29 | 23d | 1 | 0.71mi |
| 4529 Cardinal Cove Ln #7 Naples, FL | 2.0 | 2.0 | 1539 | $6,500 | $4.22 | 23d | 1 | 0.72mi |
| 1212 Enbrook Loop Naples, FL | 2.0 | 2.0 | 1496 | $2,850 | $1.91 | 23d | 1 | 0.72mi |
| 7673 Mulberry Ln Naples, FL | 4.0 | 3.0 | 2575 | $18,000 | $6.99 | 13d | 1 | 0.74mi |
| 1973 Yellowfin Cir Naples, FL | 4.0 | 3.0 | 2894 | $9,800 | $3.39 | 23d | 1 | 0.74mi |
| 4685 Hawks Nest Way #103 Naples, FL | 2.0 | 2.0 | 1440 | $6,500 | $4.51 | 13d | 1 | 0.75mi |
| 2057 Yellowfin Cir Naples, FL | 3.0 | 3.0 | 2080 | $7,800 | $3.75 | 23d | 1 | 0.77mi |
| 1937 Yellowfin Cir Naples, FL | 3.0 | 2.0 | 2214 | $3,830 | $1.73 | 21d | 1 | 0.77mi |
| 9259 Museo Cir #102 Naples, FL | 3.0 | 3.0 | 2100 | $4,150 | $1.98 | 23d | 1 | 0.79mi |
| 1276 Enbrook Loop Naples, FL | 2.0 | 2.0 | 1503 | $5,000 | $3.33 | 23d | 1 | 0.79mi |
| 1078 Rolling Brook Ln Naples, FL | 2.0 | 2.0 | 1503 | $2,750 | $1.83 | 21d | 1 | 0.79mi |
| 9267 Museo Cir Unit 204 Naples, FL | 3.0 | 3.5 | 2100 | $5,200 | $2.48 | 23d | 1 | 0.80mi |
| 4680 Hawks Nest Way Unit D-103 Naples, FL | 2.0 | 2.0 | 1414 | $3,000 | $2.12 | 13d | 1 | 0.81mi |
| 4650 Hawks Nest Way Unit M202 Naples, FL | 3.0 | 2.0 | 1840 | $9,600 | $5.22 | 13d | 1 | 0.82mi |
| 2235 Yellowfin Cir Naples, FL | 2.0 | 2.0 | 1500 | $2,795 | $1.86 | 23d | 1 | 0.82mi |
| 9006 Cascada Way #101 Naples, FL | 3.0 | 2.0 | 2408 | $7,950 | $3.30 | 23d | 1 | 0.84mi |
| 2244 Yellowfin Cir Naples, FL | 3.0 | 2.0 | 1655 | $3,300 | $1.99 | 13d | 1 | 0.85mi |
| 1171 Tranquil Brook Dr Naples, FL | 2.0 | 2.0 | 1503 | $4,500 | $2.99 | 13d | 1 | 0.85mi |
| 9142 Cherry Oaks Ln #102 Naples, FL | 3.0 | 2.0 | 2408 | $3,000 | $1.25 | 13d | 1 | 0.86mi |
| 9142 Cherry Oaks Ln #201 Naples, FL | 3.0 | 3.0 | 3000 | $2,995 | $1.00 | 13d | 1 | 0.86mi |
HOA detail
- Monthly dues
- $303 · $3,636/yr
- Likely covers
- waterpoolsecurity
Listing history 12 events
-
2026-06-18days on market $665,000 Active 16 DOM
-
2026-06-17days on market $665,000 Active 15 DOM
-
2026-06-16days on market $665,000 Active 14 DOM
-
2026-06-15price $665,000 Active 13 DOM
-
2026-06-15days on market $679,000 Active 13 DOM
-
2026-06-14days on market $679,000 Active 11 DOM
-
2026-06-10days on market $679,000 Active 8 DOM
-
2026-06-09days on market $679,000 Active 7 DOM
-
2026-06-08days on market $679,000 Active 6 DOM
-
2026-06-07days on market $679,000 Active 5 DOM
-
2026-06-03remarks 699-char remark
-
2026-06-03$679,000 Active 1 DOM
ⓘ Source: listings_history table (triggers on properties + properties_extension) + one-shot
backfill from property_details.listing_events for pre-trigger history.
Tax reassessment forecast FL · Resets to sale price
- Current annual tax
- $3,533 · $294/mo
- Projected year-2 tax
- $5,520 · $460/mo
- Expected delta
- +$1,987/yr (+$166/mo · 56.2%)
ⓘ Screening estimate from a state-policy table — verify with the county assessor before closing.
Climate risk First Street
- Flood 8/10 Severe FEMA zone AE · 99% chance over 30 yrs
- Wildfire 3/10 Moderate
- Heat 10/10 Extreme 7 d/yr ≥108°F today · 30 d/yr by 30 yrs out
- Wind 10/10 Extreme 99% chance of damaging wind over 30 yrs
- Air quality 3/10 Moderate 3 unhealthy d/yr today · 3 by 30 yrs out
Nearby sold comps map
Loading sold comps map…
Walkable amenities ~0.75 mi
Loading nearby amenities…
Taxation est. · year 1
- Rental income
- $78,142
- − Mortgage interest
- −$37,250
- − Property taxes
- −$3,533
- − Insurance
- −$8,444
- − Repairs & maintenance
- −$6,251
- − Management
- −$6,251
- − HOA
- −$3,636
- − Depreciation
- −$19,345
- Taxable loss
- −$6,569
- Est. tax savings @ 24.0%
- +$1,577
- After-tax cash flow
- $5,848/yr
For passive investors: Depreciation is non-cash, so a rental often shows a tax loss while cash-flowing — sheltering income. Rental losses are passive: they offset passive income freely, and up to $25,000/yr can offset ordinary (W-2) income if you actively participate and your MAGI is under $100k (phasing out to $0 by $150k); unused losses carry forward. On sale, claimed depreciation is recaptured at up to 25%, and gains may owe capital-gains tax (a 1031 exchange can defer both). Figures are a year-1 estimate at your 24.0% rate — not tax advice; consult a CPA.
Schools (NCES district)
- District
- Collier
- NCES district ID
- 1200330
- Math proficiency
- 60% ▼ -4.00%
- Reading proficiency
- 56% ▼ -2.00%
- Median HH income
- $58,275
- Composite
- 50.23/100
- National rank
- #1892
- State rank
- #16 of 73 in FL
Livability — Winding Cypress
No livability data for this city. (Only ~50 U.S. cities are tracked.)
Census & demographics
- County
- Collier County · 396,295 people
- Metro
- Naples-Marco Island, FL
- Population (ZIP)
- 23,559
- Household income
- $89,334
- Rent vs Own
- Severe rent burden
- 550.0
Population outlook (Collier County) Hauer SSP2
- Today (2025)
- 420,858 people
- By 2030
- 450,054 · +6.9%
- By 2040
- 502,232 · +19.3%
- By 2050
- 544,932 · +29.5%
- By 2075
- 627,203 · +49.0%
- By 2100
- 659,015 · +56.6%
Race, ethnicity, and origin ACS 2023
- Neighborhood character
- Predominantly White (72%)
- Race & ethnicity
- White 72% Hispanic / Latino 17% Two or more races 13% Black 7%
- Hispanic origin (detail)
- Mexican 7% Puerto Rican 1% Cuban 3%
- Common ancestry
- Hispanic 5% Romanian 4% Lithuanian 1%
- Foreign-born
- 21% · Canada, Jamaica
- Languages at home
- 75% English-only · Spanish 15% French/Haitian/Cajun 5% Other Indo-European 4%
Political lean MEDSL · Collier
- 2024 margin
- Solid R (+33.1) · D 33.1% · R 66.2%
- 2008→2024 swing
- -10.6pp toward R · 2008: -22.5pp · 2024: -33.1pp
- All cycles
- 2024: R+33.1 2020: R+24.7 2016: R+26.0 2012: R+30.1 2008: R+22.5
Not yet ingested
- Civics
- —
Market trends
- HPI YoY
- ▼ -1.48%
- Current HPI
- 266.5545
- Rent YoY
- ▲ 3.21%
- Metro
- Naples-Marco Island, FL
- State GDP YoY
- ▲ 3.28%
- F500 in state
- 36
Industry mix (Fortune 500 HQ in FL)
| Industry | F500 HQs | Revenue |
|---|---|---|
| Industrial Technology | 2 | $29B |
|
||
| Insurance | 2 | $17B |
|
||
| Retail | 1 | $60B |
|
||
| Technology Distribution | 1 | $58B |
|
||
| Homebuilding | 1 | $35B |
|
||
| Technology Manufacturing | 1 | $35B |
|
||
Price history
+0.0% since first listed2 events — show timeline
- 2026-06-02 Listed $679,000 NAPLESMLS
- 2026-06-02 Listed $679,000 MIML
Property tax history
+39.7%/yrLatest (2025): $3,533 · +7.0% YoY. Source: county tax records.
Cash-flow waterfall
monthlySold comps — $/sqft
last 12 mo · ≤1 miLoading sold comps…