 🏢 Co-op
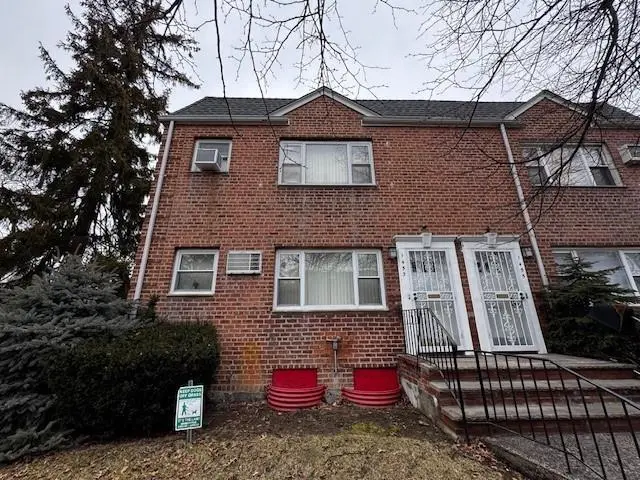
1453 Independence Ave Unit 1B · New York, NY
Flood risk 1/10 · Minimal
- FEMA flood zone
- X (unshaded)
- Chance of flooding over 30 yrs
- 0.0%
- Est. flood insurance / yr
- $507 – $1,088
Fire risk 1/10 · Minimal
- Est. fire insurance / yr
- $691 – $1,283
Heat risk 7/10 · Major
- Hot days now (above 97°F)
- 7 days/yr
- Hot days in 30 yrs
- 16 days/yr
Wind risk 6/10 · Moderate
- Chance of severe wind over 30 yrs
- 69.0%
Air-quality risk 4/10 · Minor
- Unhealthy air days now
- 5 days/yr
- Unhealthy air days in 30 yrs
- 7 days/yr
Risk factors via First Street. Map © Google.
Why this score? — see what drove the B- grade
The composite is a weighted blend of 9 inputs, each scored 0–100. Each bar is that input's sub-score; the figure is the points it added to the 100-point composite (weight × sub-score).
- Cash flow +27.8/30.0
- DSCR +9.8/10.0
- 1% rule +7.6/10.0
- ARV discount +7.5/15.0
- Schools +5.0/10.0
- Rent growth +4.5/5.0
- Livability +3.8/5.0
- Condition / age +2.2/5.0
- Appreciation +0.0/10.0
$309,000
🖨 Deal sheet 📄 Offer letter ✓ Due diligence
Listing remarks
* * SPONSOR OWNED UNIT * * NO BOARD APPROVAL NEEDED * * (Buyer must pay Sellers Transfer Tax & Lawyer Fee as per bylaws) 2 Bedroom CO-OP, Bottom floor, corner unit, extra windows, Needs TLC, plenty of closet space. HIGHEST & BEST OFFERS ONLY!!! Quick Closing is Preferred.
Key facts
- Built 1953
- Listed 17 days
Neighborhood map
What this means for you Summary
Snapshot
- This is a 2-bed/1.0-bath condo listed at $309k. Condition is rated fair.
Deal economics
- At list price, monthly cash flow is $946 ($11k/yr) — positive.
- The deal already cash-flows at list — no discount required.
- Meets the 1% rule at list price ($4k rent vs $309k).
- Recommended offer: $304k (1.5% below list) — sets the bar for market timing.
- Cap rate 10.0% vs local median 2.6% in New York — top-decile yield for the area; either an underpriced asset or a hidden risk that comps aren't pricing in. Stress-test before assuming the spread holds.
Location & tenants
- Location reads 75/100 on livability (#268 in NY, #4,188 nationally) — a middle-class / working-renter tenant base. Strengths: amenities A+, commute A+, health & safety A; Watch: crime F, cost of living F.
- Market conditions: Rents rising fast (+8.0%/yr); 192 active listings in the ZIP; 10 comparable units currently listed for rent nearby; rentals at typical pace (median 19d on market — plan ~3-4 weeks tenant-placement turnaround); solid renter incomes; 10,063 units permitted in Kings County in 2024 (9,789 in 5+ unit buildings).
- At $3,901/mo this rent would consume 56% of the median local household income ($84k/yr) (locally 2061% of renters already pay >50% of income on rent) — very limited rent-growth headroom before tenants either downsize or default.
Forward outlook
- Local home prices are declining (-3.0%/yr); year-one equity from $2k of loan paydown is wiped out by about $9k of value loss. Plan a longer hold.
- Kings County population projected at +13% by 2050 — modest demand growth; plan on rents tracking national, not racing it.
- At projected returns (-3.0% appreciation + 8.0% rent growth), your $87k cash investment doubles in ~7 years — after that, you're playing with house money.
Negotiation context
- It's been on market 17 days — a 2% lower offer ($304k) is reasonable based on typical stale-listing flexibility.
Risks & watch-outs
- Watch-outs: built in 1953 — expect roof / HVAC / electrical / plumbing capex.
- Climate carrying-cost: major wind risk, 69% chance of damaging wind over 30y; extreme-heat days projected 7→16/yr by 2055 (HVAC capex compounding) — expect insurance premiums to compound above CPI over the hold.
Questions for the listing agent
- Have any recent inspections been done? Can we get a copy of the seller's disclosures and any deferred-maintenance estimates?
- Built in 1953 — when were the roof, HVAC, electrical panel, plumbing, and water heater last replaced?
- Any open or pending special assessments — roof, HVAC, plumbing, elevator, façade? What's the per-unit balance and payoff schedule, and is the seller paying it off at close or rolling it to the buyer?
- Is there a deadline driving the sale (1031 exchange, divorce, estate, relocation)? That informs how much negotiation room exists.
- Schools are B-rated — typically a magnet for longer-tenancy family renters. What's the average tenant stay here, and is there a school-zone premium baked into asking?
- Crime grade is F in this area — have there been break-ins, vandalism, or insurance claims at this property in the last 3 years? What carrier currently insures it and at what premium?
- What's the average days-on-market for RENTAL listings here right now (not sales)? A rising rental-DOM trend means longer vacancies and softer asking-rent achievability than the comps imply.
- What's the recent tenant-quality profile in this submarket — average credit score on applications, eviction rate, late-payment / NSF rate, and stable-employment percentage? A property-management company in the area should have these aggregated.
- How much new apartment / multifamily construction is in the pipeline within 1–3 miles? Heavy new supply (>2% of stock underway) typically softens rents 12–24 months out; light construction supports rent growth.
Investment metrics
- 1% rule
- 1.26% ✓
- Cap rate
- 9.97%
- Cash-on-cash
- 13.12%
- DSCR
- 1.58
- GRM
- 6.6
CMA / ARV
No comps found within radius.
Projected returns pro-forma
-3.0% appreciation · 7.96% rent growth · sell at horizon
- IRR
- 8.5%
- Equity multiple
- 1.35×
- Total profit
- $30,696
- Equity at exit
- $46,073
- IRR
- 21.6%
- Equity multiple
- 3.28×
- Total profit
- $197,532
- Equity at exit
- $26,717
Cash invested: $86,520 (down + closing). Projections, not guarantees.
Landlord ↔ Tenant lean methodology
- Overall (CITY)
- 0 Strongly Tenant-Friendly
- State New York
- 15 Strongly Tenant-Friendly · D+10
- County
- — inherits STATE
- City New York
- 0 Strongly Tenant-Friendly · D+34
ZIP-level market 11228
- Rents YoY
- 8.0%
- Active inventory
- 192
- Price-to-rent
- 6.6×
Monthly cashflow live
- Estimated rent
- $3,901 high interval (Pro) →
- Mortgage (P&I)
- −$1,620
- Tax est. 1.5%
- −$386 /mo · $4,635/yr
- Insurance
- −$129
- HOA
- −$0
- Vacancy / Maint / Mgmt
- −$819
- Net cashflow
- $946
Break-even live
UW: 25.0% down · 7.5% · 30yr · 1.5% tax · 5.0% vac · 8.0% maint · 8.0% mgmt
Financing live
Cash to close
- Down payment
- $77,250
- Closing costs
- $9,270
- Reserves months
- —
- Total cash needed
- —
Loan-product check · same deal, 3 products live
Conventional
25% down · 7.5% · 30yr
- Down + closing
- —
- Monthly P&I
- —
- Monthly cashflow
- —
- DSCR
- —
- Eligible?
- —
Personal DTI + credit; lowest rate.
DSCR
20% down · 8.5% · 30yr
- Down + closing
- —
- Monthly P&I
- —
- Monthly cashflow
- —
- DSCR
- —
- Eligible?
- —
No personal income docs; deal must DSCR.
Hard money
10% down · 12.0% · 12mo
- Down + closing
- —
- Monthly P&I
- —
- Monthly cashflow
- —
- DSCR
- —
- Eligible?
- —
Short-term bridge; refi at stabilization.
Rent comps 10 comps
| Address | Beds | Baths | Sqft | Rent | $/sqft | DOM | Units | Dist |
|---|---|---|---|---|---|---|---|---|
| 1131 86th St #4 Brooklyn, NY | 1.0 | 1.0 | 550 | $2,350 | $4.27 | 24d | 1 | 0.79mi |
| 9718 Fort Hamilton Pkwy #3 Brooklyn, NY | 1.0 | 1.0 | 1000 | $2,650 | $2.65 | 24d | 1 | 0.94mi |
| 335 95th St #3 Brooklyn, NY | 1.0 | 1.0 | 725 | $2,200 | $3.03 | 24d | 1 | 1.15mi |
| 2286 Cropsey Ave Unit 8B Brooklyn, NY | 2.0 | 2.0 | 889 | $5,000 | $5.62 | 19d | 1 | 1.24mi |
| 2286 Cropsey Ave Unit 18B Brooklyn, NY | 2.0 | 2.0 | 889 | $5,300 | $5.96 | 19d | 1 | 1.24mi |
| 2286 Cropsey Ave Unit 13E Brooklyn, NY | 2.0 | 2.0 | 948 | $5,550 | $5.85 | 19d | 1 | 1.24mi |
| 2286 Cropsey Ave Unit 6A Brooklyn, NY | 2.0 | 2.0 | 889 | $5,125 | $5.76 | 24d | 1 | 1.24mi |
| 2286 Cropsey Ave Unit 19C Brooklyn, NY | 1.0 | 1.0 | 544 | $3,600 | $6.62 | 19d | 1 | 1.24mi |
| 2286 Cropsey Ave Unit 7E Brooklyn, NY | 2.0 | 2.0 | 948 | $5,250 | $5.54 | 19d | 1 | 1.24mi |
| 2286 Cropsey Ave Unit 9A Brooklyn, NY | 2.0 | 2.0 | 889 | $5,200 | $5.85 | 19d | 1 | 1.24mi |
HOA detail condo
- Monthly dues
- $0 · $0/yr
- Assessments
- None detected in remarks — confirm with the listing agent.
Listing history 2 events
-
2026-04-04status Pending
-
2026-03-18$309,000 Active
ⓘ Source: listings_history table (triggers on properties + properties_extension) + one-shot
backfill from property_details.listing_events for pre-trigger history.
Climate risk First Street
- Flood 1/10 Low FEMA zone X (unshaded) · 0% chance over 30 yrs
- Wildfire 1/10 Low
- Heat 7/10 Severe 7 d/yr ≥97°F today · 16 d/yr by 30 yrs out
- Wind 6/10 Major 69% chance of damaging wind over 30 yrs
- Air quality 4/10 Moderate 5 unhealthy d/yr today · 7 by 30 yrs out
Nearby sold comps map
Loading sold comps map…
Walkable amenities ~0.75 mi
Loading nearby amenities…
Taxation est. · year 1
- Rental income
- $46,810
- − Mortgage interest
- −$17,309
- − Property taxes
- −$4,635
- − Insurance
- −$1,545
- − Repairs & maintenance
- −$3,745
- − Management
- −$3,745
- − Depreciation
- −$8,989
- Taxable income
- $6,843
- Est. tax owed @ 24.0%
- −$1,642
- After-tax cash flow
- $9,713/yr
For passive investors: Depreciation is non-cash, so a rental often shows a tax loss while cash-flowing — sheltering income. Rental losses are passive: they offset passive income freely, and up to $25,000/yr can offset ordinary (W-2) income if you actively participate and your MAGI is under $100k (phasing out to $0 by $150k); unused losses carry forward. On sale, claimed depreciation is recaptured at up to 25%, and gains may owe capital-gains tax (a 1031 exchange can defer both). Figures are a year-1 estimate at your 24.0% rate — not tax advice; consult a CPA.
Condition & rehab AI · 11 photos
This property requires moderate renovations to improve its condition and increase its value. Key areas for improvement include painting, flooring, and landscaping.
Repairs flagged
- Minor Kitchen cabinets — Slight wear on some cabinet doors.
- Minor Bathroom shower curtain — Worn out and may need replacement.
- Minor Window treatments — Dirty or faded window blinds.
- Moderate Flooring — Carpet in bedrooms needs cleaning or replacement.
- Moderate Paint — Paint in some areas appears worn and may need touch-up or repainting.
- Moderate Landscaping — Some shrubs appear dead or overgrown, may need trimming or replacement.
Value-add opportunities
- Both Paint and touch-up interior walls — Fresh paint can improve the overall appearance and value of the property.
- Both Replace worn-out carpet in bedrooms — New carpet can enhance the living experience and increase the property's value.
- Both Replace worn-out window treatments — Fresh window treatments can improve the property's curb appeal and increase its value.
- Both Landscaping improvements — Well-maintained landscaping can increase the property's curb appeal and attract more potential buyers/tenants.
Renovation cost estimate screening
| Repair item | Severity | Est. cost |
|---|---|---|
| Kitchen cabinets · Slight wear on some cabinet doors. | Minor | $500–3,000 |
| Bathroom shower curtain · Worn out and may need replacement. | Minor | $500–3,000 |
| Window treatments · Dirty or faded window blinds. | Minor | $500–3,000 |
| Flooring · Carpet in bedrooms needs cleaning or replacement. | Moderate | $3,000–15,000 |
| Paint · Paint in some areas appears worn and may need touch-up or repainting. | Moderate | $3,000–15,000 |
| Landscaping · Some shrubs appear dead or overgrown, may need trimming or replacement. | Moderate | $3,000–15,000 |
| Total estimated repair cost · 6 items | $10,500–54,000 |
Value-add ROI direction
- Both Paint and touch-up interior walls — Fresh paint can improve the overall appearance and value of the property. ↑
- Both Replace worn-out carpet in bedrooms — New carpet can enhance the living experience and increase the property's value. ↑
- Both Replace worn-out window treatments — Fresh window treatments can improve the property's curb appeal and increase its value. ↑
- Both Landscaping improvements — Well-maintained landscaping can increase the property's curb appeal and attract more potential buyers/tenants. ↑
ⓘ Cost ranges are severity-bucket heuristics (US national rule-of-thumb). Get contractor quotes + a written scope before underwriting a rehab budget.
Schools (NCES district)
No district data.
Livability — New York
- Score
- 75/100
- State rank
- #268
- US rank
- #4188
Category grades
Schools grade is shown separately in the Schools card above.
Census & demographics
- Census place
- New York, NY
- County
- Kings County · 2,614,986 people
- City population
- 7,731,280
- Metro
- New York-Newark-Jersey City, NY-NJ-PA
- Population (ZIP)
- 42,241
- Household income
- $83,665
- Rent vs Own
- Severe rent burden
- 2061.0
Population outlook (Kings County) Hauer SSP2
- Today (2025)
- 2,847,441 people
- By 2030
- 2,937,006 · +3.1%
- By 2040
- 3,095,491 · +8.7%
- By 2050
- 3,228,968 · +13.4%
- By 2075
- 3,321,723 · +16.7%
- By 2100
- 3,111,387 · +9.3%
Race, ethnicity, and origin ACS 2023
- Neighborhood character
- Diverse neighborhood (Simpson 0.62)
- Race & ethnicity
- White 48% Asian 36% Hispanic / Latino 13% Two or more races 4% Black 1%
- Hispanic origin (detail)
- Mexican 3% Puerto Rican 3% Dominican 2%
- Common ancestry
- Romanian 2% Scotch-Irish 1% Subsaharan African 1%
- Foreign-born
- 41% · China, Canada, Jamaica
- Languages at home
- 42% English-only · Chinese 28% Other Indo-European 12% Spanish 8%
Political lean MEDSL · Kings
- 2024 margin
- Solid D (+44.0) · D 72.0% · R 28.0%
- 2008→2024 swing
- -15.5pp toward R · 2008: 59.4pp · 2024: 44.0pp
- All cycles
- 2024: D+44.0 2020: D+54.8 2016: D+61.8 2012: D+63.9 2008: D+59.4
Not yet ingested
- Civics
- —
Market trends
- HPI YoY
- ▼ -226.00%
- Current HPI
- 381.4834
- Rent YoY
- ▲ 7.96%
- Metro
- New York-Newark-Jersey City, NY-NJ-PA
- State GDP YoY
- ▲ 2.60%
- F500 in state
- 92
Industry mix (Fortune 500 HQ in NY)
| Industry | F500 HQs | Revenue |
|---|---|---|
| Financial Services | 10 | $950B |
|
||
| Consumer Goods | 9 | $162B |
|
||
| Insurance | 4 | $225B |
|
||
| Telecommunications | 2 | $144B |
|
||
| Pharmaceuticals | 2 | $112B |
|
||
| Media / Entertainment | 2 | $69B |
|
||
Price history
2 events — show timeline
- 2026-04-04 Pending — BNYMLS
- 2026-03-18 Listed $309,000 BNYMLS
Cash-flow waterfall
monthlySold comps — $/sqft
last 12 mo · ≤1 miLoading sold comps…