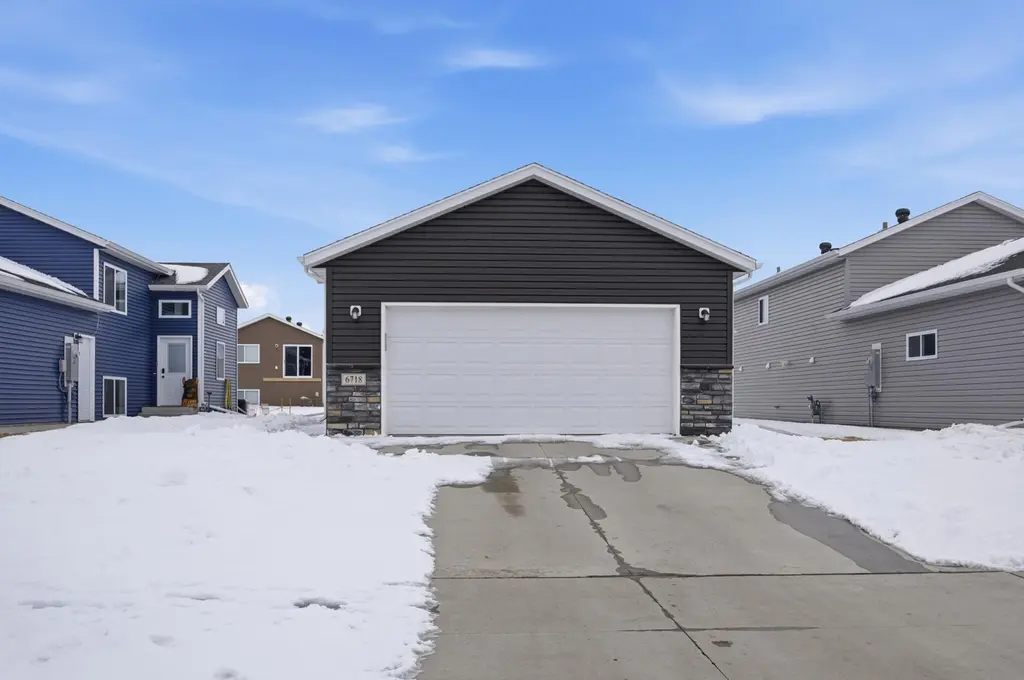
6718 69th Ave S · Horace, ND
Flood risk 1/10 · Minimal
- FEMA flood zone
- X
- Chance of flooding over 30 yrs
- 0.0%
- Est. flood insurance / yr
- $507 – $1,088
Fire risk 1/10 · Minimal
- Est. fire insurance / yr
- $1,289 – $2,393
Heat risk 2/10 · Minimal
- Hot days now (above 98°F)
- 7 days/yr
- Hot days in 30 yrs
- 12 days/yr
Wind risk 2/10 · Minimal
- Chance of severe wind over 30 yrs
- —
Air-quality risk 3/10 · Minor
- Unhealthy air days now
- 3 days/yr
- Unhealthy air days in 30 yrs
- 3 days/yr
Risk factors via First Street. Map © Google.
Why this score? — see what drove the F grade
The composite is a weighted blend of 9 inputs, each scored 0–100. Each bar is that input's sub-score; the figure is the points it added to the 100-point composite (weight × sub-score).
- ARV discount +7.5/15.0
- Cash flow +6.3/30.0
- Condition / age +4.0/5.0
- Schools +3.7/10.0
- Livability +3.7/5.0
- Rent growth +2.5/5.0
- 1% rule +1.3/10.0
- DSCR +0.6/10.0
- Appreciation +0.0/10.0
$289,900
🖨 Deal sheet (PDF) 📄 Offer letter ✓ Due diligence
Key facts
- 5,270 sq ft lot
- 2 garage spots
- Built 2022
Property features AI
Exterior
- Parking: Attached 2-car garage
- Utilities: City water; City sewer; Natural gas
- Home design: Residential property; Split entry (bi-level) design; Entry level: Main; Roof under 8 years old
- Construction: Concrete foundation; Roof replaced within last 8 years
- Exterior features: Stone and vinyl exterior; Partial fencing; Deck; Lot approximately 44 x 125 (0.121 acres)
Interior
- Kitchen: Range; Microwave; Dishwasher; Refrigerator; Kitchen center island; Kitchen window
- Bedrooms: 3 bedrooms (all on main level)
- Bathrooms: 2 full bathrooms
- Heating & cooling: Forced air heating; Central air conditioning
- Interior features: Dishwasher; Dryer; Microwave; Range; Refrigerator; Washer; Concrete basement; Deck; Primary bedroom walk-in closet; Kitchen center island; Kitchen window
- Laundry & utility: Washer and dryer; Laundry in basement
Neighborhood map
What this means for you Summary
Snapshot
- This is a 2-bed/2.0-bath single-family listed at $290k. Condition is rated good.
Deal economics
- At list price, monthly cash flow is $-515 ($-6k/yr) — negative.
- To cash-flow at today's rent, offer at most $199k (31.4% below list).
- To meet the 1% rule (rent ≥ 1% of price), the offer needs to be $181k (37.4% below list).
- Recommended offer: $181k (37.4% below list) — sets the bar for 1% rule.
Location & tenants
- Location reads 74/100 on livability (#29 in ND, #4,718 nationally) — a middle-class / working-renter tenant base. Strengths: crime A+, employment A+, housing A+; Watch: cost of living C-, health & safety D+, amenities F.
- West Fargo 6 (suburban): math 41% / reading 42% proficiency, ranked #26 of 53 in ND (top 49%) — families likely to look elsewhere, expect single-tenant / working-renter base with shorter leases.
- Zoned schools: Osgood Elem School (math 41% / reading 39%, grade F, #132 of 236 statewide, top 57%, 564 students, 37% FRL); Liberty Middle School (math 33% / reading 39%, grade F, #23 of 35 statewide, top 65%, 1,102 students, 23% FRL); West Fargo Sheyenne High School (math 29% / reading 37%, grade F, #84 of 144 statewide, top 58%, 1,473 students, 20% FRL) — zoned schools at 27% FRL track the district average.
- Market conditions: 460 active listings in the ZIP; 1 comparable units currently listed for rent nearby; high-income renter base; 1,218 units permitted in Cass County in 2024 (410 in 5+ unit buildings).
- This rent is only 15% of the median local income ($142k/yr) — well below the 30% rent-burden line; pricing power to push rent on renewal without tenant pushback.
Forward outlook
- Local home prices are declining (-3.0%/yr); year-one equity from $2k of loan paydown is wiped out by about $9k of value loss. Plan a longer hold.
- Cass County population projected at +69% by 2050 — long-run rental-demand tailwind backs the buy-and-hold thesis.
Negotiation context
- It's been on market 74 days — a 6% lower offer ($273k) is reasonable based on typical stale-listing flexibility.
- 4 sale attempts since 4y ago; this cycle's ask has dropped $20k (6%) from the opening price — seller is motivated, your offer sets the floor, not the list.
- Current owner paid $250k; 16% above their basis — modest negotiation headroom, anchor on the comps not their cost.
Questions for the listing agent
- What do current leases actually rent for vs. the listed asking? Can we see a recent rent roll and the last 12 months of T-12 income?
- It's been on market 74 days. Have you received any prior offers? Is the seller open to a 37% concession, seller financing, or rate buy-down credit?
- Why hasn't it sold? Are there any deal-killer items the seller is aware of (foundation, flood, title, zoning, code violations)?
- Is there a deadline driving the sale (1031 exchange, divorce, estate, relocation)? That informs how much negotiation room exists.
- Schools are A-rated — typically a magnet for longer-tenancy family renters. What's the average tenant stay here, and is there a school-zone premium baked into asking?
- The area grade is low — what's the realistic commute time and amenity access for the typical tenant pool here? Any planned neighborhood developments (good or bad) we should know about?
- What's the average days-on-market for RENTAL listings here right now (not sales)? A rising rental-DOM trend means longer vacancies and softer asking-rent achievability than the comps imply.
- What's the recent tenant-quality profile in this submarket — average credit score on applications, eviction rate, late-payment / NSF rate, and stable-employment percentage? A property-management company in the area should have these aggregated.
- How much new for-sale + rental construction is in the pipeline within 1–3 miles? Heavy new supply typically softens prices + rents 12–24 months out; constrained supply supports both.
Investment metrics
- 1% rule
- 0.63% ✗
- Cap rate
- 4.16%
- Cash-on-cash
- -7.61%
- DSCR
- 0.66
- GRM
- 13.3
CMA / ARV
No comps found within radius.
Projected returns pro-forma
-3.0% appreciation · 3.0% rent growth · sell at horizon
- IRR
- -29.6%
- Equity multiple
- 0.02×
- Total profit
- $-79,766
- Equity at exit
- $43,225
- IRR
- -30.5%
- Equity multiple
- -0.38×
- Total profit
- $-111,700
- Equity at exit
- $25,065
Cash invested: $81,172 (down + closing). Projections, not guarantees.
Landlord ↔ Tenant lean methodology
- Overall (STATE)
- 82 Strongly Landlord-Friendly
- State North Dakota
- 82 Strongly Landlord-Friendly · R+20
- County
- — inherits STATE
- City
- — inherits STATE
ZIP-level market 58047
- Active inventory
- 460
- Price-to-rent
- 13.3×
Monthly cashflow live
- Estimated rent
- $1,814 medium interval (Pro) →
- Mortgage (P&I)
- −$1,520
- Tax from tax record
- −$307 /mo · $3,681/yr
- Insurance
- −$121
- HOA
- −$0
- Vacancy / Maint / Mgmt
- −$381
- Net cashflow
- $-515
Break-even live
Sensitivity live
| Price | -10% $-351 | -5% $-433 | +0% $-515 | +5% $-597 | +10% $-679 |
|---|---|---|---|---|---|
| Rent | -10% $-658 | -5% $-586 | +0% $-515 | +5% $-443 | +10% $-371 |
| Rate | -1.0pp $-369 | -0.5pp $-441 | base $-515 | +0.5pp $-590 | +1.0pp $-666 |
UW: 25.0% down · 7.5% · 30yr · 1.5% tax · 5.0% vac · 8.0% maint · 8.0% mgmt
Financing live
Cash to close
- Down payment
- $72,475
- Closing costs
- $8,697
- Reserves months
- —
- Total cash needed
- —
Loan-product check · same deal, 3 products live
Conventional
25% down · 7.5% · 30yr
- Down + closing
- —
- Monthly P&I
- —
- Monthly cashflow
- —
- DSCR
- —
- Eligible?
- —
Personal DTI + credit; lowest rate.
DSCR
20% down · 8.5% · 30yr
- Down + closing
- —
- Monthly P&I
- —
- Monthly cashflow
- —
- DSCR
- —
- Eligible?
- —
No personal income docs; deal must DSCR.
Hard money
10% down · 12.0% · 12mo
- Down + closing
- —
- Monthly P&I
- —
- Monthly cashflow
- —
- DSCR
- —
- Eligible?
- —
Short-term bridge; refi at stabilization.
Rent comps 1 comps
| Address | Beds | Baths | Sqft | Rent | $/sqft | DOM | Units | Dist |
|---|---|---|---|---|---|---|---|---|
| 7994 Jacks Way Horace, ND | 1.0–2.0 | 1.0–2.0 | 898 | $1,599 | $1.78 | 15d | 16 | 0.85mi |
Listing history 32 events
-
2026-06-21days on market $289,900 Active 74 DOM
-
2026-06-18days on market $289,900 Active 71 DOM
-
2026-06-17days on market $289,900 Active 70 DOM
-
2026-06-16days on market $289,900 Active 69 DOM
-
2026-06-15days on market $289,900 Active 68 DOM
-
2026-06-14days on market $289,900 Active 66 DOM
-
2026-06-13days on market $289,900 Active 65 DOM
-
2026-06-10pricedays on market $289,900 Active 63 DOM
-
2026-06-09days on market $294,900 Active 62 DOM
-
2026-06-08days on market $294,900 Active 61 DOM
-
2026-06-07days on market $294,900 Active 60 DOM
-
2026-06-05days on market $294,900 Active 57 DOM
-
2026-06-03days on market $294,900 Active 56 DOM
-
2026-06-02days on market $294,900 Active 55 DOM
-
2026-06-01days on market $294,900 Active 54 DOM
-
2026-05-31days on market $294,900 Active 53 DOM
-
2026-05-30days on market $294,900 Active 52 DOM
-
2026-05-13price $299,900
-
2026-04-24price $304,900
-
2026-04-08$309,900 Active
-
2025-12-23historical
-
2025-12-16price $286,900
-
2025-12-01price $287,900
-
2025-09-26$289,900 Active
-
2025-07-21historical
-
2025-07-11price $295,000
-
2025-06-16price $299,800
-
2025-06-09price $302,900
-
2025-05-27$304,900 Active
-
2022-08-15soldstatus $250,051
-
2022-08-15soldstatus $31,500
-
2022-08-14$250,051
ⓘ Source: listings_history table (triggers on properties + properties_extension) + one-shot
backfill from property_details.listing_events for pre-trigger history.
Tax reassessment forecast ND · Resets to sale price
- Current annual tax
- $3,681 · $307/mo
- Projected year-2 tax
- $3,681 · $307/mo
- Expected delta
- $0/yr ($0/mo · 0.0%)
ⓘ Screening estimate from a state-policy table — verify with the county assessor before closing.
Climate risk First Street
- Flood 1/10 Low FEMA zone X · 0% chance over 30 yrs
- Wildfire 1/10 Low
- Heat 2/10 Low 7 d/yr ≥98°F today · 12 d/yr by 30 yrs out
- Wind 2/10 Low
- Air quality 3/10 Moderate 3 unhealthy d/yr today · 3 by 30 yrs out
Nearby sold comps map
Loading sold comps map…
Walkable amenities ~0.75 mi
Loading nearby amenities…
Taxation est. · year 1
- Rental income
- $21,769
- − Mortgage interest
- −$16,239
- − Property taxes
- −$3,681
- − Insurance
- −$1,450
- − Repairs & maintenance
- −$1,741
- − Management
- −$1,741
- − Depreciation
- −$8,433
- Taxable loss
- −$11,517
- Est. tax savings @ 24.0%
- +$2,764
- After-tax cash flow
- $-3,413/yr
For passive investors: Depreciation is non-cash, so a rental often shows a tax loss while cash-flowing — sheltering income. Rental losses are passive: they offset passive income freely, and up to $25,000/yr can offset ordinary (W-2) income if you actively participate and your MAGI is under $100k (phasing out to $0 by $150k); unused losses carry forward. On sale, claimed depreciation is recaptured at up to 25%, and gains may owe capital-gains tax (a 1031 exchange can defer both). Figures are a year-1 estimate at your 24.0% rate — not tax advice; consult a CPA.
Condition & rehab AI · 12 photos
This home is in good condition with a good exterior and interior. It has a good foundation and structure. The home is move-in ready with minor cosmetic updates that would increase its value.
Value-add opportunities
- Both Paint exterior trim — Enhances curb appeal and value
- Both Replace carpet with hardwood — Improves aesthetics and is easier to maintain
- Both Install new windows — Better energy efficiency and increased curb appeal
Renovation cost estimate screening
Value-add ROI direction
- Both Paint exterior trim — Enhances curb appeal and value ↑
- Both Replace carpet with hardwood — Improves aesthetics and is easier to maintain ↑
- Both Install new windows — Better energy efficiency and increased curb appeal ↑
ⓘ Cost ranges are severity-bucket heuristics (US national rule-of-thumb). Get contractor quotes + a written scope before underwriting a rehab budget.
Schools (NCES district)
- District
- West Fargo 6
- NCES district ID
- 3819410
- Math proficiency
- 41% ▼ -10.00%
- Reading proficiency
- 42% ▼ -10.00%
- Median HH income
- $58,914
- Composite
- 36.6/100
- National rank
- #4628
- State rank
- #26 of 53 in ND
Livability — Horace
- Score
- 74/100
- State rank
- #29
- US rank
- #4718
Category grades
Schools grade is shown separately in the Schools card above.
Census & demographics
- Census place
- Horace, ND
- County
- Cass County · 177,143 people
- City population
- 5,636
- Metro
- Fargo, ND-MN
- Population (ZIP)
- 5,636
- Household income
- $142,361
- Rent vs Own
- Severe rent burden
- 8.0
Population outlook (Cass County) Hauer SSP2
- Today (2025)
- 223,771 people
- By 2030
- 251,835 · +12.5%
- By 2040
- 311,816 · +39.3%
- By 2050
- 378,694 · +69.2%
- By 2075
- 571,386 · +155.3%
- By 2100
- 769,727 · +244.0%
Race, ethnicity, and origin ACS 2023
- Neighborhood character
- Predominantly White (89%)
- Race & ethnicity
- White 89% Hispanic / Latino 6% Two or more races 4% Black 2%
- Hispanic origin (detail)
- Mexican 4% Puerto Rican 2%
- Common ancestry
- Portuguese 26% Scotch-Irish 7% Lithuanian 4%
- Foreign-born
- 2% · Canada
- Languages at home
- 95% English-only · Spanish 4%
Political lean MEDSL · Cass
- 2024 margin
- Lean R (+8.4) · D 44.9% · R 53.3% · Other 1.9%
- 2008→2024 swing
- -15.5pp toward R · 2008: 7.1pp · 2024: -8.4pp
- All cycles
- 2024: R+8.4 2020: R+2.7 2016: R+10.7 2012: R+3.0 2008: D+7.1
Not yet ingested
- Civics
- —
Market trends
- HPI YoY
- ▼ -113.83%
- Current HPI
- 178.7028
- Rent YoY
- —
- Metro
- Fargo, ND-MN
- State GDP YoY
- ▲ 2.09%
- F500 in state
- 2
Industry mix (Fortune 500 HQ in ND)
| Industry | F500 HQs | Revenue |
|---|---|---|
| Utilities / Construction | 1 | $6B |
|
||
Price history
+19.9% since first listed15 events — show timeline
- 2026-05-13 Price Changed $299,900 NORTHSTARMLS as Distributed by MLS Grid
- 2026-04-24 Price Changed $304,900 NORTHSTARMLS as Distributed by MLS Grid
- 2026-04-08 Listed $309,900 NORTHSTARMLS as Distributed by MLS Grid
- 2025-12-23 Listing Removed — NORTHSTARMLS as Distributed by MLS Grid
- 2025-12-16 Price Changed $286,900 NORTHSTARMLS as Distributed by MLS Grid
- 2025-12-01 Price Changed $287,900 NORTHSTARMLS as Distributed by MLS Grid
- 2025-09-26 Listed $289,900 NORTHSTARMLS as Distributed by MLS Grid
- 2025-07-21 Listing Removed — NORTHSTARMLS as Distributed by MLS Grid
- 2025-07-11 Price Changed $295,000 NORTHSTARMLS as Distributed by MLS Grid
- 2025-06-16 Price Changed $299,800 NORTHSTARMLS as Distributed by MLS Grid
- 2025-06-09 Price Changed $302,900 NORTHSTARMLS as Distributed by MLS Grid
- 2025-05-27 Listed $304,900 NORTHSTARMLS as Distributed by MLS Grid
- 2022-08-15 Sold (Public Records) $31,500 Public Records
- 2022-08-15 Sold (MLS) $250,051 NORTHSTARMLS as Distributed by MLS Grid
- 2022-08-14 Listed $250,051 NORTHSTARMLS as Distributed by MLS Grid
Property tax history
+131.8%/yrLatest (2025): $3,681 · +8.3% YoY. Source: county tax records.
Cash-flow waterfall
monthlySold comps — $/sqft
last 12 mo · ≤1 miLoading sold comps…