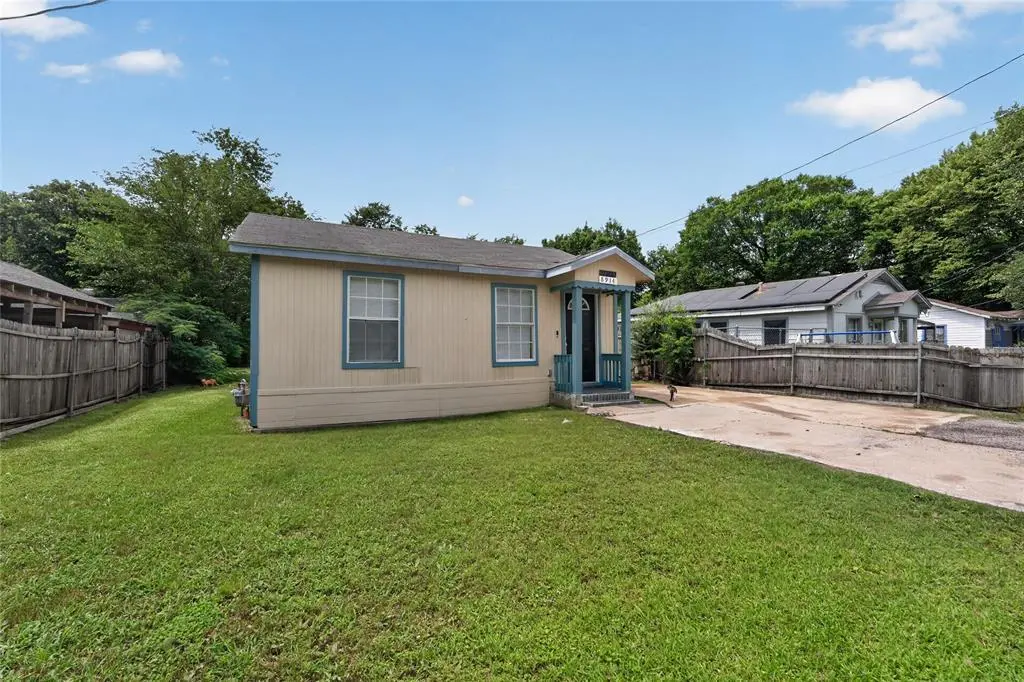
8914 Cardella Ave · Dallas, TX
Flood risk 1/10 · Minimal
- FEMA flood zone
- X (unshaded)
- Chance of flooding over 30 yrs
- 0.0%
- Est. flood insurance / yr
- $507 – $1,088
Fire risk 2/10 · Minimal
- Est. fire insurance / yr
- $1,222 – $2,270
Heat risk 7/10 · Major
- Hot days now (above 110°F)
- 7 days/yr
- Hot days in 30 yrs
- 24 days/yr
Wind risk 6/10 · Moderate
- Chance of severe wind over 30 yrs
- 27.0%
Air-quality risk 2/10 · Minimal
- Unhealthy air days now
- 1 days/yr
- Unhealthy air days in 30 yrs
- 2 days/yr
Risk factors via First Street. Map © Google.
Why this score? — see what drove the D- grade
The composite is a weighted blend of 9 inputs, each scored 0–100. Each bar is that input's sub-score; the figure is the points it added to the 100-point composite (weight × sub-score).
- Cash flow +13.8/30.0
- 1% rule +4.9/10.0
- DSCR +4.2/10.0
- Livability +4.0/5.0
- ARV discount +3.8/15.0
- Rent growth +2.8/5.0
- Schools +2.8/10.0
- Condition / age +2.5/5.0
- Appreciation +0.0/10.0
$169,900
🖨 Deal sheet (PDF) 📄 Offer letter ✓ Due diligence
Listing remarks MLS
Motivated seller! Cute 2 bedroom home with a large back yard. Plenty of parking in drive-way with an outbuilding and a storage. Buyer to purchase survey.
Key facts
- Covered front porch
- Walk-in closets
- Storage shed
Tags
Property features AI
Finance
- Financial info: Accepts Cash, Conventional, FHA, and VA financing
- HOA & community: No HOA / association
Exterior
- Parking: Enclosed carport; Driveway; Two carport spaces; One covered space
- Utilities: City water; City sewer; Cable available; No municipal utility district
- Home design: Single-family residence; One level; Residential property; Not attached to another property
- Construction: Built in 1951; Siding exterior; Composition roof; Pillar/post/pier foundation
- Exterior features: Covered porch(es); Outdoor storage
Interior
- Kitchen: Gas cooktop; Gas range
- Bedrooms: Two bedrooms (both on the main level)
- Flooring: Ceramic tile; Laminate
- Bathrooms: Two full bathrooms
- Interior features: Five total rooms; Other interior features
- Laundry & utility: Gas water heater
Neighborhood map
What this means for you Summary
Snapshot
- This is a 2-bed/1.5-bath single-family listed at $170k.
Deal economics
- At list price, monthly cash flow is $16 ($196/yr) — positive.
- The deal already cash-flows at list — no discount required.
- To meet the 1% rule (rent ≥ 1% of price), the offer needs to be $169k (0.6% below list).
- Recommended offer: $167k (1.5% below list) — sets the bar for market timing.
- Cap rate 6.4% vs local median 2.3% in Dallas — top-decile yield for the area; either an underpriced asset or a hidden risk that comps aren't pricing in. Stress-test before assuming the spread holds.
Location & tenants
- Location reads 81/100 on livability (#24 in TX, #1,380 nationally) — a professional / high-income tenant draw. Strengths: amenities A+, commute A+, housing A+; Watch: crime F.
- Dallas ISD (urban): math 31% / reading 36% proficiency, ranked #559 of 826 in TX (top 68%) — families likely to look elsewhere, expect single-tenant / working-renter base with shorter leases; 83% free/reduced lunch — lower-income household profile, screen leases tightly.
- Zoned schools: William M Anderson El (math 27% / reading 32%, grade F, #2,525 of 4,322 statewide, top 62%, 504 students, 100% FRL); Young Women'S Steam Academy At Balch Springs Middl (math 31% / reading 34%, grade F, #947 of 1,662 statewide, top 58%, 869 students, 91% FRL); H Grady Spruce H S (math 21% / reading 18%, grade F, #1,424 of 1,632 statewide, top 88%, 1,558 students, 96% FRL).
- Market conditions: Rents rising (+1.0%/yr); 203 active listings in the ZIP; 24 comparable units currently listed for rent nearby; rentals at typical pace (median 26d on market — plan ~3-4 weeks tenant-placement turnaround); 42% of comp listings sitting > 30 days — soft ceiling on asking rent; 12,577 units permitted in Dallas County in 2024 (6,829 in 5+ unit buildings).
- This rent runs 36% of the median local income ($56k/yr) — at the standard rent-burdened threshold; future hikes will face affordability resistance.
Forward outlook
- Local home prices are declining (-3.0%/yr); year-one equity from $1k of loan paydown is wiped out by about $5k of value loss. Plan a longer hold.
- Dallas County population projected at +35% by 2050 — long-run rental-demand tailwind backs the buy-and-hold thesis.
Negotiation context
- It's been on market 24 days — a 2% lower offer ($167k) is reasonable based on typical stale-listing flexibility.
- 10 sale attempts since 5y ago; this cycle's ask has dropped $10k (6%) from the opening price — seller is motivated, your offer sets the floor, not the list.
- Current owner paid $16k; list at $170k implies a 996% gain — meaningful room to come down on a strong offer.
Risks & watch-outs
- Watch-outs: property tax is 2.5% of price; built in 1951 — expect roof / HVAC / electrical / plumbing capex.
- Climate carrying-cost: major wind risk, 27% chance of damaging wind over 30y; extreme-heat days projected 7→24/yr by 2055 (HVAC capex compounding) — expect insurance premiums to compound above CPI over the hold.
Questions for the listing agent
- Built in 1951 — when were the roof, HVAC, electrical panel, plumbing, and water heater last replaced?
- Property tax is high relative to price — has the assessment been appealed recently, and will the sale trigger a re-assessment?
- Is there a deadline driving the sale (1031 exchange, divorce, estate, relocation)? That informs how much negotiation room exists.
- Crime grade is F in this area — have there been break-ins, vandalism, or insurance claims at this property in the last 3 years? What carrier currently insures it and at what premium?
- The area grade is low — what's the realistic commute time and amenity access for the typical tenant pool here? Any planned neighborhood developments (good or bad) we should know about?
- What's the average days-on-market for RENTAL listings here right now (not sales)? A rising rental-DOM trend means longer vacancies and softer asking-rent achievability than the comps imply.
- What's the recent tenant-quality profile in this submarket — average credit score on applications, eviction rate, late-payment / NSF rate, and stable-employment percentage? A property-management company in the area should have these aggregated.
- How much new for-sale + rental construction is in the pipeline within 1–3 miles? Heavy new supply typically softens prices + rents 12–24 months out; constrained supply supports both.
Investment metrics
- 1% rule
- 0.99% ✗
- Cap rate
- 6.41%
- Cash-on-cash
- 0.41%
- DSCR
- 1.02
- GRM
- 8.4
CMA / ARV
- ARV (on-the-fly)
- $157,000
- Comps found
- 11
Show comp detail 11 sales within ~0.75 mi
| Address | Dist | Beds/Ba | Sqft | Sold | Price | $/sf | Match |
|---|---|---|---|---|---|---|---|
| 8904 Briley Rd | 0.23mi | 3/2.0 (+1) | 1,048 (+5%) | 4mo | $217,000 | $207 | 71 |
| 9631 Silver Meadow Dr | 0.71mi | 2/1.0 | 1,008 (+1%) | 3mo | $145,000 | $144 | 61 |
| 8544 Eden Valley Ln | 0.44mi | 2/1.0 | 894 (-11%) | 8mo | $165,000 | $185 | 53 |
| 8818 Cardella Ave | 0.07mi | 2/1.0 | 864 (-14%) | 24mo | $105,000 | $122 | 53 |
| 9223 Marvel Dr | 0.56mi | 3/1.0 (+1) | 926 (-7%) | 3mo | $179,990 | $194 | 52 |
| 1002 N Saint Augustine Dr | 0.56mi | 3/1.0 (+1) | 1,022 (+2%) | 14mo | $179,999 | $176 | 52 |
| 8707 Slay St | 0.26mi | 3/1.0 (+1) | 1,090 (+9%) | 18mo | $167,200 | $153 | 51 |
| 9703 Silver Meadow Dr | 0.72mi | 3/1.0 (+1) | 980 (-2%) | 13mo | $125,000 | $128 | 45 |
| 729 Manhattan Dr | 0.67mi | 3/2.0 (+1) | 1,085 (+8%) | 17mo | $170,000 | $157 | 34 |
| 8634 Comer Dr | 0.66mi | 3/1.0 (+1) | 1,112 (+11%) | 12mo | $169,900 | $153 | 34 |
| 8717 Odom Dr | 0.44mi | 3/1.0 (+1) | 864 (-14%) | 21mo | $150,000 | $174 | 32 |
Match score weights: distance 35% · size 25% · config 20% · recency 20%. Top-matched comps best support the ARV.
Projected returns pro-forma
-3.0% appreciation · 1.02% rent growth · sell at horizon
- IRR
- -18.1%
- Equity multiple
- 0.38×
- Total profit
- $-29,679
- Equity at exit
- $25,333
- IRR
- -15.2%
- Equity multiple
- 0.22×
- Total profit
- $-37,059
- Equity at exit
- $14,690
Cash invested: $47,572 (down + closing). Projections, not guarantees.
Landlord ↔ Tenant lean methodology
- Overall (STATE)
- 87 Strongly Landlord-Friendly
- State Texas
- 87 Strongly Landlord-Friendly · R+5
- County
- — inherits STATE
- City
- — inherits STATE
ZIP-level market 75217
- Home prices YoY
- -4.3%
- Rents YoY
- 1.0%
- Active inventory
- 203
- Price-to-rent
- 8.4×
Monthly cashflow live
- Estimated rent
- $1,690 high interval (Pro) →
- Mortgage (P&I)
- −$891
- Tax from tax record
- −$357 /mo · $4,280/yr
- Insurance
- −$71
- HOA
- −$0
- Vacancy / Maint / Mgmt
- −$355
- Net cashflow
- $16
Break-even live
Sensitivity live
| Price | -10% $112 | -5% $64 | +0% $16 | +5% $-32 | +10% $-80 |
|---|---|---|---|---|---|
| Rent | -10% $-117 | -5% $-50 | +0% $16 | +5% $83 | +10% $150 |
| Rate | -1.0pp $102 | -0.5pp $60 | base $16 | +0.5pp $-28 | +1.0pp $-73 |
UW: 25.0% down · 7.5% · 30yr · 1.5% tax · 5.0% vac · 8.0% maint · 8.0% mgmt
Financing live
Cash to close
- Down payment
- $42,475
- Closing costs
- $5,097
- Reserves months
- —
- Total cash needed
- —
Loan-product check · same deal, 3 products live
Conventional
25% down · 7.5% · 30yr
- Down + closing
- —
- Monthly P&I
- —
- Monthly cashflow
- —
- DSCR
- —
- Eligible?
- —
Personal DTI + credit; lowest rate.
DSCR
20% down · 8.5% · 30yr
- Down + closing
- —
- Monthly P&I
- —
- Monthly cashflow
- —
- DSCR
- —
- Eligible?
- —
No personal income docs; deal must DSCR.
Hard money
10% down · 12.0% · 12mo
- Down + closing
- —
- Monthly P&I
- —
- Monthly cashflow
- —
- DSCR
- —
- Eligible?
- —
Short-term bridge; refi at stabilization.
Rent comps 24 comps
| Address | Beds | Baths | Sqft | Rent | $/sqft | DOM | Units | Dist |
|---|---|---|---|---|---|---|---|---|
| 8714 Quinn St Unit B Dallas, TX | 2.0 | 2.0 | 1090 | $1,495 | $1.37 | 26d | 1 | 0.27mi |
| 1007 Boquillas Ct Dallas, TX | 3.0 | 2.0 | 1302 | $1,895 | $1.46 | 45d | 1 | 0.32mi |
| 9605 Kittyhawk Ln Dallas, TX | 3.0 | 2.0 | 1019 | $2,200 | $2.16 | 20d | 1 | 0.57mi |
| 8438 Maddox St Dallas, TX | 2.0 | 1.0 | 784 | $1,450 | $1.85 | 4d | 1 | 0.60mi |
| 9807 Tamalpais Dr Dallas, TX | 3.0 | 2.0 | 1493 | $1,985 | $1.33 | 45d | 1 | 0.75mi |
| 250 Prairie Grove Dr Dallas, TX | 3.0 | 2.0 | 1164 | $1,770 | $1.52 | 14d | 1 | 1.00mi |
| 8120 Rayville Dr Dallas, TX | 2.0 | 1.0 | 960 | $1,495 | $1.56 | 26d | 1 | 1.04mi |
| 912 Carom Way Dallas, TX | 3.0 | 2.0 | 1156 | $1,740 | $1.51 | 0d | 1 | 1.14mi |
| 10121 Muskogee Dr Dallas, TX | 3.0 | 2.0 | 1381 | $1,900 | $1.38 | 26d | 1 | 1.16mi |
| 8840 Milverton Dr Dallas, TX | 3.0 | 1.5 | 1016 | $1,599 | $1.57 | 45d | 1 | 1.16mi |
| 1201 Rose Garden Ave Dallas, TX | 3.0 | 2.0 | 1472 | $1,750 | $1.19 | 45d | 1 | 1.24mi |
| 9645 Limestone Dr Dallas, TX | 3.0 | 2.0 | 1178 | $2,000 | $1.70 | 45d | 1 | 1.25mi |
| 9605 Grady Ln Dallas, TX | 3.0 | 2.0 | 950 | $700 | $0.74 | 4d | 1 | 1.26mi |
| 8127 Stonehurst St #5 Dallas, TX | 2.0 | 1.0 | 1050 | $1,250 | $1.19 | 45d | 1 | 1.27mi |
| 10500 Lake June Rd Unit E07 Dallas, TX | 2.0 | 1.5 | 1141 | $1,150 | $1.01 | 0d | 1 | 1.29mi |
| 10500 Lake June Rd Dallas, TX | 2.0 | 1.5 | 1141 | $1,172 | $1.03 | 8d | 2 | 1.30mi |
| 10410 Cymbal Dr Dallas, TX | 2.0 | 1.5 | 1128 | $1,350 | $1.20 | 1d | 1 | 1.33mi |
| 810 Pleasant Hills Dr Dallas, TX | 3.0 | 2.0 | 1305 | $1,799 | $1.38 | 45d | 1 | 1.36mi |
| 1415 Amity Ln Dallas, TX | 3.0 | 2.0 | 1364 | $1,780 | $1.30 | 45d | 1 | 1.38mi |
| 1705 Allentown Dr Dallas, TX | 3.0 | 2.0 | 1195 | $1,725 | $1.44 | 26d | 1 | 1.42mi |
| 840 Pleasant Hills Dr Dallas, TX | 3.0 | 2.0 | 1011 | $2,200 | $2.18 | 1d | 1 | 1.44mi |
| 10206 Shayna Dr Dallas, TX | 3.0 | 2.0 | 1253 | $1,850 | $1.48 | 15d | 1 | 1.46mi |
| 1937 Red Cloud Dr Dallas, TX | 3.0 | 2.0 | 1196 | $1,695 | $1.42 | 45d | 1 | 1.47mi |
| 9415 Bruton Rd Dallas, TX | 1.0–3.0 | 1.0–2.0 | 885 | $924 | $1.04 | 45d | 1 | 1.47mi |
Listing history 46 events
-
2026-06-21days on market $169,900 Active 24 DOM
-
2026-06-18days on market $169,900 Active 21 DOM
-
2026-06-17price $169,900 Active 20 DOM
-
2026-06-17days on market $179,900 Active 20 DOM
-
2026-06-16days on market $179,900 Active 19 DOM
-
2026-06-15days on market $179,900 Active 18 DOM
-
2026-06-13days on market $179,900 Active 16 DOM
-
2026-06-09days on market $179,900 Active 12 DOM
-
2026-06-08days on market $179,900 Active 11 DOM
-
2026-06-07days on market $179,900 Active 10 DOM
-
2026-06-04days on market $179,900 Active 7 DOM
-
2026-06-03days on market $179,900 Active 6 DOM
-
2026-06-02days on market $179,900 Active 5 DOM
-
2026-06-01days on market $179,900 Active 4 DOM
-
2026-05-31days on market $179,900 Active 3 DOM
-
2026-05-28$179,900 Active
-
2025-07-31historical $1,595
-
2025-07-18$1,595
-
2023-11-29historical $1,390
-
2023-11-21price $1,390
-
2023-11-07price $1,425
-
2023-10-29price $1,460
-
2023-10-20$1,495
-
2023-10-02price $179,900
-
2023-09-23price $183,000
-
2023-09-13price $187,000
-
2023-09-08status Active
-
2023-09-02historical
-
2023-08-22status Active
-
2023-08-18historical Active Option Contract
-
2023-08-06status Active
-
2023-07-25historical Active Option Contract
-
2023-07-14price $194,900
-
2023-07-01price $199,900
-
2023-06-23status Active
-
2023-06-20historical Active Option Contract
-
2023-06-13price $205,000
-
2023-06-02$210,000 Active
-
2022-01-07soldstatus Sold 153-char remark
Show marketing remark (153 chars)
Motivated seller! Cute 2 bedroom home with a large back yard. Plenty of parking in drive-way with an outbuilding and a storage. Buyer to purchase survey.
-
2021-12-18status Pending 153-char remark
Show marketing remark (153 chars)
Motivated seller! Cute 2 bedroom home with a large back yard. Plenty of parking in drive-way with an outbuilding and a storage. Buyer to purchase survey.
-
2021-12-15status Active 153-char remark
Show marketing remark (153 chars)
Motivated seller! Cute 2 bedroom home with a large back yard. Plenty of parking in drive-way with an outbuilding and a storage. Buyer to purchase survey.
-
2021-12-08historical Active Option Contract 153-char remark
Show marketing remark (153 chars)
Motivated seller! Cute 2 bedroom home with a large back yard. Plenty of parking in drive-way with an outbuilding and a storage. Buyer to purchase survey.
-
2021-12-03price $160,000 153-char remark
Show marketing remark (153 chars)
Motivated seller! Cute 2 bedroom home with a large back yard. Plenty of parking in drive-way with an outbuilding and a storage. Buyer to purchase survey.
-
2021-11-19price $170,000 153-char remark
Show marketing remark (153 chars)
Motivated seller! Cute 2 bedroom home with a large back yard. Plenty of parking in drive-way with an outbuilding and a storage. Buyer to purchase survey.
-
2021-10-27$175,000 Active 153-char remark
Show marketing remark (153 chars)
Motivated seller! Cute 2 bedroom home with a large back yard. Plenty of parking in drive-way with an outbuilding and a storage. Buyer to purchase survey.
-
2005-06-09soldstatus $15,500
ⓘ Source: listings_history table (triggers on properties + properties_extension) + one-shot
backfill from property_details.listing_events for pre-trigger history.
Tax reassessment forecast TX · Resets to sale price
- Current annual tax
- $4,280 · $357/mo
- Projected year-2 tax
- $4,280 · $357/mo
- Expected delta
- $0/yr ($0/mo · 0.0%)
ⓘ Screening estimate from a state-policy table — verify with the county assessor before closing.
Climate risk First Street
- Flood 1/10 Low FEMA zone X (unshaded) · 0% chance over 30 yrs
- Wildfire 2/10 Low
- Heat 7/10 Severe 7 d/yr ≥110°F today · 24 d/yr by 30 yrs out
- Wind 6/10 Major 27% chance of damaging wind over 30 yrs
- Air quality 2/10 Low 1 unhealthy d/yr today · 2 by 30 yrs out
Nearby sold comps map
Loading sold comps map…
Walkable amenities ~0.75 mi
Loading nearby amenities…
Taxation est. · year 1
- Rental income
- $20,274
- − Mortgage interest
- −$9,517
- − Property taxes
- −$4,280
- − Insurance
- −$850
- − Repairs & maintenance
- −$1,622
- − Management
- −$1,622
- − Depreciation
- −$4,943
- Taxable loss
- −$2,558
- Est. tax savings @ 24.0%
- +$614
- After-tax cash flow
- $810/yr
For passive investors: Depreciation is non-cash, so a rental often shows a tax loss while cash-flowing — sheltering income. Rental losses are passive: they offset passive income freely, and up to $25,000/yr can offset ordinary (W-2) income if you actively participate and your MAGI is under $100k (phasing out to $0 by $150k); unused losses carry forward. On sale, claimed depreciation is recaptured at up to 25%, and gains may owe capital-gains tax (a 1031 exchange can defer both). Figures are a year-1 estimate at your 24.0% rate — not tax advice; consult a CPA.
Schools (NCES district)
- District
- Dallas ISD
- NCES district ID
- 4816230
- Math proficiency
- 31% ▼ -16.00%
- Reading proficiency
- 36% ▼ -4.00%
- Median HH income
- $42,881
- Composite
- 28.41/100
- National rank
- #6763
- State rank
- #559 of 826 in TX
Livability — Dallas
- Score
- 81/100
- State rank
- #24
- US rank
- #1380
Category grades
Schools grade is shown separately in the Schools card above.
Census & demographics
- Census place
- Dallas, TX
- County
- Dallas County · 2,612,404 people
- City population
- 1,168,437
- Metro
- Dallas-Fort Worth-Arlington, TX
- Population (ZIP)
- 85,028
- Household income
- $55,723
- Rent vs Own
- Severe rent burden
- 2649.0
Population outlook (Dallas County) Hauer SSP2
- Today (2025)
- 2,979,839 people
- By 2030
- 3,191,823 · +7.1%
- By 2040
- 3,619,611 · +21.5%
- By 2050
- 4,026,915 · +35.1%
- By 2075
- 4,957,073 · +66.4%
- By 2100
- 5,508,725 · +84.9%
Race, ethnicity, and origin ACS 2023
- Neighborhood character
- Predominantly Hispanic (73%)
- Race & ethnicity
- Hispanic / Latino 73% Two or more races 34% Black 20% White 6%
- Hispanic origin (detail)
- Mexican 68%
- Foreign-born
- 30% · Canada, Philippines
- Languages at home
- 34% English-only · Spanish 65% Other Asian/Pacific 1%
Political lean MEDSL · Dallas
- 2024 margin
- Strong D (+22.2) · D 60.2% · R 38.0% · Other 1.8%
- 2008→2024 swing
- +6.9pp toward D · 2008: 15.3pp · 2024: 22.2pp
- All cycles
- 2024: D+22.2 2020: D+31.6 2016: D+26.2 2012: D+15.4 2008: D+15.3
Not yet ingested
- Civics
- —
Market trends
- HPI YoY
- ▼ -17.04%
- Current HPI
- 382.5527
- Rent YoY
- ▲ 1.02%
- Metro
- Dallas-Fort Worth-Arlington, TX
- State GDP YoY
- ▲ 3.95%
- F500 in state
- 110
Industry mix (Fortune 500 HQ in TX)
| Industry | F500 HQs | Revenue |
|---|---|---|
| Energy | 16 | $1,198B |
|
||
| Technology | 5 | $198B |
|
||
| Engineering / Construction | 4 | $72B |
|
||
| Energy Services | 3 | $60B |
|
||
| Utilities | 3 | $41B |
|
||
| Healthcare | 2 | $330B |
|
||
Price history
+1060.6% since first listed31 events — show timeline
- 2026-05-28 Listed $179,900 NTREIS
- 2025-07-31 Rental Removed $1,595 RENTLY
- 2025-07-18 Listed for Rent $1,595 RENTLY
- 2023-11-29 Rental Removed $1,390 RENTLY
- 2023-11-21 Price Changed $1,390 RENTLY
- 2023-11-07 Price Changed $1,425 RENTLY
- 2023-10-29 Price Changed $1,460 RENTLY
- 2023-10-20 Listed for Rent $1,495 RENTLY
- 2023-10-02 Price Changed $179,900 NTREIS
- 2023-09-23 Price Changed $183,000 NTREIS
- 2023-09-13 Price Changed $187,000 NTREIS
- 2023-09-08 Relisted — NTREIS
- 2023-09-02 Listing Removed — NTREIS
- 2023-08-22 Relisted — NTREIS
- 2023-08-18 Contingent — NTREIS
- 2023-08-06 Relisted — NTREIS
- 2023-07-25 Contingent — NTREIS
- 2023-07-14 Price Changed $194,900 NTREIS
- 2023-07-01 Price Changed $199,900 NTREIS
- 2023-06-23 Relisted — NTREIS
- 2023-06-20 Contingent — NTREIS
- 2023-06-13 Price Changed $205,000 NTREIS
- 2023-06-02 Listed $210,000 NTREIS
- 2022-01-07 Sold (MLS) — NTREIS
- 2021-12-18 Pending — NTREIS
- 2021-12-15 Relisted — NTREIS
- 2021-12-08 Contingent — NTREIS
- 2021-12-03 Price Changed $160,000 NTREIS
- 2021-11-19 Price Changed $170,000 NTREIS
- 2021-10-27 Listed $175,000 NTREIS
- 2005-06-09 Sold (Public Records) $15,500 Public Records
Property tax history
+11.7%/yrLatest (2025): $4,280 · -0.4% YoY. Source: county tax records.
Cash-flow waterfall
monthlySold comps — $/sqft
last 12 mo · ≤1 miLoading sold comps…