 🏷️ Likely Rental
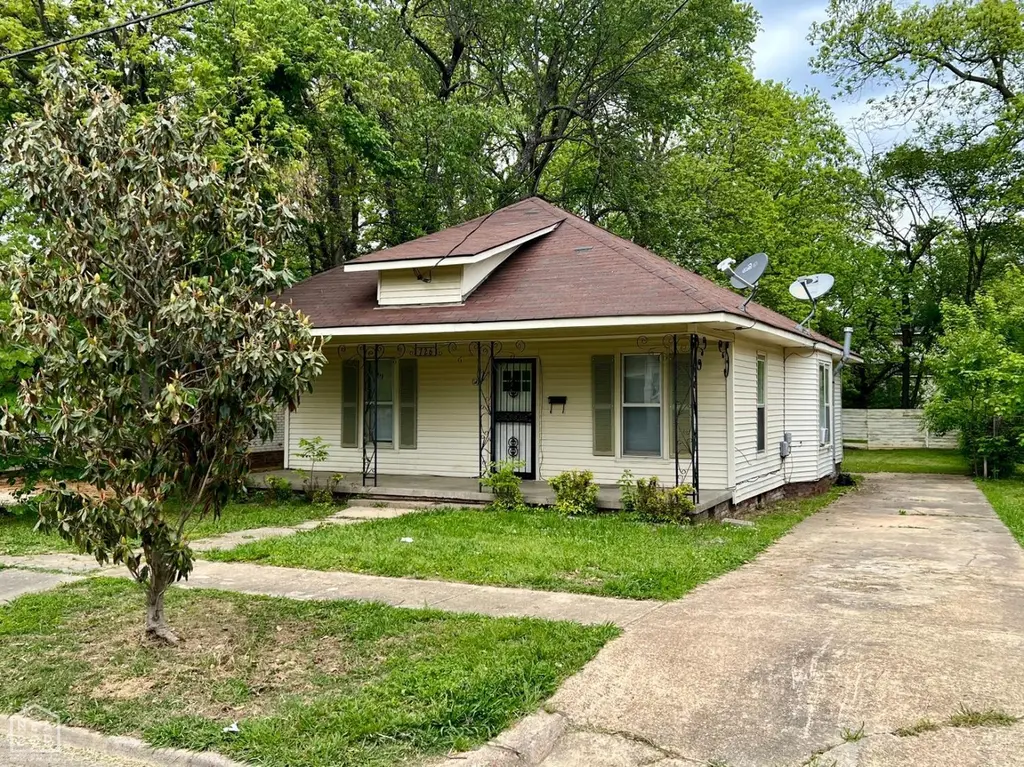
726 Warner Ave · Jonesboro, AR
Flood risk 1/10 · Minimal
- FEMA flood zone
- X
- Chance of flooding over 30 yrs
- 0.0%
- Est. flood insurance / yr
- $507 – $1,088
Fire risk 3/10 · Minor
- Est. fire insurance / yr
- $1,499 – $2,785
Heat risk 5/10 · Moderate
- Hot days now (above 109°F)
- 7 days/yr
- Hot days in 30 yrs
- 20 days/yr
Wind risk 4/10 · Minor
- Chance of severe wind over 30 yrs
- 8.0%
Air-quality risk 1/10 · Minimal
- Unhealthy air days now
- 0 days/yr
- Unhealthy air days in 30 yrs
- 0 days/yr
Risk factors via First Street. Map © Google.
Why this score? — see what drove the B grade
The composite is a weighted blend of 9 inputs, each scored 0–100. Each bar is that input's sub-score; the figure is the points it added to the 100-point composite (weight × sub-score).
- Cash flow +30.0/30.0
- ARV discount +15.0/15.0
- DSCR +10.0/10.0
- 1% rule +7.5/10.0
- Rent growth +3.4/5.0
- Livability +3.2/5.0
- Condition / age +2.5/5.0
- Schools +2.3/10.0
- Appreciation +0.0/10.0
$89,900
🖨 Deal sheet 📄 Offer letter ✓ Due diligence
Listing remarks
INVESTOR ALERT: Dual-Property Portfolio Opportunity Secure your next profitable venture with this unique investment package! This offering includes a fantastic 2 bedroom, 1 bath property that is an ideal addition to any rental portfolio. The Main Property Highlights: 3 Bedrooms, 1.5 Baths: A desirable unit size for long-term rental appeal and tenant retention. Prime Investment Potential: Ready for immediate rental or a value-add refresh. The Bundle Advantage: This property can be bought in conjunction with 706 Warner, providing an instant two-property portfolio for maximum efficiency and cash flow. Don't miss the chance to double your investment footprint in one smooth transaction!
Key facts
- 7,436 sq ft lot
- Garage
- Listed 17 days
Property features AI
Exterior
- Parking: 1-car garage
- Utilities: Public water; Public sewer; Natural gas available
- Home design: Single-family residence; One story
- Construction: Vinyl siding
- Exterior features: Level lot; Public water; Public sewer; Natural gas available
Interior
- Kitchen: Dishwasher
- Flooring: Hardwood floors; Vinyl floors
- Bathrooms: 1 full bathroom
- Heating & cooling: Central heating (natural gas); Central air conditioning
- Interior features: Dishwasher; Living room fireplace
Neighborhood map
What this means for you Summary
Snapshot
- This is a 2-bed/1.0-bath single-family listed at $90k.
Deal economics
- At list price, monthly cash flow is $340 ($4k/yr) — positive.
- The deal already cash-flows at list — no discount required.
- Meets the 1% rule at list price ($1k rent vs $90k).
- Recommended offer: $89k (1.5% below list) — sets the bar for market timing.
- Cap rate 10.8% vs local median 4.4% in Jonesboro — top-decile yield for the area; either an underpriced asset or a hidden risk that comps aren't pricing in. Stress-test before assuming the spread holds.
Location & tenants
- Location reads 65/100 on livability (#145 in AR) — a middle-class / working-renter tenant base. Strengths: cost of living A+, housing A+, health & safety A+; Watch: crime F, amenities F, commute F.
- Jonesboro School District (urban): math 28% / reading 28% proficiency, ranked #169 of 238 in AR (top 71%) — low school quality limits family demand, transient renter base, plan for 1-2y turnover; 67% free/reduced lunch — lower-income household profile, screen leases tightly.
- Zoned schools: Annie Camp Jr. High School (math 22% / reading 34%, grade F, #150 of 201 statewide, top 76%, 784 students, 100% FRL); The Academies At Jonesboro High School (math 16% / reading 27%, grade F, #225 of 292 statewide, top 78%, 1,386 students, 100% FRL) — zoned schools average 100% FRL vs 67% district-wide (33 pts higher); higher-poverty schools than district average — tighter screening recommended.
- Market conditions: Rents rising (+3.6%/yr); 295 active listings in the ZIP; 1 comparable units currently listed for rent nearby; 926 units permitted in Craighead County in 2024 (69 in 5+ unit buildings).
Forward outlook
- Local home prices are declining (-3.0%/yr); year-one equity from $622 of loan paydown is wiped out by about $3k of value loss. Plan a longer hold.
- Craighead County population projected at +38% by 2050 — long-run rental-demand tailwind backs the buy-and-hold thesis.
- At projected returns (-3.0% appreciation + 3.6% rent growth), your $25k cash investment doubles in ~8 years — after that, you're playing with house money.
Negotiation context
- It's been on market 18 days — a 2% lower offer ($89k) is reasonable based on typical stale-listing flexibility.
- 4 sale attempts since 6y ago; this cycle's ask has dropped $5k (5%) from the opening price — seller is motivated, your offer sets the floor, not the list.
- Current owner paid $45k; list at $90k implies a 100% gain — meaningful room to come down on a strong offer.
Risks & watch-outs
- Climate carrying-cost: extreme-heat days projected 7→20/yr by 2055 (HVAC capex compounding) — expect insurance premiums to compound above CPI over the hold.
Questions for the listing agent
- Is there a deadline driving the sale (1031 exchange, divorce, estate, relocation)? That informs how much negotiation room exists.
- Schools are D-rated, which usually means shorter tenancies and higher turnover. Who's the typical renter profile here, and what's been the actual vacancy rate?
- Crime grade is F in this area — have there been break-ins, vandalism, or insurance claims at this property in the last 3 years? What carrier currently insures it and at what premium?
- What's the average days-on-market for RENTAL listings here right now (not sales)? A rising rental-DOM trend means longer vacancies and softer asking-rent achievability than the comps imply.
- What's the recent tenant-quality profile in this submarket — average credit score on applications, eviction rate, late-payment / NSF rate, and stable-employment percentage? A property-management company in the area should have these aggregated.
- How much new for-sale + rental construction is in the pipeline within 1–3 miles? Heavy new supply typically softens prices + rents 12–24 months out; constrained supply supports both.
Investment metrics
- 1% rule
- 1.25% ✓
- Cap rate
- 10.83%
- Cash-on-cash
- 16.21%
- DSCR
- 1.72
- GRM
- 6.7
CMA / ARV
- ARV (on-the-fly)
- $123,120
- Comps found
- 12
Show comp detail 12 sales within ~0.75 mi
| Address | Dist | Beds/Ba | Sqft | Sold | Price | $/sf | Match |
|---|---|---|---|---|---|---|---|
| 640 Warner Ave | 0.07mi | 2/1.0 | 1,092 (-4%) | 10mo | $96,500 | $88 | 82 |
| 509 S Mcclure St | 0.21mi | 2/1.0 | 1,105 (-3%) | 5mo | $138,500 | $125 | 81 |
| 903 W Matthews Ave | 0.15mi | 3/2.0 (+1) | 1,138 (-0%) | 4mo | $169,900 | $149 | 80 |
| 809 W Monroe Ave W | 0.28mi | 2/2.0 | 1,094 (-4%) | 3mo | $95,000 | $87 | 73 |
| 1005 Chestnut St | 0.40mi | 3/1.0 (+1) | 1,155 (+1%) | 1mo | $177,000 | $153 | 73 |
| 1012 Walnut St | 0.26mi | 3/1.0 (+1) | 1,044 (-8%) | 2mo | $65,000 | $62 | 67 |
| 1519 Lamar Pl | 0.58mi | 2/1.0 | 1,118 (-2%) | 11mo | $78,000 | $70 | 60 |
| 523 W Thomas Ave | 0.58mi | 3/1.0 (+1) | 1,138 (-0%) | 9mo | $123,400 | $108 | 60 |
| 1411 W Jefferson Ave | 0.60mi | 3/2.0 (+1) | 1,103 (-3%) | 1mo | $125,000 | $113 | 57 |
| 1302 W Huntington Ave | 0.59mi | 2/1.0 | 1,284 (+13%) | 2mo | $83,333 | $65 | 50 |
| 1207 Holly St | 0.60mi | 2/1.0 | 989 (-13%) | 2mo | $76,000 | $77 | 48 |
| 1416 Brookhaven Rd | 0.75mi | 3/2.0 (+1) | 1,086 (-5%) | 9mo | $149,000 | $137 | 40 |
Match score weights: distance 35% · size 25% · config 20% · recency 20%. Top-matched comps best support the ARV.
Projected returns pro-forma
-3.0% appreciation · 3.64% rent growth · sell at horizon
- IRR
- 7.8%
- Equity multiple
- 1.31×
- Total profit
- $7,785
- Equity at exit
- $13,404
- IRR
- 17.6%
- Equity multiple
- 2.49×
- Total profit
- $37,573
- Equity at exit
- $7,773
Cash invested: $25,172 (down + closing). Projections, not guarantees.
Landlord ↔ Tenant lean methodology
- Overall (STATE)
- 92 Strongly Landlord-Friendly
- State Arkansas
- 92 Strongly Landlord-Friendly · R+14
- County
- — inherits STATE
- City
- — inherits STATE
ZIP-level market 72401
- Home prices YoY
- -34.2%
- Rents YoY
- 3.6%
- Active inventory
- 295
- Price-to-rent
- 6.7×
Monthly cashflow live
- Estimated rent
- $1,124 medium interval (Pro) →
- Mortgage (P&I)
- −$471
- Tax from tax record
- −$39 /mo · $465/yr
- Insurance
- −$37
- HOA
- −$0
- Vacancy / Maint / Mgmt
- −$236
- Net cashflow
- $340
Break-even live
UW: 25.0% down · 7.5% · 30yr · 1.5% tax · 5.0% vac · 8.0% maint · 8.0% mgmt
Financing live
Cash to close
- Down payment
- $22,475
- Closing costs
- $2,697
- Reserves months
- —
- Total cash needed
- —
Loan-product check · same deal, 3 products live
Conventional
25% down · 7.5% · 30yr
- Down + closing
- —
- Monthly P&I
- —
- Monthly cashflow
- —
- DSCR
- —
- Eligible?
- —
Personal DTI + credit; lowest rate.
DSCR
20% down · 8.5% · 30yr
- Down + closing
- —
- Monthly P&I
- —
- Monthly cashflow
- —
- DSCR
- —
- Eligible?
- —
No personal income docs; deal must DSCR.
Hard money
10% down · 12.0% · 12mo
- Down + closing
- —
- Monthly P&I
- —
- Monthly cashflow
- —
- DSCR
- —
- Eligible?
- —
Short-term bridge; refi at stabilization.
Rent comps 1 comps
| Address | Beds | Baths | Sqft | Rent | $/sqft | DOM | Units | Dist |
|---|---|---|---|---|---|---|---|---|
| 1751 W Nettleton Ave Jonesboro, AR | 2.0–3.0 | 1.0–1.5 | 1000 | $850 | $0.85 | 43d | 1 | 0.86mi |
Listing history 25 events
-
2026-06-19days on market $89,900 Active 18 DOM
-
2026-06-18days on market $89,900 Active 17 DOM
-
2026-06-17days on market $89,900 Active 16 DOM
-
2026-06-16days on market $89,900 Active 15 DOM
-
2026-06-15days on market $89,900 Active 14 DOM
-
2026-06-14days on market $89,900 Active 12 DOM
-
2026-06-13days on market $89,900 Active 11 DOM
-
2026-06-10days on market $89,900 Active 9 DOM
-
2026-06-09days on market $89,900 Active 8 DOM
-
2026-06-08days on market $89,900 Active 7 DOM
-
2026-06-07days on market $89,900 Active 6 DOM
-
2026-06-05days on market $89,900 Active 3 DOM
-
2026-06-01days on market $89,900 Active 1 DOM
-
2026-05-31days on market $89,900 Active 191 DOM
-
2026-05-30days on market $89,900 Active 190 DOM
-
2026-01-09price $89,900
-
2025-11-16$95,000 Active
-
2024-10-27historical $830
-
2024-10-22$830
-
2024-02-01$99,000 Active
-
2023-05-20historical
-
2020-05-29soldstatus $45,000
-
2020-04-23$50,500
-
2008-01-29soldstatus $45,000
-
1995-10-27soldstatus $38,000
ⓘ Source: listings_history table (triggers on properties + properties_extension) + one-shot
backfill from property_details.listing_events for pre-trigger history.
Tax reassessment forecast AR · Resets to sale price
- Current annual tax
- $465 · $39/mo
- Projected year-2 tax
- $575 · $48/mo
- Expected delta
- +$111/yr (+$9/mo · 23.8%)
ⓘ Screening estimate from a state-policy table — verify with the county assessor before closing.
Climate risk First Street
- Flood 1/10 Low FEMA zone X · 0% chance over 30 yrs
- Wildfire 3/10 Moderate
- Heat 5/10 Major 7 d/yr ≥109°F today · 20 d/yr by 30 yrs out
- Wind 4/10 Moderate 8% chance of damaging wind over 30 yrs
- Air quality 1/10 Low 0 unhealthy d/yr today · 0 by 30 yrs out
Nearby sold comps map
Loading sold comps map…
Walkable amenities ~0.75 mi
Loading nearby amenities…
Taxation est. · year 1
- Rental income
- $13,483
- − Mortgage interest
- −$5,036
- − Property taxes
- −$465
- − Insurance
- −$450
- − Repairs & maintenance
- −$1,079
- − Management
- −$1,079
- − Depreciation
- −$2,615
- Taxable income
- $2,760
- Est. tax owed @ 24.0%
- −$662
- After-tax cash flow
- $3,417/yr
For passive investors: Depreciation is non-cash, so a rental often shows a tax loss while cash-flowing — sheltering income. Rental losses are passive: they offset passive income freely, and up to $25,000/yr can offset ordinary (W-2) income if you actively participate and your MAGI is under $100k (phasing out to $0 by $150k); unused losses carry forward. On sale, claimed depreciation is recaptured at up to 25%, and gains may owe capital-gains tax (a 1031 exchange can defer both). Figures are a year-1 estimate at your 24.0% rate — not tax advice; consult a CPA.
Schools (NCES district)
- District
- Jonesboro School District
- NCES district ID
- 0508280
- Math proficiency
- 28% ▼ -9.00%
- Reading proficiency
- 28% ▼ -8.00%
- Median HH income
- $34,347
- Composite
- 23.06/100
- National rank
- #7967
- State rank
- #169 of 238 in AR
Livability — Jonesboro
- Score
- 65/100
- State rank
- #145
- US rank
- #12692
Category grades
Schools grade is shown separately in the Schools card above.
Census & demographics
- Census place
- Jonesboro, AR
- County
- Craighead County · 97,185 people
- City population
- 91,245
- Metro
- Jonesboro, AR
- Population (ZIP)
- 42,602
- Household income
- $45,329
- Rent vs Own
- Severe rent burden
- 2606.0
Population outlook (Craighead County) Hauer SSP2
- Today (2025)
- 122,235 people
- By 2030
- 131,338 · +7.4%
- By 2040
- 149,862 · +22.6%
- By 2050
- 168,034 · +37.5%
- By 2075
- 208,094 · +70.2%
- By 2100
- 233,251 · +90.8%
Race, ethnicity, and origin ACS 2023
- Neighborhood character
- Diverse neighborhood (Simpson 0.56)
- Race & ethnicity
- White 60% Black 26% Hispanic / Latino 9% Two or more races 7%
- Hispanic origin (detail)
- Mexican 8%
- Common ancestry
- Slovak 2% Italian 1% Lithuanian 1%
- Foreign-born
- 4% · Canada
- Languages at home
- 92% English-only · Spanish 7%
Political lean MEDSL · Craighead
- 2024 margin
- Solid R (+37.4) · D 30.1% · R 67.5% · Other 2.4%
- 2008→2024 swing
- -12.9pp toward R · 2008: -24.5pp · 2024: -37.4pp
- All cycles
- 2024: R+37.4 2020: R+35.4 2016: R+35.2 2012: R+31.1 2008: R+24.5
Not yet ingested
- Civics
- —
Market trends
- HPI YoY
- ▼ -108.25%
- Current HPI
- 208.2079
- Rent YoY
- ▲ 3.64%
- Metro
- Jonesboro, AR
- State GDP YoY
- ▲ 3.80%
- F500 in state
- 10
Industry mix (Fortune 500 HQ in AR)
| Industry | F500 HQs | Revenue |
|---|---|---|
| Retail | 1 | $681B |
|
||
| Food / Agriculture | 1 | $53B |
|
||
| Retail / Energy | 1 | $22B |
|
||
| Transportation / Logistics | 1 | $12B |
|
||
| Energy | 1 | $4B |
|
||
Price history
+136.6% since first listed10 events — show timeline
- 2026-01-09 Price Changed $89,900 NEABOR MLS
- 2025-11-16 Listed $95,000 NEABOR MLS
- 2024-10-27 Rental Removed $830 APPFOLIO
- 2024-10-22 Listed for Rent $830 APPFOLIO
- 2024-02-01 Listed $99,000 NEABOR MLS
- 2023-05-20 Rental Removed — RENT.
- 2020-05-29 Sold (MLS) $45,000 NEABOR MLS
- 2020-04-23 Listed $50,500 NEABOR MLS
- 2008-01-29 Sold (Public Records) $45,000 Public Records
- 1995-10-27 Sold (Public Records) $38,000 Public Records
Property tax history
+2.8%/yrLatest (2025): $465 · +1.2% YoY. Source: county tax records.
Cash-flow waterfall
monthlySold comps — $/sqft
last 12 mo · ≤1 miLoading sold comps…