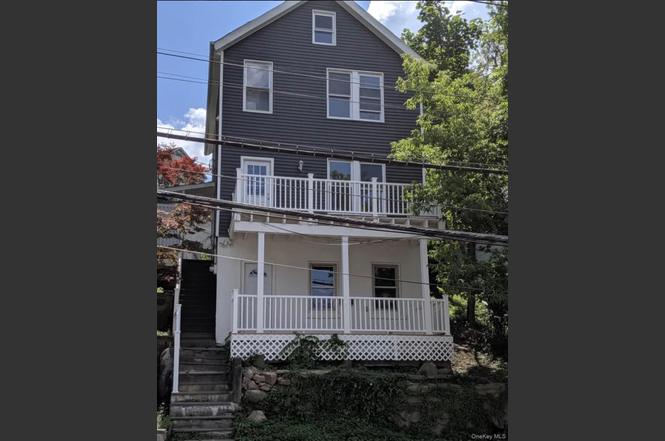
128 Croton Ave · Ossining, NY
Flood risk 1/10 · Minimal
- FEMA flood zone
- X (unshaded)
- Chance of flooding over 30 yrs
- 0.0%
- Est. flood insurance / yr
- $473 – $860
Fire risk 3/10 · Minor
- Est. fire insurance / yr
- $691 – $1,283
Heat risk 5/10 · Moderate
- Hot days now (above 100°F)
- 7 days/yr
- Hot days in 30 yrs
- 15 days/yr
Wind risk 4/10 · Minor
- Chance of severe wind over 30 yrs
- 24.0%
Air-quality risk 3/10 · Minor
- Unhealthy air days now
- 3 days/yr
- Unhealthy air days in 30 yrs
- 4 days/yr
Risk factors via First Street. Map © Google.
Why this score? — see what drove the B grade
The composite is a weighted blend of 9 inputs, each scored 0–100. Each bar is that input's sub-score; the figure is the points it added to the 100-point composite (weight × sub-score).
- Cash flow +30.0/30.0
- 1% rule +10.0/10.0
- DSCR +10.0/10.0
- ARV discount +7.5/15.0
- Schools +6.4/10.0
- Livability +4.0/5.0
- Rent growth +2.5/5.0
- Condition / age +2.5/5.0
- Appreciation +0.0/10.0
$200,000
🖨 Deal sheet 📄 Offer letter ✓ Due diligence
Listing remarks MLS
Everything new! Move right into this centrally located mixed use home and call it your own. Are you a business owner or looking to make supplemental income as a landlord? Live in this turn key ready home while renting the lower level as an office or in-law space. Recent upgrades include new siding, new plumbing and electric, new kitchen and bathrooms. Additional Information: HeatingFuel:Oil Above Ground,
Key facts
- 2,269 sq ft lot
- Parking
- Built 1872
Property features AI
Exterior
- Parking: Carport (1 space)
- Utilities: Public sewer; Electricity connected
- Home design: Single family residence
- Construction: Vinyl siding
- Exterior features: Not waterfront
Interior
- Kitchen: Dishwasher
- Bedrooms: Bedroom on the first floor
- Bathrooms: 1 full bathroom; 1 half bathroom
- Heating & cooling: Oil heating; No central cooling
- Interior features: First-floor bedroom; Finished full basement; Partial attic; 8 total rooms
Neighborhood map
What this means for you Summary
Snapshot
- This is a 3-bed/1.5-bath single-family listed at $200k.
Deal economics
- At list price, monthly cash flow is $2k ($18k/yr) — positive.
- The deal already cash-flows at list — no discount required.
- Meets the 1% rule at list price ($4k rent vs $200k).
- Cap rate 15.4% vs local median 2.9% in Ossining — top-decile yield for the area; either an underpriced asset or a hidden risk that comps aren't pricing in. Stress-test before assuming the spread holds.
Location & tenants
- Location reads 80/100 on livability (#116 in NY, #1,876 nationally) — a professional / high-income tenant draw. Strengths: commute A+, employment A+, health & safety A; Watch: cost of living F.
- Ossining Union Free School District (suburban): math 72% / reading 72% proficiency, ranked #104 of 590 in NY (top 18%) — strong family-tenant draw, lease renewals of 3-5y typical.
- Zoned schools: Park School (543 students, 46% FRL); Anne M Dorner Middle School (math 42% / reading 64%, grade C+, #231 of 729 statewide, top 32%, 1,033 students, 51% FRL); Ossining High School (math 86% / reading 82%, grade A, #404 of 1,100 statewide, top 37%, 1,552 students, 51% FRL).
- Market conditions: 134 active listings in the ZIP; 8 comparable units currently listed for rent nearby; rentals leasing fast (median 5d on market — plan ~1-2 weeks tenant-placement turnaround); high-income renter base; 954 units permitted in Westchester County in 2024 (649 in 5+ unit buildings).
- This rent runs 38% of the median local income ($116k/yr) — at the standard rent-burdened threshold; future hikes will face affordability resistance.
Forward outlook
- Local home prices are declining (-3.0%/yr); year-one equity from $1k of loan paydown is wiped out by about $6k of value loss. Plan a longer hold.
- Westchester County population projected at +10% by 2050 — modest demand growth; plan on rents tracking national, not racing it.
- At projected returns (-3.0% appreciation + 3.0% rent growth), your $56k cash investment doubles in ~4 years — after that, you're playing with house money.
Negotiation context
- Only 1 days on market — expect competitive offers; lowballing is unlikely to land.
- 11 sale attempts since 21y ago; this cycle's ask has dropped $250k (56%) from the opening price — seller is motivated, your offer sets the floor, not the list.
Risks & watch-outs
- Watch-outs: built in 1872 — expect roof / HVAC / electrical / plumbing capex.
- Climate carrying-cost: extreme-heat days projected 7→15/yr by 2055 (HVAC capex compounding) — expect insurance premiums to compound above CPI over the hold.
Questions for the listing agent
- Built in 1872 — when were the roof, HVAC, electrical panel, plumbing, and water heater last replaced?
- Is there a deadline driving the sale (1031 exchange, divorce, estate, relocation)? That informs how much negotiation room exists.
- Schools are D-rated, which usually means shorter tenancies and higher turnover. Who's the typical renter profile here, and what's been the actual vacancy rate?
- What's the average days-on-market for RENTAL listings here right now (not sales)? A rising rental-DOM trend means longer vacancies and softer asking-rent achievability than the comps imply.
- What's the recent tenant-quality profile in this submarket — average credit score on applications, eviction rate, late-payment / NSF rate, and stable-employment percentage? A property-management company in the area should have these aggregated.
- How much new for-sale + rental construction is in the pipeline within 1–3 miles? Heavy new supply typically softens prices + rents 12–24 months out; constrained supply supports both.
Investment metrics
- 1% rule
- 1.84% ✓
- Cap rate
- 15.44%
- Cash-on-cash
- 32.65%
- DSCR
- 2.45
- GRM
- 4.5
CMA / ARV
- ARV (on-the-fly)
- $639,068
- Comps found
- 12
Show comp detail 12 sales within ~0.75 mi
| Address | Dist | Beds/Ba | Sqft | Sold | Price | $/sf | Match |
|---|---|---|---|---|---|---|---|
| 8 Eldridge Ave | 0.20mi | 3/1.5 | 1,610 (-1%) | 4mo | $625,000 | $388 | 86 |
| 4 Spaulding Pl | 0.27mi | 3/1.5 | 1,636 (+1%) | 0mo | $700,500 | $428 | 86 |
| 5 Sabrina Ln | 0.36mi | 3/2.0 | 1,646 (+2%) | 5mo | $645,000 | $392 | 75 |
| 59 Watson Ave | 0.30mi | 3/2.0 | 1,730 (+7%) | 1mo | $649,222 | $375 | 72 |
| 11 Sutton Pl | 0.20mi | 3/1.5 | 1,444 (-11%) | 5mo | $715,000 | $495 | 68 |
| 16 Forest Ave | 0.33mi | 4/2.0 (+1) | 1,488 (-8%) | 7mo | $577,700 | $388 | 58 |
| 61 Snowden Ave | 0.67mi | 3/1.0 | 1,516 (-6%) | 5mo | $515,000 | $340 | 52 |
| 19 First Ave | 0.65mi | 3/1.0 | 1,512 (-7%) | 7mo | $596,370 | $394 | 50 |
| 73 Van Cortlandt Ave | 0.61mi | 3/2.0 | 1,482 (-9%) | 7mo | $610,000 | $412 | 49 |
| 10 Pine Brook Rd | 0.56mi | 3/3.0 | 1,824 (+12%) | 1mo | $810,000 | $444 | 46 |
| 48 Pershing Ave | 0.65mi | 4/2.0 (+1) | 1,463 (-10%) | 2mo | $675,000 | $461 | 45 |
| 50 Snowden Ave | 0.67mi | 2/2.5 (-1) | 1,444 (-11%) | 7mo | $530,000 | $367 | 36 |
Match score weights: distance 35% · size 25% · config 20% · recency 20%. Top-matched comps best support the ARV.
Projected returns pro-forma
-3.0% appreciation · 3.0% rent growth · sell at horizon
- IRR
- 27.8%
- Equity multiple
- 2.16×
- Total profit
- $64,700
- Equity at exit
- $29,821
- IRR
- 35.3%
- Equity multiple
- 4.24×
- Total profit
- $181,536
- Equity at exit
- $17,292
Cash invested: $56,000 (down + closing). Projections, not guarantees.
Landlord ↔ Tenant lean methodology
- Overall (STATE)
- 15 Strongly Tenant-Friendly
- State New York
- 15 Strongly Tenant-Friendly · D+10
- County
- — inherits STATE
- City
- — inherits STATE
ZIP-level market 10562
- Active inventory
- 134
- Price-to-rent
- 4.5×
Monthly cashflow live
- Estimated rent
- $3,678 high interval (Pro) →
- Mortgage (P&I)
- −$1,049
- Tax est. 1.5%
- −$250 /mo · $3,000/yr
- Insurance
- −$83
- HOA
- −$0
- Vacancy / Maint / Mgmt
- −$772
- Net cashflow
- $1,524
Break-even live
UW: 25.0% down · 7.5% · 30yr · 1.5% tax · 5.0% vac · 8.0% maint · 8.0% mgmt
Financing live
Cash to close
- Down payment
- $50,000
- Closing costs
- $6,000
- Reserves months
- —
- Total cash needed
- —
Loan-product check · same deal, 3 products live
Conventional
25% down · 7.5% · 30yr
- Down + closing
- —
- Monthly P&I
- —
- Monthly cashflow
- —
- DSCR
- —
- Eligible?
- —
Personal DTI + credit; lowest rate.
DSCR
20% down · 8.5% · 30yr
- Down + closing
- —
- Monthly P&I
- —
- Monthly cashflow
- —
- DSCR
- —
- Eligible?
- —
No personal income docs; deal must DSCR.
Hard money
10% down · 12.0% · 12mo
- Down + closing
- —
- Monthly P&I
- —
- Monthly cashflow
- —
- DSCR
- —
- Eligible?
- —
Short-term bridge; refi at stabilization.
Rent comps 8 comps
| Address | Beds | Baths | Sqft | Rent | $/sqft | DOM | Units | Dist |
|---|---|---|---|---|---|---|---|---|
| 48 Ferris Pl Ossining, NY | 3.0 | 1.0 | 1080 | $3,000 | $2.78 | 18d | 1 | 0.19mi |
| 5 Brandreth St Unit 2A Ossining, NY | 3.0 | 2.0 | 1150 | $3,900 | $3.39 | 4d | 1 | 0.66mi |
| 51 Iroquois Rd Ossining, NY | 4.0 | 2.0 | 1703 | $4,950 | $2.91 | 24d | 1 | 0.67mi |
| 42 Cedar Ln Ossining, NY | 1.0–2.0 | 1.0–1.5 | 975 | $2,995 | $3.07 | 1d | 1 | 0.70mi |
| 217 N Highland Ave Ossining, NY | 1.0–3.0 | 1.0–2.0 | 1075 | $4,687 | $4.36 | 1d | 4 | 0.90mi |
| 90 S Highland Ave Unit 6 Ossining, NY | 2.0 | 1.5 | 1092 | $3,500 | $3.21 | 5d | 1 | 0.92mi |
| 76 State St Unit 10 Ossining, NY | 3.0 | 1.0 | 1100 | $2,750 | $2.50 | 43d | 1 | 1.08mi |
| 1 Harbor Sq Ossining, NY | 1.0–2.0 | 1.0–2.5 | 894 | $5,795 | $6.48 | 1d | 8 | 1.09mi |
Listing history 2 events
-
2026-06-17remarks 34-char remark
-
2026-06-17$200,000 Coming Soon 1 DOM
ⓘ Source: listings_history table (triggers on properties + properties_extension) + one-shot
backfill from property_details.listing_events for pre-trigger history.
Climate risk First Street
- Flood 1/10 Low FEMA zone X (unshaded) · 0% chance over 30 yrs
- Wildfire 3/10 Moderate
- Heat 5/10 Major 7 d/yr ≥100°F today · 15 d/yr by 30 yrs out
- Wind 4/10 Moderate 24% chance of damaging wind over 30 yrs
- Air quality 3/10 Moderate 3 unhealthy d/yr today · 4 by 30 yrs out
Nearby sold comps map
Loading sold comps map…
Walkable amenities ~0.75 mi
Loading nearby amenities…
Taxation est. · year 1
- Rental income
- $44,141
- − Mortgage interest
- −$11,203
- − Property taxes
- −$3,000
- − Insurance
- −$1,000
- − Repairs & maintenance
- −$3,531
- − Management
- −$3,531
- − Depreciation
- −$5,818
- Taxable income
- $16,057
- Est. tax owed @ 24.0%
- −$3,854
- After-tax cash flow
- $14,432/yr
For passive investors: Depreciation is non-cash, so a rental often shows a tax loss while cash-flowing — sheltering income. Rental losses are passive: they offset passive income freely, and up to $25,000/yr can offset ordinary (W-2) income if you actively participate and your MAGI is under $100k (phasing out to $0 by $150k); unused losses carry forward. On sale, claimed depreciation is recaptured at up to 25%, and gains may owe capital-gains tax (a 1031 exchange can defer both). Figures are a year-1 estimate at your 24.0% rate — not tax advice; consult a CPA.
Schools (NCES district)
- District
- Ossining Union Free School District
- NCES district ID
- 3622020
- Math proficiency
- 72% ▲ 27.00%
- Reading proficiency
- 72% ▲ 25.00%
- Median HH income
- $78,402
- Composite
- 63.75/100
- National rank
- #599
- State rank
- #104 of 590 in NY
Livability — Ossining
- Score
- 80/100
- State rank
- #116
- US rank
- #1876
Category grades
Schools grade is shown separately in the Schools card above.
Census & demographics
- Census place
- Ossining, NY
- County
- Westchester County · 709,332 people
- City population
- 33,793
- Metro
- New York-Newark-Jersey City, NY-NJ-PA
- Population (ZIP)
- 33,793
- Household income
- $115,697
- Rent vs Own
- Severe rent burden
- 1248.0
Population outlook (Westchester County) Hauer SSP2
- Today (2025)
- 1,028,035 people
- By 2030
- 1,051,636 · +2.3%
- By 2040
- 1,098,520 · +6.9%
- By 2050
- 1,136,044 · +10.5%
- By 2075
- 1,196,925 · +16.4%
- By 2100
- 1,175,147 · +14.3%
Race, ethnicity, and origin ACS 2023
- Neighborhood character
- Diverse neighborhood (Simpson 0.63)
- Race & ethnicity
- White 47% Hispanic / Latino 37% Two or more races 11% Black 8% Asian 4%
- Hispanic origin (detail)
- Puerto Rican 6% Cuban 2% Dominican 3%
- Common ancestry
- Romanian 3% Scotch-Irish 3% Italian 2%
- Foreign-born
- 28% · Canada, Jamaica, China
- Languages at home
- 59% English-only · Spanish 31% Other Indo-European 4% Russian/Polish/Slavic 1%
Political lean MEDSL · Westchester
- 2024 margin
- Strong D (+26.3) · D 63.1% · R 36.9%
- 2008→2024 swing
- -1.3pp toward R · 2008: 27.6pp · 2024: 26.3pp
- All cycles
- 2024: D+26.3 2020: D+36.3 2016: D+32.8 2012: D+22.2 2008: D+27.6
Not yet ingested
- Civics
- —
Market trends
- HPI YoY
- ▼ -605.12%
- Current HPI
- 251.6831
- Rent YoY
- —
- Metro
- New York-Newark-Jersey City, NY-NJ-PA
- State GDP YoY
- ▲ 2.60%
- F500 in state
- 92
Industry mix (Fortune 500 HQ in NY)
| Industry | F500 HQs | Revenue |
|---|---|---|
| Financial Services | 10 | $950B |
|
||
| Consumer Goods | 9 | $162B |
|
||
| Insurance | 4 | $225B |
|
||
| Telecommunications | 2 | $144B |
|
||
| Pharmaceuticals | 2 | $112B |
|
||
| Media / Entertainment | 2 | $69B |
|
||
Price history
-31.0% since first listed38 events — show timeline
- 2026-06-17 Coming Soon $200,000 OneKey® MLS as Distributed by MLS Grid
- 2024-12-30 Listing Removed — OneKey® MLS as Distributed by MLS Grid
- 2024-10-01 Relisted — OneKey® MLS as Distributed by MLS Grid
- 2024-09-29 Listing Removed — OneKey® MLS as Distributed by MLS Grid
- 2024-08-15 Relisted — OneKey® MLS as Distributed by MLS Grid
- 2024-08-01 Relisted — OneKey® MLS as Distributed by MLS Grid
- 2024-05-19 Pending — OneKey® MLS as Distributed by MLS Grid
- 2024-02-23 Price Changed $425,000 OneKey® MLS as Distributed by MLS Grid
- 2023-12-29 Listed $450,000 OneKey® MLS as Distributed by MLS Grid
- 2021-01-11 Sold (Public Records) $377,000 Public Records
- 2020-12-31 Sold (MLS) $377,000 OneKey® MLS as Distributed by MLS Grid
- 2020-07-02 Price Changed $375,000 OneKey® MLS as Distributed by MLS Grid
- 2020-03-10 Listed $400,000 OneKey® MLS as Distributed by MLS Grid
- 2019-12-16 Listing Removed — OneKey® MLS as Distributed by MLS Grid
- 2019-07-26 Listed $425,000 OneKey® MLS as Distributed by MLS Grid
- 2018-12-29 Sold (MLS) $110,000 OneKey® MLS as Distributed by MLS Grid
- 2018-12-21 Pending — OneKey® MLS as Distributed by MLS Grid
- 2018-12-10 Relisted — OneKey® MLS as Distributed by MLS Grid
- 2018-11-21 Pending — OneKey® MLS as Distributed by MLS Grid
- 2018-10-24 Price Changed $149,900 OneKey® MLS as Distributed by MLS Grid
- 2018-09-10 Price Changed $164,900 OneKey® MLS as Distributed by MLS Grid
- 2018-07-20 Listed $174,900 OneKey® MLS as Distributed by MLS Grid
- 2018-06-25 Sold (Public Records) $434,452 Public Records
- 2013-01-15 Delisted — HGMLS
- 2013-01-15 Listing Removed — OneKey® MLS as Distributed by MLS Grid
- 2012-12-10 Price Changed — HGMLS
- 2012-11-09 Price Changed — HGMLS
- 2012-11-07 Price Changed — HGMLS
- 2012-10-05 Price Changed — HGMLS
- 2012-09-07 Price Changed — HGMLS
- 2012-08-06 Price Changed — HGMLS
- 2012-07-11 Listed — HGMLS
- 2012-07-11 Listed $84,900 OneKey® MLS as Distributed by MLS Grid
- 2006-07-25 Sold (Public Records) $298,700 Public Records
- 2006-05-03 Sold (MLS) $290,000 HGMLS
- 2006-02-23 Delisted — HGMLS
- 2006-02-23 Price Changed $309,999 HGMLS
- 2005-08-29 Listed $290,000 HGMLS
Property tax history
+12.0%/yrLatest (2025): $15,685 · +2.2% YoY. Source: county tax records.
Cash-flow waterfall
monthlySold comps — $/sqft
last 12 mo · ≤1 miLoading sold comps…