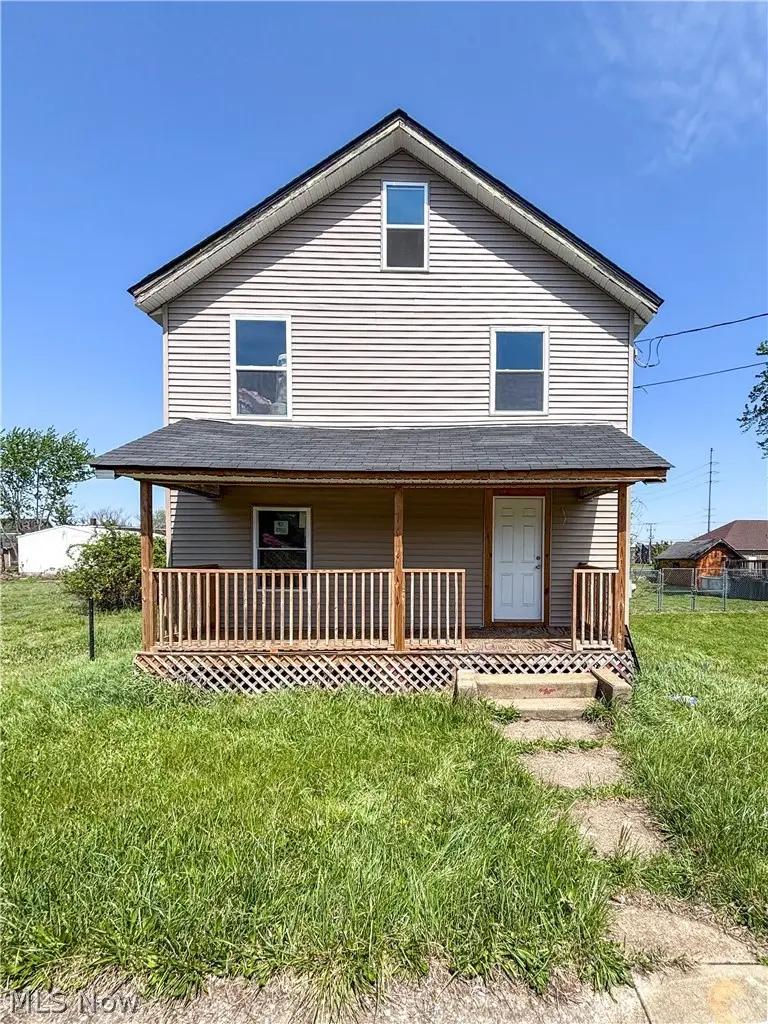
1837 Penn Pl NE · Canton, OH
Flood risk 6/10 · Moderate
- FEMA flood zone
- X (shaded)
- Chance of flooding over 30 yrs
- 0.71%
- Est. flood insurance / yr
- $473 – $860
Fire risk 1/10 · Minimal
- Est. fire insurance / yr
- $713 – $1,323
Heat risk 3/10 · Minor
- Hot days now (above 96°F)
- 7 days/yr
- Hot days in 30 yrs
- 17 days/yr
Wind risk 1/10 · Minimal
- Chance of severe wind over 30 yrs
- —
Air-quality risk 2/10 · Minimal
- Unhealthy air days now
- 0 days/yr
- Unhealthy air days in 30 yrs
- 1 days/yr
Risk factors via First Street. Map © Google.
Why this score? — see what drove the A- grade
The composite is a weighted blend of 9 inputs, each scored 0–100. Each bar is that input's sub-score; the figure is the points it added to the 100-point composite (weight × sub-score).
- Cash flow +30.0/30.0
- ARV discount +15.0/15.0
- 1% rule +10.0/10.0
- DSCR +10.0/10.0
- Appreciation +8.1/10.0
- Livability +3.6/5.0
- Rent growth +2.5/5.0
- Condition / age +2.5/5.0
- Schools +1.7/10.0
$39,000
🖨 Deal sheet 📄 Offer letter ✓ Due diligence
Listing remarks
Investor special with major improvements already completed! This opportunity features new siding, new windows, new front and back deck, new hot water tank, updated plumbing, and updated electric—saving valuable time and upfront renovation costs. The interior offers a blank canvas for your vision and endless possibilities to design the layout and finishes exactly how you choose. There is also an attic that can serve as an additional bedroom, office, etc. Perfect for investors, flippers, or builders looking to create value and maximize returns. Bring your creativity and turn this property into something exceptional. * NO WHOLESALERS OR SELLER FINANCING PLEASE *
Key facts
- New siding
- New hot water tank
- Updated electric
Tags
Property features AI
Exterior
- Parking: Driveway
- Utilities: Public water; Public sewer
- Home design: Two-story home; Fixer condition
- Construction: Built in public-records year; Aluminum siding; Shingle roof; Concrete foundation
- Exterior features: Driveway
Interior
- Bathrooms: 1 full bathroom
- Heating & cooling: Electric heating
- Interior features: Concrete basement
Neighborhood map
What this means for you Summary
Snapshot
- This is a 3-bed/1.0-bath single-family listed at $39k.
Deal economics
- At list price, monthly cash flow is $529 ($6k/yr) — positive.
- The deal already cash-flows at list — no discount required.
- Meets the 1% rule at list price ($1k rent vs $39k).
- Recommended offer: $38k (3.0% below list) — sets the bar for market timing.
- Cap rate 22.6% vs local median 5.1% in Canton — top-decile yield for the area; either an underpriced asset or a hidden risk that comps aren't pricing in. Stress-test before assuming the spread holds.
Location & tenants
- Location reads 71/100 on livability (#441 in OH) — a middle-class / working-renter tenant base. Strengths: commute A+, cost of living A+, housing A; Watch: crime F, employment F.
- Canton City (urban): math 17% / reading 26% proficiency, ranked #627 of 656 in OH (top 96%) — low school quality limits family demand, transient renter base, plan for 1-2y turnover; 76% free/reduced lunch — lower-income household profile, screen leases tightly.
- Market conditions: 20 active listings in the ZIP; 17 comparable units currently listed for rent nearby; rentals leasing fast (median 14d on market — plan ~1-2 weeks tenant-placement turnaround); lower-income renter base — watch delinquency; 528 units permitted in Stark County in 2024 (84 in 5+ unit buildings).
- This rent runs 37% of the median local income ($34k/yr) — at the standard rent-burdened threshold; future hikes will face affordability resistance.
Forward outlook
- In year one you build about $3k of equity ($270 loan paydown + $2k appreciation (6.2% local appreciation)).
- Stark County population projected to shrink 8% by 2050 — rents likely to lag national; underwrite the cash flow, not the appreciation.
- At projected returns (6.2% appreciation + 3.0% rent growth), your $11k cash investment doubles in ~2 years — after that, you're playing with house money.
Negotiation context
- It's been on market 56 days — a 3% lower offer ($38k) is reasonable based on typical stale-listing flexibility.
- 5 sale attempts since 19y ago; this cycle's ask has dropped $10k (20%) from the opening price — seller is motivated, your offer sets the floor, not the list.
Risks & watch-outs
- Watch-outs: built in 1908 — expect roof / HVAC / electrical / plumbing capex.
- Climate carrying-cost: major flood risk — expect insurance premiums to compound above CPI over the hold.
Questions for the listing agent
- It's been on market 56 days. Have you received any prior offers? Is the seller open to a 3% concession, seller financing, or rate buy-down credit?
- Built in 1908 — when were the roof, HVAC, electrical panel, plumbing, and water heater last replaced?
- Is there a deadline driving the sale (1031 exchange, divorce, estate, relocation)? That informs how much negotiation room exists.
- Crime grade is F in this area — have there been break-ins, vandalism, or insurance claims at this property in the last 3 years? What carrier currently insures it and at what premium?
- What's the average days-on-market for RENTAL listings here right now (not sales)? A rising rental-DOM trend means longer vacancies and softer asking-rent achievability than the comps imply.
- What's the recent tenant-quality profile in this submarket — average credit score on applications, eviction rate, late-payment / NSF rate, and stable-employment percentage? A property-management company in the area should have these aggregated.
- How much new for-sale + rental construction is in the pipeline within 1–3 miles? Heavy new supply typically softens prices + rents 12–24 months out; constrained supply supports both.
Investment metrics
- 1% rule
- 2.67% ✓
- Cap rate
- 22.56%
- Cash-on-cash
- 58.10%
- DSCR
- 3.59
- GRM
- 3.1
CMA / ARV
- ARV (median comp)
- $65,080
- List price
- $39,000
- Delta
- -40.07%
- Verdict
- UNDERPRICED
- Comps
- 20 within 1.0 mi
Show comp detail 12 sales within ~0.75 mi
| Address | Dist | Beds/Ba | Sqft | Sold | Price | $/sf | Match |
|---|---|---|---|---|---|---|---|
| 1817 Penn Pl NE | 0.04mi | 3/1.0 | 1,389 (+3%) | 10mo | $59,900 | $43 | 84 |
| 515 Flamos Cir NE | 0.17mi | 3/1.5 | 1,300 (-3%) | 2mo | $119,000 | $92 | 83 |
| 2002 Penn Pl NE | 0.13mi | 2/1.0 (-1) | 1,164 (-13%) | 8mo | $40,000 | $34 | 60 |
| 2306 3rd St NE | 0.61mi | 3/2.0 | 1,319 (-2%) | 11mo | $129,900 | $98 | 55 |
| 2001 3rd St SE | 0.54mi | 3/1.0 | 1,456 (+8%) | 13mo | $126,000 | $87 | 50 |
| 213 Hartford Ave SE | 0.50mi | 4/1.5 (+1) | 1,462 (+9%) | 9mo | $145,000 | $99 | 48 |
| 425 Girard Ave NE | 0.41mi | 3/1.0 | 1,144 (-15%) | 12mo | $104,900 | $92 | 46 |
| 1316 4th St NE | 0.51mi | 2/1.0 (-1) | 1,152 (-14%) | 2mo | $58,000 | $50 | 46 |
| 913 Lawrence Rd NE | 0.73mi | 3/1.0 | 1,248 (-7%) | 12mo | $85,000 | $68 | 44 |
| 1935 5th St SE | 0.68mi | 3/2.0 | 1,442 (+7%) | 13mo | $52,777 | $37 | 42 |
| 1327 Maple Ave NE | 0.71mi | 3/1.0 | 1,156 (-14%) | 11mo | $55,000 | $48 | 35 |
| 1942 4th St SE | 0.65mi | 4/1.0 (+1) | 1,536 (+14%) | 13mo | $40,000 | $26 | 30 |
Match score weights: distance 35% · size 25% · config 20% · recency 20%. Top-matched comps best support the ARV.
Projected returns pro-forma
6.17% appreciation · 3.0% rent growth · sell at horizon
- IRR
- 66.4%
- Equity multiple
- 5.15×
- Total profit
- $45,358
- Equity at exit
- $24,934
- IRR
- 63.3%
- Equity multiple
- 10.80×
- Total profit
- $107,011
- Equity at exit
- $45,581
Cash invested: $10,920 (down + closing). Projections, not guarantees.
Landlord ↔ Tenant lean methodology
- Overall (STATE)
- 73 Landlord-Friendly
- State Ohio
- 73 Landlord-Friendly · R+6
- County
- — inherits STATE
- City
- — inherits STATE
ZIP-level market 44704
- Home prices YoY
- 7.2%
- Active inventory
- 20
- Price-to-rent
- 3.1×
Monthly cashflow live
- Estimated rent
- $1,041 high interval (Pro) →
- Mortgage (P&I)
- −$205
- Tax from tax record
- −$73 /mo · $877/yr
- Insurance
- −$16
- HOA
- −$0
- Vacancy / Maint / Mgmt
- −$219
- Net cashflow
- $529
Break-even live
UW: 25.0% down · 7.5% · 30yr · 1.5% tax · 5.0% vac · 8.0% maint · 8.0% mgmt
Financing live
Cash to close
- Down payment
- $9,750
- Closing costs
- $1,170
- Reserves months
- —
- Total cash needed
- —
Loan-product check · same deal, 3 products live
Conventional
25% down · 7.5% · 30yr
- Down + closing
- —
- Monthly P&I
- —
- Monthly cashflow
- —
- DSCR
- —
- Eligible?
- —
Personal DTI + credit; lowest rate.
DSCR
20% down · 8.5% · 30yr
- Down + closing
- —
- Monthly P&I
- —
- Monthly cashflow
- —
- DSCR
- —
- Eligible?
- —
No personal income docs; deal must DSCR.
Hard money
10% down · 12.0% · 12mo
- Down + closing
- —
- Monthly P&I
- —
- Monthly cashflow
- —
- DSCR
- —
- Eligible?
- —
Short-term bridge; refi at stabilization.
Rent comps 17 comps
| Address | Beds | Baths | Sqft | Rent | $/sqft | DOM | Units | Dist |
|---|---|---|---|---|---|---|---|---|
| 1906 6th St NE Unit 1906-002 Canton, OH | 3.0 | 1.0 | 906 | $1,000 | $1.10 | 13d | 1 | 0.16mi |
| 1946 Otto Pl NE Canton, OH | 3.0 | 1.0 | 1499 | $28,000 | $18.68 | 13d | 1 | 0.27mi |
| 1511 2nd St NE Canton, OH | 3.0 | 1.0 | 1129 | $1,250 | $1.11 | 43d | 1 | 0.43mi |
| 316 Young Ave NE Canton, OH | 4.0 | 1.0 | 1268 | $1,050 | $0.83 | 13d | 1 | 0.45mi |
| 2048 2nd St NE Unit 2048 Canton, OH | 2.0 | 1.0 | 1092 | $950 | $0.87 | 13d | 1 | 0.46mi |
| 1206 Lawrence Rd NE Apt 3 Canton, OH | 2.0 | 1.0 | 900 | $950 | $1.06 | 21d | 1 | 0.66mi |
| 924 Spring Ave NE Canton, OH | 4.0 | 1.5 | 1407 | $1,395 | $0.99 | 21d | 1 | 0.78mi |
| 1504 14th St SE Canton, OH | 3.0 | 1.0 | 924 | $1,120 | $1.21 | 13d | 1 | 1.09mi |
| 2213 17th St NE Canton, OH | 2.0 | 1.0 | 1132 | $1,100 | $0.97 | 44d | 1 | 1.15mi |
| 1220 Market Ave N Unit 4 Canton, OH | 3.0 | 1.0 | 1400 | $1,100 | $0.79 | 43d | 1 | 1.18mi |
| 1304 Cole Ave SE Canton, OH | 2.0 | 1.0 | 984 | $650 | $0.66 | 13d | 1 | 1.21mi |
| 1613 Spring Ave NE Canton, OH | 3.0 | 1.0 | 1320 | $1,095 | $0.83 | 21d | 1 | 1.26mi |
| 1629 Spring Ave NE Unit Na Canton, OH | 2.0 | 1.0 | 1100 | $836 | $0.76 | 21d | 1 | 1.29mi |
| 1000 Market Ave S Canton, OH | 1.0–2.0 | 1.0–2.0 | 1500 | $4,505 | $3.00 | 13d | 12 | 1.39mi |
| 2018 Maple Ave NE Canton, OH | 2.0 | 1.0 | 1206 | $950 | $0.79 | 13d | 1 | 1.39mi |
| 1307 Woodland Ave NW Unit 2 Canton, OH | 2.0 | 1.0 | 973 | $675 | $0.69 | 43d | 1 | 1.44mi |
| 123 17th St NW Canton, OH | 2.0 | 1.0–1.5 | 766 | $1,050 | $1.37 | 13d | 1 | 1.47mi |
Listing history 25 events
-
2026-06-18days on market $39,000 Active 56 DOM
-
2026-06-17days on market $39,000 Active 55 DOM
-
2026-06-16days on market $39,000 Active 54 DOM
-
2026-06-15days on market $39,000 Active 53 DOM
-
2026-06-14days on market $39,000 Active 51 DOM
-
2026-06-13days on market $39,000 Active 50 DOM
-
2026-06-10days on market $39,000 Active 48 DOM
-
2026-06-09days on market $39,000 Active 47 DOM
-
2026-06-08days on market $39,000 Active 46 DOM
-
2026-06-07days on market $39,000 Active 45 DOM
-
2026-06-05days on market $39,000 Active 42 DOM
-
2026-06-03days on market $39,000 Active 41 DOM
-
2026-06-02days on market $39,000 Active 40 DOM
-
2026-06-01days on market $39,000 Active 39 DOM
-
2026-05-31days on market $39,000 Active 38 DOM
-
2026-05-30days on market $39,000 Active 37 DOM
-
2026-04-23$49,000 Active 673-char remark
-
2020-09-23historical
-
2020-07-03status Active
-
2020-06-29status Pending
-
2020-06-12$10,000 Active
-
2008-05-14historical
-
2008-04-02historical
-
2007-12-08$18,900
-
2007-10-02$18,900
ⓘ Source: listings_history table (triggers on properties + properties_extension) + one-shot
backfill from property_details.listing_events for pre-trigger history.
Tax reassessment forecast OH · Partial reset (capped growth)
- Current annual tax
- $877 · $73/mo
- Projected year-2 tax
- $877 · $73/mo
- Expected delta
- $0/yr ($0/mo · 0.0%)
ⓘ Screening estimate from a state-policy table — verify with the county assessor before closing.
Climate risk First Street
- Flood 6/10 Major FEMA zone X (shaded) · 71% chance over 30 yrs
- Wildfire 1/10 Low
- Heat 3/10 Moderate 7 d/yr ≥96°F today · 17 d/yr by 30 yrs out
- Wind 1/10 Low
- Air quality 2/10 Low 0 unhealthy d/yr today · 1 by 30 yrs out
Nearby sold comps map
Loading sold comps map…
Walkable amenities ~0.75 mi
Loading nearby amenities…
Taxation est. · year 1
- Rental income
- $12,495
- − Mortgage interest
- −$2,185
- − Property taxes
- −$877
- − Insurance
- −$195
- − Repairs & maintenance
- −$1,000
- − Management
- −$1,000
- − Depreciation
- −$1,135
- Taxable income
- $6,105
- Est. tax owed @ 24.0%
- −$1,465
- After-tax cash flow
- $4,880/yr
For passive investors: Depreciation is non-cash, so a rental often shows a tax loss while cash-flowing — sheltering income. Rental losses are passive: they offset passive income freely, and up to $25,000/yr can offset ordinary (W-2) income if you actively participate and your MAGI is under $100k (phasing out to $0 by $150k); unused losses carry forward. On sale, claimed depreciation is recaptured at up to 25%, and gains may owe capital-gains tax (a 1031 exchange can defer both). Figures are a year-1 estimate at your 24.0% rate — not tax advice; consult a CPA.
Schools (NCES district)
- District
- Canton City
- NCES district ID
- 3904371
- Math proficiency
- 17% ▼ -17.00%
- Reading proficiency
- 26% ▼ -12.00%
- Median HH income
- $28,825
- Composite
- 17.1/100
- National rank
- #9116
- State rank
- #627 of 656 in OH
Livability — Canton
- Score
- 71/100
- State rank
- #441
- US rank
- #7259
Category grades
Schools grade is shown separately in the Schools card above.
Census & demographics
- Census place
- Canton, OH
- County
- Stark · 366,688 people
- City population
- 103,614
- Metro
- Canton-Massillon, OH
- Population (ZIP)
- 3,583
- Household income
- $34,063
- Rent vs Own
- Severe rent burden
- 10.1
Population outlook (Stark County) Hauer SSP2
- Today (2025)
- 373,708 people
- By 2030
- 371,245 · -0.7%
- By 2040
- 361,331 · -3.3%
- By 2050
- 345,290 · -7.6%
- By 2075
- 302,669 · -19.0%
- By 2100
- 238,870 · -36.1%
Race, ethnicity, and origin ACS 2023
- Neighborhood character
- Diverse neighborhood (Simpson 0.56)
- Race & ethnicity
- Black 58% White 33% Two or more races 7% Hispanic / Latino 2%
- Common ancestry
- Hispanic 3% Romanian 1% Polish 1%
Political lean MEDSL · Stark
- 2024 margin
- Strong R (+21.9) · D 38.6% · R 60.5%
- 2008→2024 swing
- -27.4pp toward R · 2008: 5.5pp · 2024: -21.9pp
- All cycles
- 2024: R+21.9 2020: R+18.5 2016: R+17.4 2012: R+0.4 2008: D+5.5
Not yet ingested
- Civics
- —
Market trends
- HPI YoY
- ▲ 6.17%
- Current HPI
- 91.3426
- Rent YoY
- —
- Metro
- —
- State GDP YoY
- ▲ 1.98%
- F500 in state
- 48
Industry mix (Fortune 500 HQ in OH)
| Industry | F500 HQs | Revenue |
|---|---|---|
| Insurance | 3 | $145B |
|
||
| Industrial Machinery | 3 | $49B |
|
||
| Financial Services | 3 | $24B |
|
||
| Consumer Goods | 2 | $93B |
|
||
| Aerospace / Defense | 2 | $47B |
|
||
| Utilities | 2 | $33B |
|
||
Price history
+106.3% since first listed10 events — show timeline
- 2026-05-28 Price Changed $39,000 MLSNOW
- 2026-04-23 Listed $49,000 MLSNOW
- 2020-09-23 Listing Removed — MLSNOW
- 2020-07-03 Relisted — MLSNOW
- 2020-06-29 Pending — MLSNOW
- 2020-06-12 Listed $10,000 MLSNOW
- 2008-05-14 Listing Removed — MLSNOW
- 2008-04-02 Listing Removed — MLSNOW
- 2007-12-08 Listed $18,900 MLSNOW
- 2007-10-02 Listed $18,900 MLSNOW
Property tax history
-3.5%/yrLatest (2024): $877 · +54.5% YoY. Source: county tax records.
Cash-flow waterfall
monthlySold comps — $/sqft
last 12 mo · ≤1 miLoading sold comps…