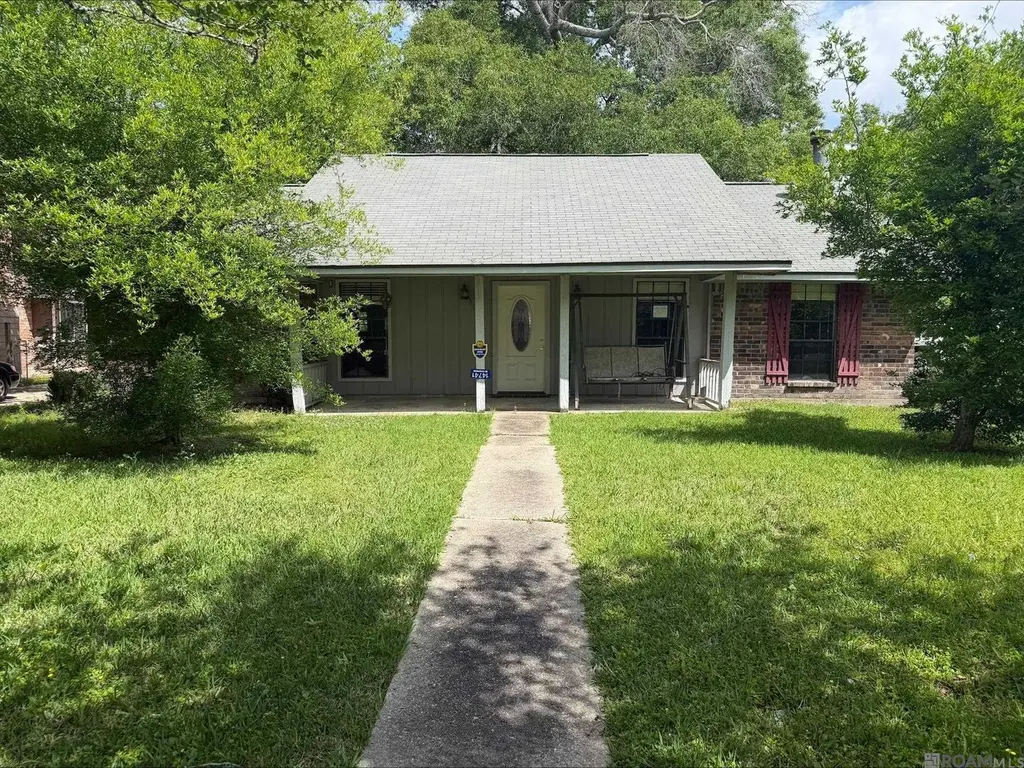
14741 Saddle Ave · Central, LA
Flood risk 6/10 · Moderate
- FEMA flood zone
- AE
- Chance of flooding over 30 yrs
- 0.71%
- Est. flood insurance / yr
- $1,737 – $8,500
Fire risk 1/10 · Minimal
- Est. fire insurance / yr
- $1,269 – $2,357
Heat risk 8/10 · Major
- Hot days now (above 108°F)
- 7 days/yr
- Hot days in 30 yrs
- 20 days/yr
Wind risk 9/10 · Severe
- Chance of severe wind over 30 yrs
- 99.0%
Air-quality risk 3/10 · Minor
- Unhealthy air days now
- 2 days/yr
- Unhealthy air days in 30 yrs
- 3 days/yr
Risk factors via First Street. Map © Google.
Why this score? — see what drove the B+ grade
The composite is a weighted blend of 9 inputs, each scored 0–100. Each bar is that input's sub-score; the figure is the points it added to the 100-point composite (weight × sub-score).
- Cash flow +30.0/30.0
- ARV discount +15.0/15.0
- DSCR +10.0/10.0
- 1% rule +9.7/10.0
- Schools +4.6/10.0
- Livability +3.7/5.0
- Rent growth +2.5/5.0
- Condition / age +2.5/5.0
- Appreciation +0.0/10.0
$150,000
🖨 Deal sheet (PDF) 📄 Offer letter ✓ Due diligence
Listing remarks MLS
Three bedrooms, two full bathrooms situated on a corner lot. The kitchen includes modern cabinets with granite countertops. Large living room with vaulted ceiling and a fireplace. Master en suite. Covered carport. Detached metal shed.
Key facts
- Modern cabinets
- Vaulted ceiling
- Master en suite
Tags
Neighborhood map
What this means for you Summary
Snapshot
- This is a 3-bed/2.0-bath single-family listed at $150k.
Deal economics
- At list price, monthly cash flow is $379 ($5k/yr) — positive.
- The deal already cash-flows at list — no discount required.
- Meets the 1% rule at list price ($2k rent vs $150k).
- Recommended offer: $148k (1.5% below list) — sets the bar for market timing.
- Cap rate 12.7% vs local median 3.2% in Central — top-decile yield for the area; either an underpriced asset or a hidden risk that comps aren't pricing in. Stress-test before assuming the spread holds.
Location & tenants
- Location reads 74/100 on livability (#25 in LA, #4,761 nationally) — a middle-class / working-renter tenant base. Strengths: employment A+, housing A+, crime B; Watch: amenities F, commute F.
- Central Community School District (suburban): math 50% / reading 54% proficiency, ranked #9 of 98 in LA (top 9%) — acceptable for families but not a draw, mixed tenant base, ~2y average lease.
- Zoned schools: Central Middle School (math 48% / reading 46%, grade D+, #37 of 218 statewide, top 18%, 1,163 students, 53% FRL); Central High School (math 45% / reading 53%, grade D, #40 of 265 statewide, top 15%, 1,587 students, 47% FRL).
- Market conditions: 129 active listings in the ZIP; 2 comparable units currently listed for rent nearby; solid renter incomes; 2,252 units permitted in East Baton Rouge Parish in 2024 (440 in 5+ unit buildings).
- This rent runs 34% of the median local income ($78k/yr) — at the standard rent-burdened threshold; future hikes will face affordability resistance.
Forward outlook
- Local home prices are declining (-3.0%/yr); year-one equity from $1k of loan paydown is wiped out by about $4k of value loss. Plan a longer hold.
- East Baton Rouge County population projected at +4% by 2050 — modest demand growth; plan on rents tracking national, not racing it.
- At projected returns (-3.0% appreciation + 3.0% rent growth), your $42k cash investment doubles in ~10 years — after that, you're playing with house money.
Negotiation context
- It's been on market 23 days — a 2% lower offer ($148k) is reasonable based on typical stale-listing flexibility.
- 2 sale attempts with the ask held roughly flat each time — persistent listings suggest the price (not the market) is what's stuck; bring a comps-based counter.
Risks & watch-outs
- Watch-outs: flood insurance adds $427/mo.
- Climate carrying-cost: in FEMA flood zone AE (mandatory federal flood insurance); severe wind risk, 99% chance of damaging wind over 30y; extreme-heat days projected 7→20/yr by 2055 (HVAC capex compounding) — expect insurance premiums to compound above CPI over the hold.
Questions for the listing agent
- Built in 1978 — when were the roof, HVAC, electrical panel, plumbing, and water heater last replaced?
- What's the actual annual flood-insurance premium (NFIP or private), and is the property in a SFHA with mandatory coverage?
- Is there a deadline driving the sale (1031 exchange, divorce, estate, relocation)? That informs how much negotiation room exists.
- Schools are A-rated — typically a magnet for longer-tenancy family renters. What's the average tenant stay here, and is there a school-zone premium baked into asking?
- What's the average days-on-market for RENTAL listings here right now (not sales)? A rising rental-DOM trend means longer vacancies and softer asking-rent achievability than the comps imply.
- What's the recent tenant-quality profile in this submarket — average credit score on applications, eviction rate, late-payment / NSF rate, and stable-employment percentage? A property-management company in the area should have these aggregated.
- How much new for-sale + rental construction is in the pipeline within 1–3 miles? Heavy new supply typically softens prices + rents 12–24 months out; constrained supply supports both.
Investment metrics
- 1% rule
- 1.47% ✓
- Cap rate
- 12.74%
- Cash-on-cash
- 23.02%
- DSCR
- 2.02
- GRM
- 5.7
CMA / ARV
- ARV (median comp)
- $229,287
- List price
- $150,000
- Delta
- -34.58%
- Verdict
- UNDERPRICED
- Comps
- 20 within 1.0 mi
Show comp detail 12 sales within ~0.75 mi
| Address | Dist | Beds/Ba | Sqft | Sold | Price | $/sf | Match |
|---|---|---|---|---|---|---|---|
| 14741 Saddle Ave | 0.00mi | 3/2.0 | 1,500 (0%) | 1mo | $150,000 | $100 | 100 |
| 11926 Sage Dr | 0.09mi | 3/2.0 | 1,500 (0%) | 10mo | $209,900 | $140 | 87 |
| 11915 Sage Dr | 0.08mi | 3/2.0 | 1,530 (+2%) | 10mo | $243,000 | $159 | 85 |
| 11946 Sage Dr | 0.07mi | 3/2.0 | 1,637 (+9%) | 9mo | $204,000 | $125 | 74 |
| 13921 Ouachita Ave | 0.56mi | 3/2.0 | 1,472 (-2%) | 10mo | $199,500 | $136 | 62 |
| 13614 Calcasieu Ave | 0.67mi | 3/2.0 | 1,528 (+2%) | 5mo | $250,000 | $164 | 62 |
| 13951 Reed Ave | 0.52mi | 3/2.0 | 1,582 (+6%) | 7mo | $230,000 | $145 | 61 |
| 13808 Tech Dr | 0.58mi | 3/2.0 | 1,492 (-0%) | 16mo | $230,000 | $154 | 59 |
| 13623 Red River Ave | 0.71mi | 3/2.0 | 1,560 (+4%) | 10mo | $225,000 | $144 | 52 |
| 11729 Dame Dr | 0.68mi | 3/2.0 | 1,469 (-2%) | 23mo | $220,000 | $150 | 46 |
| 13820 Ouachita Ave | 0.61mi | 3/2.0 | 1,692 (+13%) | 18mo | $225,000 | $133 | 35 |
| 13717 Ouachita Ave | 0.68mi | 3/2.0 | 1,658 (+10%) | 20mo | $227,500 | $137 | 34 |
Match score weights: distance 35% · size 25% · config 20% · recency 20%. Top-matched comps best support the ARV.
Projected returns pro-forma
-3.0% appreciation · 3.0% rent growth · sell at horizon
- IRR
- 0.0%
- Equity multiple
- 1.00×
- Total profit
- $67
- Equity at exit
- $22,365
- IRR
- 9.8%
- Equity multiple
- 1.76×
- Total profit
- $32,083
- Equity at exit
- $12,969
Cash invested: $42,000 (down + closing). Projections, not guarantees.
Landlord ↔ Tenant lean methodology
- Overall (STATE)
- 90 Strongly Landlord-Friendly
- State Louisiana
- 90 Strongly Landlord-Friendly · R+12
- County
- — inherits STATE
- City
- — inherits STATE
ZIP-level market 70818
- Active inventory
- 129
- Price-to-rent
- 5.7×
Monthly cashflow live
- Estimated rent
- $2,199 medium interval (Pro) →
- Mortgage (P&I)
- −$787
- Tax from tax record
- −$83 /mo · $991/yr
- Insurance
- −$62
- Flood insurance flood zone
- −$427 /mo · $5,118/yr
- HOA
- −$0
- Lot rent
- −$0
- Vacancy / Maint / Mgmt
- −$462
- Net cashflow
- $379
Break-even live
Sensitivity live
| Price | -10% $464 | -5% $422 | +0% $379 | +5% $337 | +10% $294 |
|---|---|---|---|---|---|
| Rent | -10% $205 | -5% $292 | +0% $379 | +5% $466 | +10% $553 |
| Rate | -1.0pp $455 | -0.5pp $417 | base $379 | +0.5pp $340 | +1.0pp $301 |
UW: 25.0% down · 7.5% · 30yr · 1.5% tax · 5.0% vac · 8.0% maint · 8.0% mgmt
Financing live
Cash to close
- Down payment
- $37,500
- Closing costs
- $4,500
- Reserves months
- —
- Total cash needed
- —
Loan-product check · same deal, 3 products live
Conventional
25% down · 7.5% · 30yr
- Down + closing
- —
- Monthly P&I
- —
- Monthly cashflow
- —
- DSCR
- —
- Eligible?
- —
Personal DTI + credit; lowest rate.
DSCR
20% down · 8.5% · 30yr
- Down + closing
- —
- Monthly P&I
- —
- Monthly cashflow
- —
- DSCR
- —
- Eligible?
- —
No personal income docs; deal must DSCR.
Hard money
10% down · 12.0% · 12mo
- Down + closing
- —
- Monthly P&I
- —
- Monthly cashflow
- —
- DSCR
- —
- Eligible?
- —
Short-term bridge; refi at stabilization.
Rent comps 2 comps
| Address | Beds | Baths | Sqft | Rent | $/sqft | DOM | Units | Dist |
|---|---|---|---|---|---|---|---|---|
| 15013 Forest Grove Ave Baton Rouge, LA | 2.0 | 1.5 | 2000 | $860 | $0.43 | 46d | 1 | 0.90mi |
| 14150 Grand Settlement Blvd Baton Rouge, LA | 1.0–3.0 | 1.0–2.0 | 1073 | $2,544 | $2.37 | 16d | 14 | 1.29mi |
Listing history 5 events
-
2026-05-07status Pending 234-char remark
Show marketing remark (234 chars)
Three bedrooms, two full bathrooms situated on a corner lot. The kitchen includes modern cabinets with granite countertops. Large living room with vaulted ceiling and a fireplace. Master en suite. Covered carport. Detached metal shed.
-
2026-04-13$150,000 Active 234-char remark
Show marketing remark (234 chars)
Three bedrooms, two full bathrooms situated on a corner lot. The kitchen includes modern cabinets with granite countertops. Large living room with vaulted ceiling and a fireplace. Master en suite. Covered carport. Detached metal shed.
-
1990-06-06soldstatus
ⓘ Source: listings_history table (triggers on properties + properties_extension) + one-shot
backfill from property_details.listing_events for pre-trigger history.
Tax reassessment forecast LA · Resets to sale price
- Current annual tax
- $991 · $83/mo
- Projected year-2 tax
- $991 · $83/mo
- Expected delta
- $0/yr ($0/mo · 0.0%)
ⓘ Screening estimate from a state-policy table — verify with the county assessor before closing.
Climate risk First Street
- Flood 6/10 Major FEMA zone AE · 71% chance over 30 yrs
- Wildfire 1/10 Low
- Heat 8/10 Severe 7 d/yr ≥108°F today · 20 d/yr by 30 yrs out
- Wind 9/10 Extreme 99% chance of damaging wind over 30 yrs
- Air quality 3/10 Moderate 2 unhealthy d/yr today · 3 by 30 yrs out
Nearby sold comps map
Loading sold comps map…
Walkable amenities ~0.75 mi
Loading nearby amenities…
Taxation est. · year 1
- Rental income
- $26,389
- − Mortgage interest
- −$8,402
- − Property taxes
- −$991
- − Insurance
- −$5,868
- − Repairs & maintenance
- −$2,111
- − Management
- −$2,111
- − Depreciation
- −$4,364
- Taxable income
- $2,542
- Est. tax owed @ 24.0%
- −$610
- After-tax cash flow
- $3,939/yr
For passive investors: Depreciation is non-cash, so a rental often shows a tax loss while cash-flowing — sheltering income. Rental losses are passive: they offset passive income freely, and up to $25,000/yr can offset ordinary (W-2) income if you actively participate and your MAGI is under $100k (phasing out to $0 by $150k); unused losses carry forward. On sale, claimed depreciation is recaptured at up to 25%, and gains may owe capital-gains tax (a 1031 exchange can defer both). Figures are a year-1 estimate at your 24.0% rate — not tax advice; consult a CPA.
Schools (NCES district)
- District
- Central Community School District
- NCES district ID
- 2200125
- Math proficiency
- 50% ▼ -32.00%
- Reading proficiency
- 54% ▼ -31.00%
- Median HH income
- $66,584
- Composite
- 46.02/100
- National rank
- #2528
- State rank
- #9 of 98 in LA
Livability — Central
- Score
- 74/100
- State rank
- #25
- US rank
- #4761
Category grades
Schools grade is shown separately in the Schools card above.
Census & demographics
- Census place
- Central, LA
- County
- East Baton Rouge Parish · 399,686 people
- City population
- 10,403
- Metro
- Baton Rouge, LA
- Population (ZIP)
- 9,370
- Household income
- $78,432
- Rent vs Own
- Severe rent burden
- 408.0
Population outlook (East Baton Rouge County) Hauer SSP2
- Today (2025)
- 464,810 people
- By 2030
- 472,137 · +1.6%
- By 2040
- 480,243 · +3.3%
- By 2050
- 484,422 · +4.2%
- By 2075
- 492,069 · +5.9%
- By 2100
- 476,347 · +2.5%
Race, ethnicity, and origin ACS 2023
- Neighborhood character
- Predominantly White (70%)
- Race & ethnicity
- White 70% Black 21% Two or more races 5% Hispanic / Latino 3%
- Common ancestry
- Lithuanian 8% Italian 1% Serbian 1%
- Foreign-born
- 1% · Canada
- Languages at home
- 96% English-only · Spanish 3% French/Haitian/Cajun 1%
Political lean MEDSL · East Baton Rouge
- 2024 margin
- D (+11.1) · D 54.5% · R 43.4% · Other 2.1%
- 2008→2024 swing
- +8.9pp toward D · 2008: 2.2pp · 2024: 11.1pp
- All cycles
- 2024: D+11.1 2020: D+13.1 2016: D+9.2 2012: D+5.2 2008: D+2.2
Not yet ingested
- Civics
- —
Market trends
- HPI YoY
- ▼ -132.34%
- Current HPI
- 169.9642
- Rent YoY
- —
- Metro
- Baton Rouge, LA
- State GDP YoY
- ▲ 3.29%
- F500 in state
- 10
Industry mix (Fortune 500 HQ in LA)
| Industry | F500 HQs | Revenue |
|---|---|---|
| Telecommunications | 2 | $23B |
|
||
| Utilities | 1 | $12B |
|
||
| Wholesale / Distribution | 1 | $5B |
|
||
| Advertising | 1 | $2B |
|
||
Price history
+0.0% since first listed5 events — show timeline
- 2026-05-07 Pending — AcadianaMLS
- 2026-05-07 Pending — GBRMLS
- 2026-04-13 Listed $150,000 GBRMLS
- 2026-04-13 Listed $150,000 AcadianaMLS
- 1990-06-06 Sold (Public Records) — Public Records
Property tax history
+29.5%/yrLatest (2025): $991 · -0.4% YoY. Source: county tax records.
Cash-flow waterfall
monthlySold comps — $/sqft
last 12 mo · ≤1 miLoading sold comps…