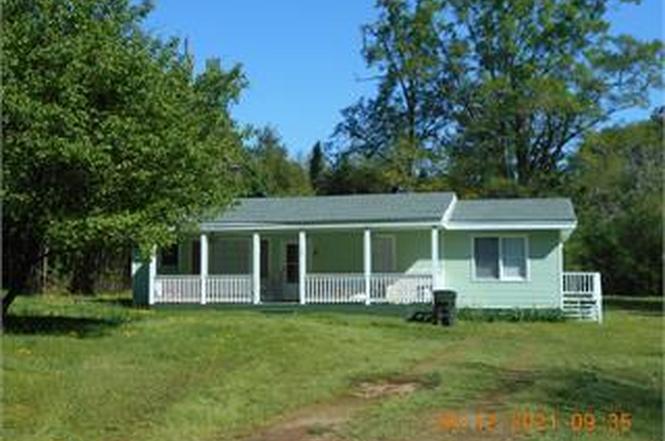
32 Pine Dr · Hogansville, GA
Flood risk 1/10 · Minimal
- FEMA flood zone
- X (unshaded)
- Chance of flooding over 30 yrs
- 0.0%
- Est. flood insurance / yr
- $507 – $1,088
Fire risk 3/10 · Minor
- Est. fire insurance / yr
- $963 – $1,789
Heat risk 6/10 · Moderate
- Hot days now (above 106°F)
- 7 days/yr
- Hot days in 30 yrs
- 19 days/yr
Wind risk 6/10 · Moderate
- Chance of severe wind over 30 yrs
- 44.0%
Air-quality risk 4/10 · Minor
- Unhealthy air days now
- 4 days/yr
- Unhealthy air days in 30 yrs
- 5 days/yr
Risk factors via First Street. Map © Google.
Why this score? — see what drove the C grade
The composite is a weighted blend of 9 inputs, each scored 0–100. Each bar is that input's sub-score; the figure is the points it added to the 100-point composite (weight × sub-score).
- Cash flow +19.5/30.0
- ARV discount +15.0/15.0
- DSCR +6.1/10.0
- 1% rule +4.6/10.0
- Livability +2.9/5.0
- Rent growth +2.5/5.0
- Condition / age +2.5/5.0
- Schools +2.3/10.0
- Appreciation +0.0/10.0
$145,000
🖨 Deal sheet 📄 Offer letter ✓ Due diligence
Listing remarks MLS
100% USDA Financing available. Cozy ranch home, 2 bedroom, 2 bath with new HVAC, new Roof and fresh paint throughout. Convenient location to 1-85. Must see! Call today!
Key facts
- 0.46 acre lot
- Built 1958
- Listed 3 days
Property features AI
Finance
- Other: Approximately 0.46-acre lot
- Financial info: Listing accepts Cash, Conventional, FHA, USDA loan, and VA loan
- HOA & community: No HOA
Exterior
- Parking: Off-street parking
- Security: No security features listed
- Utilities: Public water; Septic tank sewer; Electricity available
- Home design: Single-family house; Residential resale; One story
- Construction: Built in 1958; Composition roof; Other construction materials
- Exterior features: Level lot
Interior
- Kitchen: No kitchen appliance details provided
- Bedrooms: 2 bedrooms on the main level
- Flooring: Carpet; Vinyl
- Bathrooms: 2 full bathrooms (both on the main level)
- Heating & cooling: Electric and natural gas heating; Central air conditioning; Ceiling fans
- Interior features: Den; Mud room; Laundry room; One-level living; No basement; Other interior features
- Laundry & utility: Laundry in mud room
Neighborhood map
What this means for you Summary
Snapshot
- This is a 3-bed/1.0-bath single-family listed at $145k.
Deal economics
- At list price, monthly cash flow is $163 ($2k/yr) — positive.
- The deal already cash-flows at list — no discount required.
- To meet the 1% rule (rent ≥ 1% of price), the offer needs to be $139k (4.1% below list).
- Recommended offer: $139k (4.1% below list) — sets the bar for 1% rule.
- Cap rate 7.6% vs local median 3.6% in Hogansville — top-decile yield for the area; either an underpriced asset or a hidden risk that comps aren't pricing in. Stress-test before assuming the spread holds.
Location & tenants
- Location reads 58/100 on livability (#425 in GA) — a working-class tenant base; expect higher turnover. Strengths: cost of living A+, housing A+, crime B+; Watch: amenities F, commute F, employment F.
- Troup County (rural): math 26% / reading 29% proficiency, ranked #109 of 174 in GA (top 63%) — low school quality limits family demand, transient renter base, plan for 1-2y turnover.
- Zoned schools: Hogansville Elementary School (math 27% / reading 17%, grade F, #810 of 1,228 statewide, top 69%, 439 students, 94% FRL); Callaway Middle School (math 12% / reading 22%, grade F, #381 of 470 statewide, top 82%, 759 students, 94% FRL); Callaway High School (math 13% / reading 22%, grade F, #264 of 424 statewide, top 63%, 921 students, 94% FRL) — zoned schools average 94% FRL vs 58% district-wide (36 pts higher); higher-poverty schools than district average — tighter screening recommended.
- Market conditions: 184 active listings in the ZIP; 6 comparable units currently listed for rent nearby; rentals at typical pace (median 25d on market — plan ~3-4 weeks tenant-placement turnaround); 474 units permitted in Troup County in 2024 (87 in 5+ unit buildings).
Forward outlook
- Local home prices are declining (-3.0%/yr); year-one equity from $1k of loan paydown is wiped out by about $4k of value loss. Plan a longer hold.
- Troup County population projected at +15% by 2050 — long-run rental-demand tailwind backs the buy-and-hold thesis.
Negotiation context
- Only 3 days on market — expect competitive offers; lowballing is unlikely to land.
- 2 sale attempts since 6y ago with the ask held roughly flat each time — persistent listings suggest the price (not the market) is what's stuck; bring a comps-based counter.
- Current owner paid $94k; list at $145k implies a 54% gain — meaningful room to come down on a strong offer.
Risks & watch-outs
- Watch-outs: built in 1958 — expect roof / HVAC / electrical / plumbing capex.
- Climate carrying-cost: major wind risk, 44% chance of damaging wind over 30y; extreme-heat days projected 7→19/yr by 2055 (HVAC capex compounding) — expect insurance premiums to compound above CPI over the hold.
Questions for the listing agent
- Built in 1958 — when were the roof, HVAC, electrical panel, plumbing, and water heater last replaced?
- Is there a deadline driving the sale (1031 exchange, divorce, estate, relocation)? That informs how much negotiation room exists.
- Schools are F-rated, which usually means shorter tenancies and higher turnover. Who's the typical renter profile here, and what's been the actual vacancy rate?
- What's the average days-on-market for RENTAL listings here right now (not sales)? A rising rental-DOM trend means longer vacancies and softer asking-rent achievability than the comps imply.
- What's the recent tenant-quality profile in this submarket — average credit score on applications, eviction rate, late-payment / NSF rate, and stable-employment percentage? A property-management company in the area should have these aggregated.
- How much new for-sale + rental construction is in the pipeline within 1–3 miles? Heavy new supply typically softens prices + rents 12–24 months out; constrained supply supports both.
Investment metrics
- 1% rule
- 0.96% ✗
- Cap rate
- 7.65%
- Cash-on-cash
- 4.83%
- DSCR
- 1.21
- GRM
- 8.7
CMA / ARV
- ARV (on-the-fly)
- $219,480
- Comps found
- 12
Show comp detail 12 sales within ~0.75 mi
| Address | Dist | Beds/Ba | Sqft | Sold | Price | $/sf | Match |
|---|---|---|---|---|---|---|---|
| 107 Green Ave | 0.67mi | 3/2.0 | 1,454 (+3%) | 2mo | $240,000 | $165 | 59 |
| 500 Lincoln St | 0.57mi | 3/1.0 | 1,400 (-1%) | 18mo | $95,000 | $68 | 57 |
| 100 International St | 0.67mi | 3/2.0 | 1,493 (+5%) | 5mo | $164,900 | $110 | 51 |
| 103 Greene Ave | 0.68mi | 3/1.5 | 1,444 (+2%) | 16mo | $184,000 | $127 | 49 |
| 102 Dickinson St | 0.66mi | 3/2.0 | 1,472 (+4%) | 12mo | $255,000 | $173 | 49 |
| 208 Royal Ave | 0.70mi | 3/2.0 | 1,268 (-10%) | 4mo | $205,000 | $162 | 42 |
| 104 Dickinson St | 0.65mi | 3/2.0 | 1,528 (+8%) | 13mo | $254,000 | $166 | 42 |
| 404 Lincoln St | 0.62mi | 3/1.0 | 1,204 (-15%) | 6mo | $149,000 | $124 | 41 |
| 115 International St | 0.60mi | 3/2.0 | 1,514 (+7%) | 20mo | $253,100 | $167 | 40 |
| 108 Corinth Rd | 0.69mi | 2/1.0 (-1) | 1,308 (-8%) | 15mo | $57,000 | $44 | 38 |
| 103 Blue Creek Ct | 0.67mi | 3/2.0 | 1,222 (-14%) | 14mo | $112,780 | $92 | 30 |
| 200 Askew Ave | 0.70mi | 3/2.0 | 1,612 (+14%) | 22mo | $250,000 | $155 | 22 |
Match score weights: distance 35% · size 25% · config 20% · recency 20%. Top-matched comps best support the ARV.
Projected returns pro-forma
-3.0% appreciation · 3.0% rent growth · sell at horizon
- IRR
- -8.8%
- Equity multiple
- 0.68×
- Total profit
- $-13,109
- Equity at exit
- $21,620
- IRR
- 0.7%
- Equity multiple
- 1.05×
- Total profit
- $1,905
- Equity at exit
- $12,537
Cash invested: $40,600 (down + closing). Projections, not guarantees.
Landlord ↔ Tenant lean methodology
- Overall (STATE)
- 90 Strongly Landlord-Friendly
- State Georgia
- 90 Strongly Landlord-Friendly · R+3
- County
- — inherits STATE
- City
- — inherits STATE
ZIP-level market 30230
- Home prices YoY
- -9.5%
- Active inventory
- 184
- Price-to-rent
- 8.7×
Monthly cashflow live
- Estimated rent
- $1,391 high interval (Pro) →
- Mortgage (P&I)
- −$760
- Tax from tax record
- −$115 /mo · $1,377/yr
- Insurance
- −$60
- HOA
- −$0
- Vacancy / Maint / Mgmt
- −$292
- Net cashflow
- $163
Break-even live
UW: 25.0% down · 7.5% · 30yr · 1.5% tax · 5.0% vac · 8.0% maint · 8.0% mgmt
Financing live
Cash to close
- Down payment
- $36,250
- Closing costs
- $4,350
- Reserves months
- —
- Total cash needed
- —
Loan-product check · same deal, 3 products live
Conventional
25% down · 7.5% · 30yr
- Down + closing
- —
- Monthly P&I
- —
- Monthly cashflow
- —
- DSCR
- —
- Eligible?
- —
Personal DTI + credit; lowest rate.
DSCR
20% down · 8.5% · 30yr
- Down + closing
- —
- Monthly P&I
- —
- Monthly cashflow
- —
- DSCR
- —
- Eligible?
- —
No personal income docs; deal must DSCR.
Hard money
10% down · 12.0% · 12mo
- Down + closing
- —
- Monthly P&I
- —
- Monthly cashflow
- —
- DSCR
- —
- Eligible?
- —
Short-term bridge; refi at stabilization.
Rent comps 6 comps
| Address | Beds | Baths | Sqft | Rent | $/sqft | DOM | Units | Dist |
|---|---|---|---|---|---|---|---|---|
| 108 International St Hogansville, GA | 3.0 | 1.0 | 1258 | $1,195 | $0.95 | 1d | 1 | 0.60mi |
| 406 E Main St Hogansville, GA | 2.0 | 1.5 | 900 | $999 | $1.11 | 24d | 1 | 1.14mi |
| 406 E Main St Hogansville, GA | 2.0 | 1.5 | 900 | $999 | $1.11 | 44d | 1 | 1.14mi |
| 306 Foxtrot Trl Hogansville, GA | 4.0 | 2.0 | 1603 | $1,825 | $1.14 | 20d | 1 | 1.16mi |
| 225 Brooks Rd Hogansville, GA | 3.0 | 2.0 | 1100 | $1,500 | $1.36 | 44d | 1 | 1.27mi |
| 228 Fox Chase Way Hogansville, GA | 4.0 | 3.0 | 1811 | $1,925 | $1.06 | 13d | 1 | 1.27mi |
Listing history 5 events
-
2026-06-17status $145,000 Under Contract 3 DOM
-
2026-06-16days on market $145,000 New 3 DOM
-
2026-06-15days on market $145,000 New 2 DOM
-
2026-06-14remarks 303-char remark
-
2026-06-14$145,000 New 1 DOM
ⓘ Source: listings_history table (triggers on properties + properties_extension) + one-shot
backfill from property_details.listing_events for pre-trigger history.
Tax reassessment forecast GA · Resets to sale price
- Current annual tax
- $1,377 · $115/mo
- Projected year-2 tax
- $1,377 · $115/mo
- Expected delta
- $0/yr ($0/mo · 0.0%)
ⓘ Screening estimate from a state-policy table — verify with the county assessor before closing.
Climate risk First Street
- Flood 1/10 Low FEMA zone X (unshaded) · 0% chance over 30 yrs
- Wildfire 3/10 Moderate
- Heat 6/10 Major 7 d/yr ≥106°F today · 19 d/yr by 30 yrs out
- Wind 6/10 Major 44% chance of damaging wind over 30 yrs
- Air quality 4/10 Moderate 4 unhealthy d/yr today · 5 by 30 yrs out
Nearby sold comps map
Loading sold comps map…
Walkable amenities ~0.75 mi
Loading nearby amenities…
Taxation est. · year 1
- Rental income
- $16,692
- − Mortgage interest
- −$8,122
- − Property taxes
- −$1,377
- − Insurance
- −$725
- − Repairs & maintenance
- −$1,335
- − Management
- −$1,335
- − Depreciation
- −$4,218
- Taxable loss
- −$420
- Est. tax savings @ 24.0%
- +$101
- After-tax cash flow
- $2,062/yr
For passive investors: Depreciation is non-cash, so a rental often shows a tax loss while cash-flowing — sheltering income. Rental losses are passive: they offset passive income freely, and up to $25,000/yr can offset ordinary (W-2) income if you actively participate and your MAGI is under $100k (phasing out to $0 by $150k); unused losses carry forward. On sale, claimed depreciation is recaptured at up to 25%, and gains may owe capital-gains tax (a 1031 exchange can defer both). Figures are a year-1 estimate at your 24.0% rate — not tax advice; consult a CPA.
Schools (NCES district)
- District
- Troup County
- NCES district ID
- 1300001
- Math proficiency
- 26% ▼ -10.00%
- Reading proficiency
- 29% ▼ -4.00%
- Median HH income
- $41,354
- Composite
- 23.3/100
- National rank
- #7920
- State rank
- #109 of 174 in GA
Livability — Hogansville
- Score
- 58/100
- State rank
- #425
- US rank
- #20915
Category grades
Schools grade is shown separately in the Schools card above.
Census & demographics
- City population
- 9,022
- Population (ZIP)
- 9,022
Population outlook (Troup County) Hauer SSP2
- Today (2025)
- 75,537 people
- By 2030
- 78,250 · +3.6%
- By 2040
- 83,184 · +10.1%
- By 2050
- 87,167 · +15.4%
- By 2075
- 95,643 · +26.6%
- By 2100
- 94,234 · +24.8%
Race, ethnicity, and origin ACS 2023
- Neighborhood character
- Predominantly White (70%)
- Race & ethnicity
- White 70% Black 19% Two or more races 5% Hispanic / Latino 3% Asian 3%
- Common ancestry
- Slovak 1% Lithuanian 1% Iranian 1%
- Foreign-born
- 4% · Canada
- Languages at home
- 95% English-only · Other Indo-European 3% Spanish 1%
Political lean MEDSL · Troup
- 2024 margin
- Strong R (+24.4) · D 37.6% · R 62.0%
- 2008→2024 swing
- -5.4pp toward R · 2008: -19.0pp · 2024: -24.4pp
- All cycles
- 2024: R+24.4 2020: R+21.9 2016: R+23.4 2012: R+17.8 2008: R+19.0
Not yet ingested
- Civics
- —
Market trends
- HPI YoY
- ▼ -32.98%
- Current HPI
- 315.5032
- Rent YoY
- —
- Metro
- —
- State GDP YoY
- ▲ 2.66%
- F500 in state
- 28
Industry mix (Fortune 500 HQ in GA)
| Industry | F500 HQs | Revenue |
|---|---|---|
| Paper / Packaging | 2 | $29B |
|
||
| Retail | 1 | $160B |
|
||
| Transportation / Logistics | 1 | $91B |
|
||
| Airlines | 1 | $62B |
|
||
| Consumer Goods | 1 | $47B |
|
||
| Utilities | 1 | $25B |
|
||
Price history
+222.9% since first listed7 events — show timeline
- 2026-06-11 Listed $145,000 GAMLS
- 2021-01-21 Sold (Public Records) $94,000 Public Records
- 2021-01-15 Sold (MLS) $94,000 GAMLS
- 2020-10-31 Pending — GAMLS
- 2020-10-30 Listed $94,000 GAMLS
- 2010-01-07 Price Changed $39,900 GAMLS
- 2009-12-18 Price Changed $44,900 GAMLS
Property tax history
+2.3%/yrLatest (2025): $1,377 · +17.2% YoY. Source: county tax records.
Cash-flow waterfall
monthlySold comps — $/sqft
last 12 mo · ≤1 miLoading sold comps…