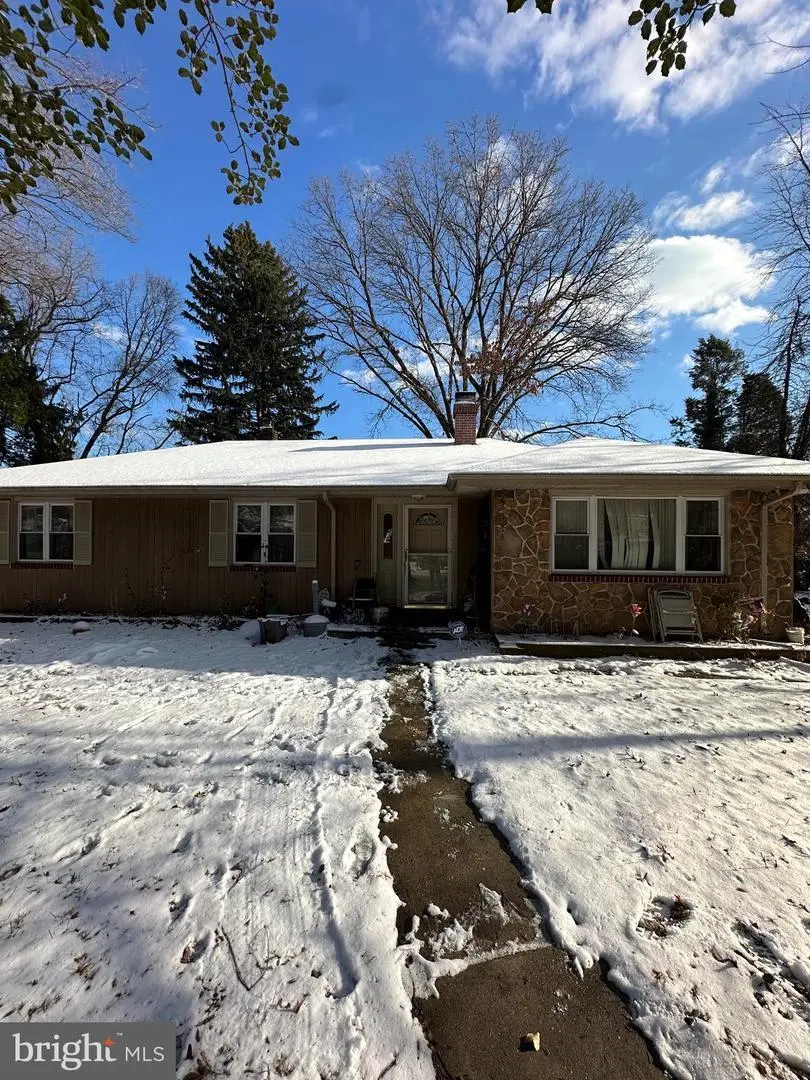
113 Harvard Ave · Somerdale, NJ
Flood risk 1/10 · Minimal
- FEMA flood zone
- X (unshaded)
- Chance of flooding over 30 yrs
- 0.0%
- Est. flood insurance / yr
- $507 – $1,088
Fire risk 1/10 · Minimal
- Est. fire insurance / yr
- $526 – $976
Heat risk 6/10 · Moderate
- Hot days now (above 103°F)
- 7 days/yr
- Hot days in 30 yrs
- 14 days/yr
Wind risk 6/10 · Moderate
- Chance of severe wind over 30 yrs
- 53.0%
Air-quality risk 3/10 · Minor
- Unhealthy air days now
- 3 days/yr
- Unhealthy air days in 30 yrs
- 3 days/yr
Risk factors via First Street. Map © Google.
Why this score? — see what drove the D+ grade
The composite is a weighted blend of 9 inputs, each scored 0–100. Each bar is that input's sub-score; the figure is the points it added to the 100-point composite (weight × sub-score).
- ARV discount +15.0/15.0
- Cash flow +12.7/30.0
- 1% rule +5.8/10.0
- DSCR +3.8/10.0
- Livability +3.6/5.0
- Rent growth +2.5/5.0
- Condition / age +2.5/5.0
- Schools +2.1/10.0
- Appreciation +0.0/10.0
$215,000
🖨 Deal sheet (PDF) 📄 Offer letter ✓ Due diligence
Listing remarks
This 3-bedroom, 1-bathroom ranch style home is a prime investment opportunity or a great starter home, it just needs a little TLC. It also has a full basement which provides great potential for more wonderful space after some renovations. This property also has a nice sized yard. Located on a quiet street.
Key facts
- Quiet street
- Nice sized yard
- Full basement
Tags
Neighborhood map
What this means for you Summary
Snapshot
- This is a 3-bed/1.0-bath single-family listed at $215k.
Deal economics
- At list price, monthly cash flow is $-22 ($-270/yr) — negative.
- To cash-flow at today's rent, offer at most $211k (1.8% below list).
- Meets the 1% rule at list price ($2k rent vs $215k).
- Recommended offer: $211k (1.8% below list) — sets the bar for cash-flow.
- Cap rate 6.2% vs local median 4.0% in Somerdale — top-decile yield for the area; either an underpriced asset or a hidden risk that comps aren't pricing in. Stress-test before assuming the spread holds.
Location & tenants
- Location reads 72/100 on livability (#207 in NJ) — a middle-class / working-renter tenant base. Strengths: housing A+, employment A, health & safety B+; Watch: schools D+, amenities D+, crime F.
- Somerdale School District (suburban): math 10% / reading 35% proficiency, ranked #408 of 472 in NJ (top 86%) — low school quality limits family demand, transient renter base, plan for 1-2y turnover.
- Market conditions: 44 active listings in the ZIP; 34 comparable units currently listed for rent nearby; rentals leasing fast (median 2d on market — plan ~1-2 weeks tenant-placement turnaround); solid renter incomes; 1,018 units permitted in Camden County in 2024 (509 in 5+ unit buildings).
Forward outlook
- Local home prices are declining (-3.0%/yr); year-one equity from $1k of loan paydown is wiped out by about $6k of value loss. Plan a longer hold.
- Camden County population projected to shrink 8% by 2050 — rents likely to lag national; underwrite the cash flow, not the appreciation.
Negotiation context
- Only 4 days on market — expect competitive offers; lowballing is unlikely to land.
Risks & watch-outs
- Watch-outs: property tax is 3.6% of price; built in 1946 — expect roof / HVAC / electrical / plumbing capex.
- Climate carrying-cost: major wind risk, 53% chance of damaging wind over 30y; extreme-heat days projected 7→14/yr by 2055 (HVAC capex compounding) — expect insurance premiums to compound above CPI over the hold.
Questions for the listing agent
- What do current leases actually rent for vs. the listed asking? Can we see a recent rent roll and the last 12 months of T-12 income?
- Built in 1946 — when were the roof, HVAC, electrical panel, plumbing, and water heater last replaced?
- Property tax is high relative to price — has the assessment been appealed recently, and will the sale trigger a re-assessment?
- Is there a deadline driving the sale (1031 exchange, divorce, estate, relocation)? That informs how much negotiation room exists.
- Schools are D-rated, which usually means shorter tenancies and higher turnover. Who's the typical renter profile here, and what's been the actual vacancy rate?
- Crime grade is F in this area — have there been break-ins, vandalism, or insurance claims at this property in the last 3 years? What carrier currently insures it and at what premium?
- The area grade is low — what's the realistic commute time and amenity access for the typical tenant pool here? Any planned neighborhood developments (good or bad) we should know about?
- What's the average days-on-market for RENTAL listings here right now (not sales)? A rising rental-DOM trend means longer vacancies and softer asking-rent achievability than the comps imply.
- What's the recent tenant-quality profile in this submarket — average credit score on applications, eviction rate, late-payment / NSF rate, and stable-employment percentage? A property-management company in the area should have these aggregated.
- How much new for-sale + rental construction is in the pipeline within 1–3 miles? Heavy new supply typically softens prices + rents 12–24 months out; constrained supply supports both.
Investment metrics
- 1% rule
- 1.08% ✓
- Cap rate
- 6.17%
- Cash-on-cash
- -0.45%
- DSCR
- 0.98
- GRM
- 7.7
CMA / ARV
- ARV (on-the-fly)
- $314,622
- Comps found
- 12
Show comp detail 12 sales within ~0.75 mi
| Address | Dist | Beds/Ba | Sqft | Sold | Price | $/sf | Match |
|---|---|---|---|---|---|---|---|
| 113 Harvard Ave | 0.00mi | 3/1.0 | 1,386 (0%) | 1mo | $189,000 | $136 | 99 |
| 6 Yale Ave | 0.15mi | 3/1.0 | 1,437 (+4%) | 3mo | $270,000 | $188 | 84 |
| 18 Yale Ave | 0.12mi | 3/1.5 | 1,427 (+3%) | 6mo | $355,000 | $249 | 82 |
| 103 Vassar Ave | 0.12mi | 3/2.0 | 1,444 (+4%) | 2mo | $301,000 | $208 | 82 |
| 25 Station Ave | 0.11mi | 3/2.0 | 1,492 (+8%) | 1mo | $310,000 | $208 | 77 |
| 23 Station Ave | 0.11mi | 4/3.0 (+1) | 1,344 (-3%) | 2mo | $360,000 | $268 | 75 |
| 8 Pennsylvania Ave | 0.39mi | 3/1.5 | 1,362 (-2%) | 3mo | $309,000 | $227 | 74 |
| 401 S Browning Ave | 0.46mi | 3/1.5 | 1,405 (+1%) | 3mo | $377,000 | $268 | 72 |
| 116 Cornell Ave | 0.43mi | 3/2.0 | 1,344 (-3%) | 9mo | $395,000 | $294 | 63 |
| 105 Holyoke Ave | 0.11mi | 4/2.0 (+1) | 1,182 (-15%) | 3mo | $330,000 | $279 | 58 |
| 3 Jefferson Ave | 0.68mi | 3/1.0 | 1,248 (-10%) | 5mo | $275,000 | $220 | 47 |
| 401 N Atlantic Ave | 0.67mi | 3/2.0 | 1,513 (+9%) | 5mo | $275,000 | $182 | 45 |
Match score weights: distance 35% · size 25% · config 20% · recency 20%. Top-matched comps best support the ARV.
Projected returns pro-forma
-3.0% appreciation · 3.0% rent growth · sell at horizon
- IRR
- -16.9%
- Equity multiple
- 0.40×
- Total profit
- $-36,003
- Equity at exit
- $32,057
- IRR
- -8.5%
- Equity multiple
- 0.47×
- Total profit
- $-32,104
- Equity at exit
- $18,589
Cash invested: $60,200 (down + closing). Projections, not guarantees.
Landlord ↔ Tenant lean methodology
- Overall (STATE)
- 21 Tenant-Leaning
- State New Jersey
- 21 Tenant-Leaning · D+6
- County
- — inherits STATE
- City
- — inherits STATE
ZIP-level market 08083
- Home prices YoY
- -24.8%
- Active inventory
- 44
- Price-to-rent
- 7.7×
Monthly cashflow live
- Estimated rent
- $2,333 high interval (Pro) →
- Mortgage (P&I)
- −$1,127
- Tax from tax record
- −$648 /mo · $7,778/yr
- Insurance
- −$90
- HOA
- −$0
- Vacancy / Maint / Mgmt
- −$490
- Net cashflow
- $-22
Break-even live
Sensitivity live
| Price | -10% $99 | -5% $38 | +0% $-22 | +5% $-83 | +10% $-144 |
|---|---|---|---|---|---|
| Rent | -10% $-207 | -5% $-115 | +0% $-22 | +5% $70 | +10% $162 |
| Rate | -1.0pp $86 | -0.5pp $32 | base $-22 | +0.5pp $-78 | +1.0pp $-135 |
UW: 25.0% down · 7.5% · 30yr · 1.5% tax · 5.0% vac · 8.0% maint · 8.0% mgmt
Financing live
Cash to close
- Down payment
- $53,750
- Closing costs
- $6,450
- Reserves months
- —
- Total cash needed
- —
Loan-product check · same deal, 3 products live
Conventional
25% down · 7.5% · 30yr
- Down + closing
- —
- Monthly P&I
- —
- Monthly cashflow
- —
- DSCR
- —
- Eligible?
- —
Personal DTI + credit; lowest rate.
DSCR
20% down · 8.5% · 30yr
- Down + closing
- —
- Monthly P&I
- —
- Monthly cashflow
- —
- DSCR
- —
- Eligible?
- —
No personal income docs; deal must DSCR.
Hard money
10% down · 12.0% · 12mo
- Down + closing
- —
- Monthly P&I
- —
- Monthly cashflow
- —
- DSCR
- —
- Eligible?
- —
Short-term bridge; refi at stabilization.
Rent comps 34 comps
| Address | Beds | Baths | Sqft | Rent | $/sqft | DOM | Units | Dist |
|---|---|---|---|---|---|---|---|---|
| 8 Cornell Ave Somerdale, NJ | 4.0 | 2.0 | 1546 | $3,200 | $2.07 | 25d | 1 | 0.26mi |
| 4 Millbank Ct Voorhees, NJ | 3.0 | 2.5 | 1470 | $3,400 | $2.31 | 2d | 1 | 0.50mi |
| 5 Sidney Ln Stratford, NJ | 2.0 | 2.5 | 1548 | $2,800 | $1.81 | 2d | 1 | 0.52mi |
| 201 Lucas Ln Voorhees, NJ | 2.0 | 2.0 | 1112 | $2,000 | $1.80 | 13d | 1 | 0.60mi |
| 103 Lucas Ln Voorhees, NJ | 2.0 | 2.0 | 1112 | $2,100 | $1.89 | 23d | 1 | 0.61mi |
| 504 Britton Pl Voorhees, NJ | 2.0 | 2.0 | 1112 | $2,100 | $1.89 | 2d | 1 | 0.62mi |
| 120 Webster Ave Stratford, NJ | 3.0 | 1.0 | 1000 | $2,500 | $2.50 | 2d | 1 | 0.62mi |
| 5104 Tracy Ct Voorhees, NJ | 2.0 | 2.0 | 1119 | $2,200 | $1.97 | 2d | 1 | 0.64mi |
| 808 Britton Pl Voorhees, NJ | 2.0 | 2.0 | 1112 | $2,000 | $1.80 | 2d | 1 | 0.69mi |
| 215 S Atlantic Ave E Stratford, NJ | 3.0 | 1.0 | 1460 | $2,445 | $1.67 | 11d | 1 | 0.72mi |
| 506 S White Horse Pike Unit E201 Stratford, NJ | 2.0 | 1.0 | 1100 | $1,500 | $1.36 | 4d | 1 | 0.74mi |
| 506 S White Horse Pike Stratford, NJ | 2.0 | 1.0 | 930 | $1,500 | $1.61 | 23d | 1 | 0.75mi |
| 506 S White Horse Pike Unit C005 Stratford, NJ | 2.0 | 1.0 | 930 | $1,620 | $1.74 | 21d | 1 | 0.75mi |
| 506 S White Horse Pike Unit A107 Stratford, NJ | 2.0 | 1.0 | 1015 | $1,475 | $1.45 | 11d | 9 | 0.75mi |
| 506 S White Horse Pike Unit F104 Stratford, NJ | 2.0 | 1.0 | 930 | $1,410 | $1.52 | 21d | 1 | 0.76mi |
| 506 S White Horse Pike Unit F104 Stratford, NJ | 2.0 | 1.0 | 930 | $1,300 | $1.40 | 4d | 1 | 0.76mi |
| 1256 Kirkwood-gibbsboro R Voorhees, NJ | 2.0 | 2.0 | 1738 | $1,050 | $0.60 | 23d | 1 | 0.82mi |
| 222 Echelon Rd Voorhees Township, NJ | 2.0 | 1.0 | 1056 | $2,000 | $1.89 | 11d | 1 | 0.86mi |
| 208 Ashley Run Voorhees, NJ | 2.0 | 2.0 | 1332 | $2,450 | $1.84 | 2d | 1 | 0.89mi |
| 225 Echelon Rd Voorhees, NJ | 1.0–2.0 | 1.0–2.0 | 850 | $2,205 | $2.59 | 2d | 1 | 1.09mi |
| 331 Preston Ave Voorhees, NJ | 1.0–2.0 | 1.0 | 900 | $2,114 | $2.35 | 2d | 1 | 1.12mi |
| 10100 Town Center Blvd Voorhees Township, NJ | 1.0–3.0 | 1.0–2.0 | 1135 | $2,736 | $2.41 | 2d | 6 | 1.13mi |
| 128 Kirkbride Rd #6 Voorhees, NJ | 2.0 | 2.0 | 1190 | $2,200 | $1.85 | 2d | 1 | 1.19mi |
| 14 Buttonwood Rd Voorhees, NJ | 4.0 | 1.5 | 1384 | $3,500 | $2.53 | 2d | 1 | 1.21mi |
| 6 Buttonwood Rd Voorhees Township, NJ | 4.0 | 2.0 | 1520 | $2,550 | $1.68 | 2d | 1 | 1.22mi |
| 12 Sandra Rd Voorhees, NJ | 2.0 | 1.0 | 1100 | $2,050 | $1.86 | 3d | 1 | 1.23mi |
| 2204 Sandra Rd Voorhees, NJ | 2.0 | 2.0 | 1006 | $2,200 | $2.19 | 6d | 1 | 1.28mi |
| 1139 Thackary Ct Voorhees, NJ | 3.0 | 2.5 | 1380 | $2,800 | $2.03 | 2d | 1 | 1.28mi |
| 116 Eaton Pl Voorhees, NJ | 4.0 | 1.5 | 1734 | $3,200 | $1.85 | 2d | 1 | 1.34mi |
| 1514 Roberts Way Voorhees, NJ | 2.0 | 2.0 | 1006 | $2,250 | $2.24 | 23d | 1 | 1.36mi |
| 1512 Roberts Way Voorhees, NJ | 2.0 | 2.0 | 1006 | $2,300 | $2.29 | 2d | 1 | 1.37mi |
| 16 W Linden Ave Lindenwold, NJ | 4.0 | 1.0 | 1560 | $2,950 | $1.89 | 2d | 1 | 1.43mi |
| 359 Lake Blvd Lindenwold, NJ | 3.0 | 2.0 | 1196 | $2,900 | $2.42 | 2d | 1 | 1.46mi |
| 109 Franklin Dr Voorhees, NJ | 2.0 | 2.0 | 1050 | $2,550 | $2.43 | 2d | 1 | 1.46mi |
Listing history 6 events
-
2026-04-14status Pending
-
2026-03-30soldstatus Closed
-
2026-02-03status Pending
-
2026-01-30soldstatus Closed
-
2025-02-18status Pending
-
2025-02-14$215,000 Active
ⓘ Source: listings_history table (triggers on properties + properties_extension) + one-shot
backfill from property_details.listing_events for pre-trigger history.
Tax reassessment forecast NJ · Partial reset (capped growth)
- Current annual tax
- $7,778 · $648/mo
- Projected year-2 tax
- $7,778 · $648/mo
- Expected delta
- $0/yr ($0/mo · 0.0%)
ⓘ Screening estimate from a state-policy table — verify with the county assessor before closing.
Climate risk First Street
- Flood 1/10 Low FEMA zone X (unshaded) · 0% chance over 30 yrs
- Wildfire 1/10 Low
- Heat 6/10 Major 7 d/yr ≥103°F today · 14 d/yr by 30 yrs out
- Wind 6/10 Major 53% chance of damaging wind over 30 yrs
- Air quality 3/10 Moderate 3 unhealthy d/yr today · 3 by 30 yrs out
Nearby sold comps map
Loading sold comps map…
Walkable amenities ~0.75 mi
Loading nearby amenities…
Taxation est. · year 1
- Rental income
- $27,991
- − Mortgage interest
- −$12,043
- − Property taxes
- −$7,778
- − Insurance
- −$1,075
- − Repairs & maintenance
- −$2,239
- − Management
- −$2,239
- − Depreciation
- −$6,255
- Taxable loss
- −$3,638
- Est. tax savings @ 24.0%
- +$873
- After-tax cash flow
- $603/yr
For passive investors: Depreciation is non-cash, so a rental often shows a tax loss while cash-flowing — sheltering income. Rental losses are passive: they offset passive income freely, and up to $25,000/yr can offset ordinary (W-2) income if you actively participate and your MAGI is under $100k (phasing out to $0 by $150k); unused losses carry forward. On sale, claimed depreciation is recaptured at up to 25%, and gains may owe capital-gains tax (a 1031 exchange can defer both). Figures are a year-1 estimate at your 24.0% rate — not tax advice; consult a CPA.
Schools (NCES district)
- District
- Somerdale School District
- NCES district ID
- 3415000
- Math proficiency
- 10% ▼ -29.00%
- Reading proficiency
- 35% ▼ -16.00%
- Median HH income
- $58,178
- Composite
- 20.67/100
- National rank
- #8532
- State rank
- #408 of 472 in NJ
Livability — Somerdale
- Score
- 72/100
- State rank
- #207
- US rank
- #5794
Category grades
Schools grade is shown separately in the Schools card above.
Census & demographics
- Census place
- Somerdale, NJ
- County
- Camden County · 407,624 people
- City population
- 9,606
- Metro
- Philadelphia-Camden-Wilmington, PA-NJ-DE-MD
- Population (ZIP)
- 9,606
- Household income
- $96,653
- Rent vs Own
- Severe rent burden
- 306.0
Population outlook (Camden County) Hauer SSP2
- Today (2025)
- 507,964 people
- By 2030
- 502,182 · -1.1%
- By 2040
- 485,602 · -4.4%
- By 2050
- 465,630 · -8.3%
- By 2075
- 419,986 · -17.3%
- By 2100
- 369,492 · -27.3%
Race, ethnicity, and origin ACS 2023
- Neighborhood character
- Majority White (64%)
- Race & ethnicity
- White 64% Black 18% Hispanic / Latino 8% Two or more races 7% Asian 4%
- Hispanic origin (detail)
- Mexican 1% Puerto Rican 4% Cuban 1%
- Common ancestry
- Romanian 6% Scotch-Irish 1% Slovak 1%
- Foreign-born
- 8% · Canada, Dominican Republic, South Korea
- Languages at home
- 87% English-only · Spanish 6% Other Indo-European 4% Russian/Polish/Slavic 1%
Political lean MEDSL · Camden
- 2024 margin
- Strong D (+27.4) · D 63.0% · R 35.5% · Other 1.5%
- 2008→2024 swing
- -8.8pp toward R · 2008: 36.2pp · 2024: 27.4pp
- All cycles
- 2024: D+27.4 2020: D+33.5 2016: D+32.4 2012: D+36.6 2008: D+36.2
Not yet ingested
- Civics
- —
Market trends
- HPI YoY
- ▼ -109.60%
- Current HPI
- 332.7053
- Rent YoY
- —
- Metro
- Philadelphia-Camden-Wilmington, PA-NJ-DE-MD
- State GDP YoY
- ▲ 2.05%
- F500 in state
- 34
Industry mix (Fortune 500 HQ in NJ)
| Industry | F500 HQs | Revenue |
|---|---|---|
| Consumer Goods | 3 | $31B |
|
||
| Pharmaceuticals | 2 | $153B |
|
||
| Technology | 2 | $21B |
|
||
| Insurance | 2 | $20B |
|
||
| Healthcare | 2 | $19B |
|
||
| Financial Services | 1 | $70B |
|
||
Price history
6 events — show timeline
- 2026-04-14 Pending — BRIGHT MLS
- 2026-03-30 Sold (MLS) — BRIGHT MLS
- 2026-02-03 Pending — BRIGHT MLS
- 2026-01-30 Sold (MLS) — BRIGHT MLS
- 2025-02-18 Pending — BRIGHT MLS
- 2025-02-14 Listed $215,000 BRIGHT MLS
Property tax history
+2.0%/yrLatest (2025): $7,778 · +2.9% YoY. Source: county tax records.
Cash-flow waterfall
monthlySold comps — $/sqft
last 12 mo · ≤1 miLoading sold comps…