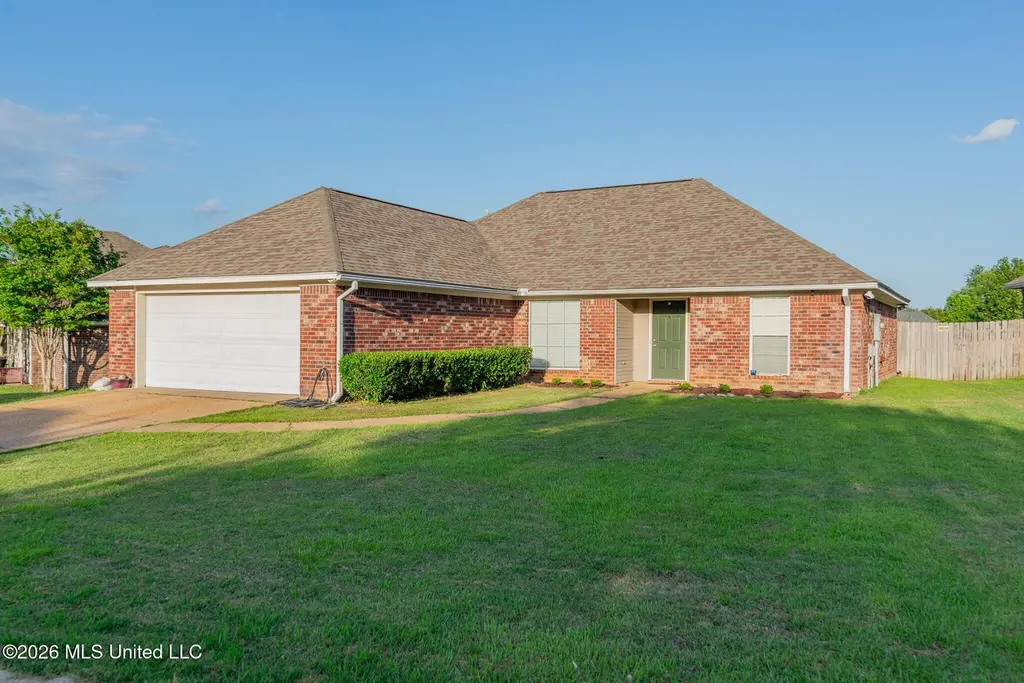
364 Kings Ridge Cir · Flowood, MS
Flood risk 1/10 · Minimal
- FEMA flood zone
- X (unshaded)
- Chance of flooding over 30 yrs
- 0.0%
- Est. flood insurance / yr
- $507 – $1,088
Fire risk 3/10 · Minor
- Est. fire insurance / yr
- $1,241 – $2,305
Heat risk 8/10 · Major
- Hot days now (above 108°F)
- 7 days/yr
- Hot days in 30 yrs
- 20 days/yr
Wind risk 8/10 · Major
- Chance of severe wind over 30 yrs
- 80.0%
Air-quality risk 2/10 · Minimal
- Unhealthy air days now
- 1 days/yr
- Unhealthy air days in 30 yrs
- 1 days/yr
Risk factors via First Street. Map © Google.
Why this score? — see what drove the D+ grade
The composite is a weighted blend of 9 inputs, each scored 0–100. Each bar is that input's sub-score; the figure is the points it added to the 100-point composite (weight × sub-score).
- Cash flow +13.4/30.0
- ARV discount +11.4/15.0
- Schools +4.6/10.0
- DSCR +4.0/10.0
- Livability +3.9/5.0
- Rent growth +3.2/5.0
- 1% rule +3.0/10.0
- Condition / age +2.5/5.0
- Appreciation +0.0/10.0
$264,900
🖨 Deal sheet (PDF) 📄 Offer letter ✓ Due diligence
Listing remarks MLS
Fresh paint-new carpet- great location- MOVE IN READY! Covenants
Key facts
- Refreshing pool
- Welcoming clubhouse
- Bike path
Tags
Property features AI
Finance
- Other: Lot approximately 0.19 acres
- HOA & community: Association fee $146 semi-annually; Association covers accounting/legal, insurance, grounds maintenance, management, pool service, and taxes; Community clubhouse, community pool, street lights
Exterior
- Parking: Attached 2-car garage with direct access
- Security: Owned security system; Smoke detectors
- Utilities: Public water; Public sewer; Electricity available; Natural gas available; Cable available
- Home design: Single-family house; One story; Move-in ready
- Construction: Brick and siding exterior; Architectural shingle roof; Slab foundation; Built with appraisal-verified living area
- Exterior features: Slab patio/porch; Wood fencing
Interior
- Kitchen: Dishwasher; Disposal; Electric cooktop; Electric range; Microwave; Oven; Exhaust fan
- Bedrooms: Walk-in closet(s)
- Flooring: Carpet; Laminate; Vinyl
- Bathrooms: 2 full bathrooms; Double vanity(s); Soaking tub
- Heating & cooling: Central heating (natural gas); Central air conditioning
- Interior features: Ceiling fans; Double vanities; Eat-in kitchen; Entrance foyer; High ceilings; Soaking tub; Walk-in closets; Fireplace in great room; Vinyl windows; Deadbolt locks; Metal insulated doors
- Laundry & utility: Laundry closet; Gas water heater; Water heater
Neighborhood map
What this means for you Summary
Snapshot
- This is a 3-bed/2.0-bath single-family listed at $265k.
Deal economics
- At list price, monthly cash flow is $5 ($59/yr) — positive.
- The deal already cash-flows at list — no discount required.
- To meet the 1% rule (rent ≥ 1% of price), the offer needs to be $211k (20.4% below list).
- Recommended offer: $211k (20.4% below list) — sets the bar for 1% rule.
- Cap rate 6.3% vs local median 4.3% in Flowood — top-decile yield for the area; either an underpriced asset or a hidden risk that comps aren't pricing in. Stress-test before assuming the spread holds.
Location & tenants
- Location reads 77/100 on livability (#10 in MS, #3,075 nationally) — a middle-class / working-renter tenant base. Strengths: crime A+, cost of living A+, housing A+; Watch: amenities F, commute F.
- Rankin County School District (rural): math 56% / reading 48% proficiency, ranked #6 of 130 in MS (top 5%) — acceptable for families but not a draw, mixed tenant base, ~2y average lease.
- Zoned schools: Highland Bluff Elementary (math 52% / reading 50%, grade C-, #58 of 375 statewide, top 15%, 577 students, 100% FRL); Northwest Rankin Middle School (math 63% / reading 51%, grade B, #13 of 179 statewide, top 7%, 1,374 students, 100% FRL); Northwest Rankin High School (math 48% / reading 42%, grade D-, #34 of 197 statewide, top 17%, 1,898 students, 100% FRL) — zoned schools average 100% FRL vs 35% district-wide (65 pts higher); higher-poverty schools than district average — tighter screening recommended.
- Market conditions: Rents rising (+2.9%/yr); 440 active listings in the ZIP; 12 comparable units currently listed for rent nearby; rentals at typical pace (median 25d on market — plan ~3-4 weeks tenant-placement turnaround); solid renter incomes; 343 units permitted in Rankin County in 2024 (0 in 5+ unit buildings).
Forward outlook
- Local home prices are declining (-3.0%/yr); year-one equity from $2k of loan paydown is wiped out by about $8k of value loss. Plan a longer hold.
- Rankin County population projected at +17% by 2050 — long-run rental-demand tailwind backs the buy-and-hold thesis.
Negotiation context
- It's been on market 40 days — a 3% lower offer ($257k) is reasonable based on typical stale-listing flexibility.
- 2 sale attempts since 11y ago with the ask held roughly flat each time — persistent listings suggest the price (not the market) is what's stuck; bring a comps-based counter.
Risks & watch-outs
- Climate carrying-cost: severe wind risk, 80% chance of damaging wind over 30y; extreme-heat days projected 7→20/yr by 2055 (HVAC capex compounding) — expect insurance premiums to compound above CPI over the hold.
Questions for the listing agent
- It's been on market 40 days. Have you received any prior offers? Is the seller open to a 20% concession, seller financing, or rate buy-down credit?
- What does the HOA fee cover, when was the last increase, and are there any pending special assessments or reserve-fund shortfalls?
- Is there a deadline driving the sale (1031 exchange, divorce, estate, relocation)? That informs how much negotiation room exists.
- Schools are B-rated — typically a magnet for longer-tenancy family renters. What's the average tenant stay here, and is there a school-zone premium baked into asking?
- The area grade is low — what's the realistic commute time and amenity access for the typical tenant pool here? Any planned neighborhood developments (good or bad) we should know about?
- What's the average days-on-market for RENTAL listings here right now (not sales)? A rising rental-DOM trend means longer vacancies and softer asking-rent achievability than the comps imply.
- What's the recent tenant-quality profile in this submarket — average credit score on applications, eviction rate, late-payment / NSF rate, and stable-employment percentage? A property-management company in the area should have these aggregated.
- How much new for-sale + rental construction is in the pipeline within 1–3 miles? Heavy new supply typically softens prices + rents 12–24 months out; constrained supply supports both.
Investment metrics
- 1% rule
- 0.80% ✗
- Cap rate
- 6.32%
- Cash-on-cash
- 0.08%
- DSCR
- 1.00
- GRM
- 10.5
CMA / ARV
- ARV (on-the-fly)
- $289,980
- Comps found
- 12
Show comp detail 12 sales within ~0.75 mi
| Address | Dist | Beds/Ba | Sqft | Sold | Price | $/sf | Match |
|---|---|---|---|---|---|---|---|
| 810 Wedgewood Ct | 0.11mi | 3/2.0 | 1,486 (-8%) | 1mo | $269,900 | $182 | 80 |
| 311 Camber Ct | 0.48mi | 3/2.0 | 1,625 (+0%) | 2mo | $278,500 | $171 | 75 |
| 301 Spring Hill Pt | 0.25mi | 3/2.0 | 1,789 (+10%) | 1mo | $300,000 | $168 | 70 |
| 164 Regatta Dr | 0.52mi | 3/2.0 | 1,566 (-3%) | 0mo | $280,000 | $179 | 70 |
| 148 W Pinebrook Dr | 0.61mi | 3/2.0 | 1,604 (-1%) | 0mo | $289,900 | $181 | 70 |
| 318 Greensboro Dr | 0.37mi | 3/2.0 | 1,505 (-7%) | 2mo | $259,900 | $173 | 69 |
| 100 Summerdale Pl | 0.30mi | 3/2.0 | 1,440 (-11%) | 0mo | $287,000 | $199 | 67 |
| 144 Britton Cir | 0.74mi | 3/2.0 | 1,637 (+1%) | 1mo | $287,500 | $176 | 63 |
| 509 Suffolk Cv | 0.34mi | 3/2.0 | 1,410 (-13%) | 1mo | $275,000 | $195 | 62 |
| 159 Regatta Dr | 0.57mi | 3/2.0 | 1,715 (+6%) | 3mo | $289,900 | $169 | 62 |
| 213 Ashton Way | 0.51mi | 3/2.0 | 1,403 (-13%) | 0mo | $273,500 | $195 | 53 |
| 169 Bellegrove Cir | 0.72mi | 3/2.0 | 1,394 (-14%) | 2mo | $220,000 | $158 | 42 |
Match score weights: distance 35% · size 25% · config 20% · recency 20%. Top-matched comps best support the ARV.
Projected returns pro-forma
-3.0% appreciation · 2.9% rent growth · sell at horizon
- IRR
- -16.3%
- Equity multiple
- 0.42×
- Total profit
- $-42,895
- Equity at exit
- $39,497
- IRR
- -8.2%
- Equity multiple
- 0.49×
- Total profit
- $-38,111
- Equity at exit
- $22,904
Cash invested: $74,172 (down + closing). Projections, not guarantees.
Landlord ↔ Tenant lean methodology
- Overall (STATE)
- 90 Strongly Landlord-Friendly
- State Mississippi
- 90 Strongly Landlord-Friendly · R+11
- County
- — inherits STATE
- City
- — inherits STATE
ZIP-level market 39047
- Home prices YoY
- -32.6%
- Rents YoY
- 2.9%
- Active inventory
- 440
- Price-to-rent
- 10.5×
Monthly cashflow live
- Estimated rent
- $2,108 high interval (Pro) →
- Mortgage (P&I)
- −$1,389
- Tax from tax record
- −$137 /mo · $1,645/yr
- Insurance
- −$110
- HOA
- −$24
- Vacancy / Maint / Mgmt
- −$443
- Net cashflow
- $5
Break-even live
Sensitivity live
| Price | -10% $155 | -5% $80 | +0% $5 | +5% $-70 | +10% $-145 |
|---|---|---|---|---|---|
| Rent | -10% $-162 | -5% $-78 | +0% $5 | +5% $88 | +10% $171 |
| Rate | -1.0pp $138 | -0.5pp $72 | base $5 | +0.5pp $-64 | +1.0pp $-134 |
UW: 25.0% down · 7.5% · 30yr · 1.5% tax · 5.0% vac · 8.0% maint · 8.0% mgmt
Financing live
Cash to close
- Down payment
- $66,225
- Closing costs
- $7,947
- Reserves months
- —
- Total cash needed
- —
Loan-product check · same deal, 3 products live
Conventional
25% down · 7.5% · 30yr
- Down + closing
- —
- Monthly P&I
- —
- Monthly cashflow
- —
- DSCR
- —
- Eligible?
- —
Personal DTI + credit; lowest rate.
DSCR
20% down · 8.5% · 30yr
- Down + closing
- —
- Monthly P&I
- —
- Monthly cashflow
- —
- DSCR
- —
- Eligible?
- —
No personal income docs; deal must DSCR.
Hard money
10% down · 12.0% · 12mo
- Down + closing
- —
- Monthly P&I
- —
- Monthly cashflow
- —
- DSCR
- —
- Eligible?
- —
Short-term bridge; refi at stabilization.
Rent comps 12 comps
| Address | Beds | Baths | Sqft | Rent | $/sqft | DOM | Units | Dist |
|---|---|---|---|---|---|---|---|---|
| 500 Avalon Way Brandon, MS | 2.0–3.0 | 2.0 | 1287 | $2,052 | $1.59 | 15d | 6 | 0.24mi |
| 538 Brighton Cir Brandon, MS | 4.0 | 2.0 | 2042 | $2,395 | $1.17 | 15d | 1 | 0.36mi |
| 301 Jasmine Ct Brandon, MS | 3.0 | 2.0 | 1805 | $2,200 | $1.22 | 45d | 1 | 0.42mi |
| 1204 Barnett Bend Cir Brandon, MS | 2.0 | 2.0 | 1127 | $1,625 | $1.44 | 23d | 1 | 0.57mi |
| 154 Plum Tree Rd Brandon, MS | 3.0 | 2.0 | 1289 | $1,931 | $1.50 | 25d | 1 | 0.71mi |
| 352 Brendalwood Cv Brandon, MS | 2.0 | 1.5 | 1248 | $1,157 | $0.93 | 45d | 1 | 0.88mi |
| 199 Dogwood Cir Brandon, MS | 3.0 | 2.0 | 1550 | $1,900 | $1.23 | 46d | 1 | 0.95mi |
| 218 Shenandoah Rd N Brandon, MS | 3.0 | 2.0 | 1625 | $2,006 | $1.23 | 45d | 1 | 1.09mi |
| 183 Cumberland Rd Brandon, MS | 3.0 | 2.0 | 1097 | $1,750 | $1.60 | 23d | 1 | 1.11mi |
| 111 Lakeshore Dr Brandon, MS | 1.0–3.0 | 1.0–2.0 | 974 | $2,218 | $2.28 | 15d | 8 | 1.18mi |
| 133 Cumberland Rd Brandon, MS | 4.0 | 3.0 | 1846 | $2,225 | $1.21 | 25d | 1 | 1.23mi |
| 413 Shenandoah Rd N Brandon, MS | 4.0 | 2.0 | 1715 | $2,056 | $1.20 | 15d | 1 | 1.31mi |
HOA detail
- Monthly dues
- $24 · $288/yr
Listing history 20 events
-
2026-06-22days on market $264,900 Active 40 DOM
-
2026-06-18days on market $264,900 Active 37 DOM
-
2026-06-17days on market $264,900 Active 36 DOM
-
2026-06-16days on market $264,900 Active 35 DOM
-
2026-06-15days on market $264,900 Active 34 DOM
-
2026-06-14days on market $264,900 Active 32 DOM
-
2026-06-13days on market $264,900 Active 31 DOM
-
2026-06-10days on market $264,900 Active 29 DOM
-
2026-06-09days on market $264,900 Active 28 DOM
-
2026-06-08days on market $264,900 Active 27 DOM
-
2026-06-07days on market $264,900 Active 26 DOM
-
2026-06-03days on market $264,900 Active 22 DOM
-
2026-06-02days on market $264,900 Active 21 DOM
-
2026-06-01days on market $264,900 Active 20 DOM
-
2026-05-31days on market $264,900 Active 19 DOM
-
2026-05-30days on market $264,900 Active 18 DOM
-
2026-04-29status Pending
-
2026-04-16$264,900 Active
-
2015-06-05soldstatus 64-char remark
Show marketing remark (64 chars)
Fresh paint-new carpet- great location- MOVE IN READY! Covenants
-
2015-02-21$169,500 64-char remark
Show marketing remark (64 chars)
Fresh paint-new carpet- great location- MOVE IN READY! Covenants
ⓘ Source: listings_history table (triggers on properties + properties_extension) + one-shot
backfill from property_details.listing_events for pre-trigger history.
Tax reassessment forecast MS · Resets to sale price
- Current annual tax
- $1,645 · $137/mo
- Projected year-2 tax
- $2,093 · $174/mo
- Expected delta
- +$448/yr (+$37/mo · 27.2%)
ⓘ Screening estimate from a state-policy table — verify with the county assessor before closing.
Climate risk First Street
- Flood 1/10 Low FEMA zone X (unshaded) · 0% chance over 30 yrs
- Wildfire 3/10 Moderate
- Heat 8/10 Severe 7 d/yr ≥108°F today · 20 d/yr by 30 yrs out
- Wind 8/10 Severe 80% chance of damaging wind over 30 yrs
- Air quality 2/10 Low 1 unhealthy d/yr today · 1 by 30 yrs out
Nearby sold comps map
Loading sold comps map…
Walkable amenities ~0.75 mi
Loading nearby amenities…
Taxation est. · year 1
- Rental income
- $25,300
- − Mortgage interest
- −$14,839
- − Property taxes
- −$1,645
- − Insurance
- −$1,324
- − Repairs & maintenance
- −$2,024
- − Management
- −$2,024
- − HOA
- −$288
- − Depreciation
- −$7,706
- Taxable loss
- −$4,550
- Est. tax savings @ 24.0%
- +$1,092
- After-tax cash flow
- $1,151/yr
For passive investors: Depreciation is non-cash, so a rental often shows a tax loss while cash-flowing — sheltering income. Rental losses are passive: they offset passive income freely, and up to $25,000/yr can offset ordinary (W-2) income if you actively participate and your MAGI is under $100k (phasing out to $0 by $150k); unused losses carry forward. On sale, claimed depreciation is recaptured at up to 25%, and gains may owe capital-gains tax (a 1031 exchange can defer both). Figures are a year-1 estimate at your 24.0% rate — not tax advice; consult a CPA.
Schools (NCES district)
- District
- Rankin County School District
- NCES district ID
- 2803830
- Math proficiency
- 56% ▼ -4.00%
- Reading proficiency
- 48% ▼ -6.00%
- Median HH income
- $61,867
- Composite
- 45.62/100
- National rank
- #2587
- State rank
- #6 of 130 in MS
Livability — Flowood
- Score
- 77/100
- State rank
- #10
- US rank
- #3075
Category grades
Schools grade is shown separately in the Schools card above.
Census & demographics
- County
- Rankin County · 123,614 people
- City population
- 9,222
- Metro
- Jackson, MS
- Population (ZIP)
- 40,808
- Household income
- $100,347
- Rent vs Own
- Severe rent burden
- 551.0
Population outlook (Rankin County) Hauer SSP2
- Today (2025)
- 164,317 people
- By 2030
- 171,013 · +4.1%
- By 2040
- 182,723 · +11.2%
- By 2050
- 192,376 · +17.1%
- By 2075
- 209,535 · +27.5%
- By 2100
- 209,534 · +27.5%
Race, ethnicity, and origin ACS 2023
- Neighborhood character
- Predominantly White (77%)
- Race & ethnicity
- White 77% Black 16% Two or more races 4% Hispanic / Latino 2% Asian 1%
- Common ancestry
- Italian 4% Slovak 3% Serbian 3%
- Foreign-born
- 3% · Canada
- Languages at home
- 95% English-only · Spanish 3% Other Indo-European 1% Other Asian/Pacific 1%
Political lean MEDSL · Rankin
- 2024 margin
- Solid R (+47.1) · D 25.9% · R 73.0% · Other 1.0%
- 2008→2024 swing
- +6.4pp toward D · 2008: -53.5pp · 2024: -47.1pp
- All cycles
- 2024: R+47.1 2020: R+45.4 2016: R+52.9 2012: R+51.9 2008: R+53.5
Not yet ingested
- Civics
- —
Market trends
- HPI YoY
- ▼ -79.01%
- Current HPI
- 162.9709
- Rent YoY
- ▲ 2.90%
- Metro
- Jackson, MS
- State GDP YoY
- —
- F500 in state
- 0
Price history
+56.3% since first listed4 events — show timeline
- 2026-04-29 Pending — MLSU
- 2026-04-16 Listed $264,900 MLSU
- 2015-06-05 Sold (MLS) — MLSU
- 2015-02-21 Listed $169,500 MLSU
Property tax history
-2.7%/yrLatest (2025): $1,645 · +6.5% YoY. Source: county tax records.
Cash-flow waterfall
monthlySold comps — $/sqft
last 12 mo · ≤1 miLoading sold comps…