 Duplex
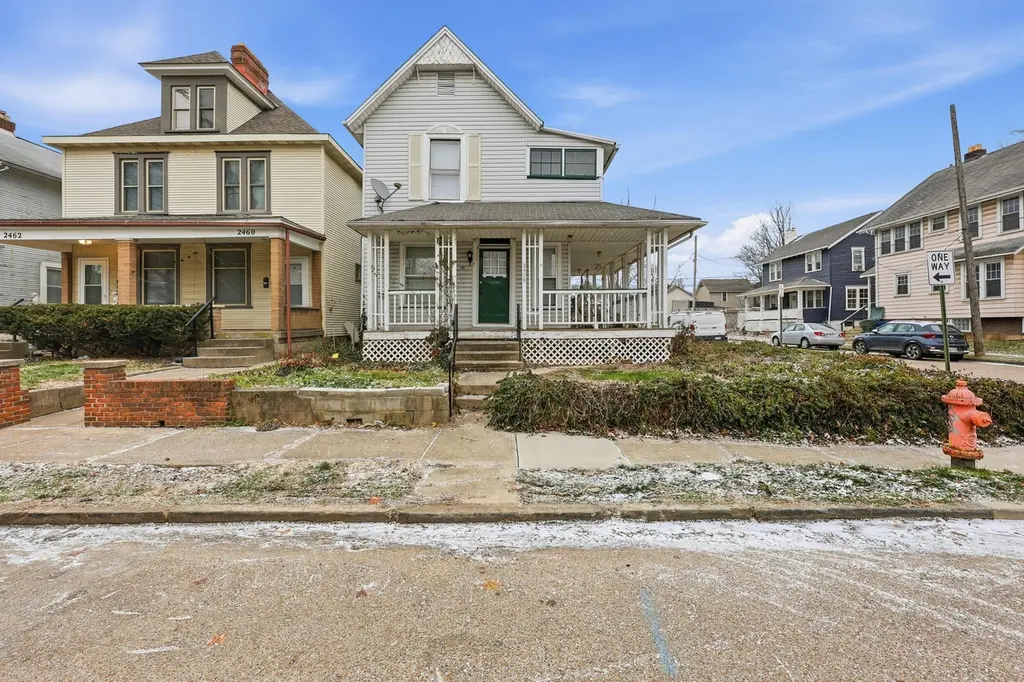
2458 Deming Ave #2458 · Columbus, OH
Flood risk 1/10 · Minimal
- FEMA flood zone
- X (unshaded)
- Chance of flooding over 30 yrs
- 0.0%
- Est. flood insurance / yr
- $473 – $860
Fire risk 1/10 · Minimal
- Est. fire insurance / yr
- $713 – $1,323
Heat risk 3/10 · Minor
- Hot days now (above 100°F)
- 7 days/yr
- Hot days in 30 yrs
- 18 days/yr
Wind risk 2/10 · Minimal
- Chance of severe wind over 30 yrs
- 1.0%
Air-quality risk 3/10 · Minor
- Unhealthy air days now
- 2 days/yr
- Unhealthy air days in 30 yrs
- 4 days/yr
Risk factors via First Street. Map © Google.
Why this score? — see what drove the C+ grade
The composite is a weighted blend of 9 inputs, each scored 0–100. Each bar is that input's sub-score; the figure is the points it added to the 100-point composite (weight × sub-score).
- Cash flow +25.2/30.0
- 1% rule +8.8/10.0
- DSCR +8.3/10.0
- ARV discount +7.5/15.0
- Livability +4.0/5.0
- Rent growth +2.6/5.0
- Condition / age +2.5/5.0
- Schools +1.7/10.0
- Appreciation +0.0/10.0
$150,000
🖨 Deal sheet 📄 Offer letter ✓ Due diligence
Multi-family units
County records classify this as Multi-Family (2-4 Unit). Listing-text estimate: 2 units. confirmed
Listing remarks
ONLINE AUCTION, the RESERVE (Minimum Bid) is $150,000. The auction ends at 7:00 PM, Wednesday, May 27th, 2026. BUYERS MUST SIGN ACKNOWLEDGEMENT OF TERMS to bid. Agents, please see 'A2A'. This duplex property offers two 1-bedroom, 1-bath units with a total of approximately 1,204 square feet of living space. The main level unit includes approximately 616 square feet, and the upper-level unit offers approximately 588 square feet. The property sits on approximately 0.06± acres with lot dimensions of 35' of frontage by 75' in depth. Recent updates completed in 2025 include interior paint in both units. The upper unit features new kitchen sink and countertop, updated flooring in the kitche
Key facts
- Recent updates
- Duplex property
- New kitchen cabinets
Tags
Property features AI
Finance
- Other: Listing offered via auction and standard listing
- Financial info: Annual tax information available
Exterior
- Utilities: Public sewer; Water available; Natural gas available; Electricity available
- Home design: Duplex property type; Originally built in 1900 with effective year built 1993
- Construction: Built in 1900; effective year 1993
- Exterior features: Small lot approximately 0.06 acres
Interior
- Interior features: Duplex (2 total units)
Neighborhood map
What this means for you Summary
Snapshot
- This is a 2 × 1-bed/1-bath units multifamily listed at $150k.
Deal economics
- At list price, monthly cash flow is $335 ($4k/yr) — positive. Per door: $167/mo.
- The deal already cash-flows at list — no discount required.
- Meets the 1% rule at list price ($2k rent vs $150k).
- Recommended offer: $148k (1.5% below list) — sets the bar for market timing.
- Cap rate 9.0% vs local median 3.8% in Columbus — top-decile yield for the area; either an underpriced asset or a hidden risk that comps aren't pricing in. Stress-test before assuming the spread holds.
Location & tenants
- Location reads 81/100 on livability (#97 in OH, #1,491 nationally) — a professional / high-income tenant draw. Strengths: commute A+, cost of living A+, housing A+; Watch: employment C-, crime F.
- Columbus City School District (urban): math 15% / reading 26% proficiency, ranked #626 of 656 in OH (top 95%) — low school quality limits family demand, transient renter base, plan for 1-2y turnover; 72% free/reduced lunch — lower-income household profile, screen leases tightly.
- Market conditions: Rents flat; 47 active listings in the ZIP; 31 comparable units currently listed for rent nearby; rentals lingering (median 44d on market — plan ~5-8 weeks vacancy on turnover, expect pricing pressure); 52% of comp listings sitting > 30 days — soft ceiling on asking rent; 8,139 units permitted in Franklin County in 2024 (5,940 in 5+ unit buildings).
- This rent runs 36% of the median local income ($70k/yr) — at the standard rent-burdened threshold; future hikes will face affordability resistance.
Forward outlook
- Local home prices are declining (-3.0%/yr); year-one equity from $1k of loan paydown is wiped out by about $4k of value loss. Plan a longer hold.
- Franklin County population projected at +34% by 2050 — long-run rental-demand tailwind backs the buy-and-hold thesis.
Negotiation context
- It's been on market 30 days — a 2% lower offer ($148k) is reasonable based on typical stale-listing flexibility.
- Current owner paid $26k; list at $150k implies a 477% gain — meaningful room to come down on a strong offer.
Risks & watch-outs
- Watch-outs: property tax is 3.6% of price; built in 1900 — expect roof / HVAC / electrical / plumbing capex.
Questions for the listing agent
- Can we see the unit-by-unit rent roll, current vacancy, and any below-market leases? What's the average tenancy length?
- What capital expenditures (roof, boiler, parking lot, exteriors) have been made in the last 5 years, and what's planned in the next 2?
- Built in 1900 — when were the roof, HVAC, electrical panel, plumbing, and water heater last replaced?
- Property tax is high relative to price — has the assessment been appealed recently, and will the sale trigger a re-assessment?
- Is there a deadline driving the sale (1031 exchange, divorce, estate, relocation)? That informs how much negotiation room exists.
- Crime grade is F in this area — have there been break-ins, vandalism, or insurance claims at this property in the last 3 years? What carrier currently insures it and at what premium?
- What's the average days-on-market for RENTAL listings here right now (not sales)? A rising rental-DOM trend means longer vacancies and softer asking-rent achievability than the comps imply.
- What's the recent tenant-quality profile in this submarket — average credit score on applications, eviction rate, late-payment / NSF rate, and stable-employment percentage? A property-management company in the area should have these aggregated.
- How much new apartment / multifamily construction is in the pipeline within 1–3 miles? Heavy new supply (>2% of stock underway) typically softens rents 12–24 months out; light construction supports rent growth.
Investment metrics
- 1% rule
- 1.38% ✓
- Cap rate
- 8.97%
- Cash-on-cash
- 9.57%
- DSCR
- 1.43
- GRM
- 6.0
CMA / ARV
- ARV (median comp)
- $318,406
- List price
- $150,000
- Delta
- -52.89%
- Verdict
- UNDERPRICED
- Comps
- 6 within 1.0 mi
Projected returns pro-forma
-3.0% appreciation · 0.59% rent growth · sell at horizon
- IRR
- -5.1%
- Equity multiple
- 0.82×
- Total profit
- $-7,693
- Equity at exit
- $22,365
- IRR
- 0.9%
- Equity multiple
- 1.06×
- Total profit
- $2,367
- Equity at exit
- $12,969
Cash invested: $42,000 (down + closing). Projections, not guarantees.
Landlord ↔ Tenant lean methodology
- Overall (STATE)
- 73 Landlord-Friendly
- State Ohio
- 73 Landlord-Friendly · R+6
- County
- — inherits STATE
- City
- — inherits STATE
ZIP-level market 43202
- Rents YoY
- 0.6%
- Active inventory
- 47
- Price-to-rent
- 12.1×
Monthly cashflow live
- Estimated rent
- $2,072 high interval (Pro) →
- Mortgage (P&I)
- −$787
- Tax from tax record
- −$453 /mo · $5,435/yr
- Insurance
- −$62
- HOA
- −$0
- Vacancy / Maint / Mgmt
- −$435
- Net cashflow
- $335
Break-even live
2-unit breakdown (identical units grouped — click to expand)
| Units | Beds | Baths | Est. rent |
|---|---|---|---|
| 2× units | 1 | 1 | $2,072 |
| #1 | 1 | 1 | $1,036 |
| #2 | 1 | 1 | $1,036 |
| Total (2 units) | $2,072 | ||
UW: 25.0% down · 7.5% · 30yr · 1.5% tax · 5.0% vac · 8.0% maint · 8.0% mgmt
Financing live
Cash to close
- Down payment
- $37,500
- Closing costs
- $4,500
- Reserves months
- —
- Total cash needed
- —
Loan-product check · same deal, 3 products live
Conventional
25% down · 7.5% · 30yr
- Down + closing
- —
- Monthly P&I
- —
- Monthly cashflow
- —
- DSCR
- —
- Eligible?
- —
Personal DTI + credit; lowest rate.
DSCR
20% down · 8.5% · 30yr
- Down + closing
- —
- Monthly P&I
- —
- Monthly cashflow
- —
- DSCR
- —
- Eligible?
- —
No personal income docs; deal must DSCR.
Hard money
10% down · 12.0% · 12mo
- Down + closing
- —
- Monthly P&I
- —
- Monthly cashflow
- —
- DSCR
- —
- Eligible?
- —
Short-term bridge; refi at stabilization.
Rent comps 31 comps
| Address | Beds | Baths | Sqft | Rent | $/sqft | DOM | Units | Dist |
|---|---|---|---|---|---|---|---|---|
| 325 Clinton St Unit 325 Columbus, OH | 3.0 | 1.0 | 1176 | $1,650 | $1.40 | 17d | 1 | 0.06mi |
| 245 Clinton St Columbus, OH | 3.0 | 1.0 | 1100 | $1,650 | $1.50 | 43d | 1 | 0.07mi |
| 2350 Indiana Ave Columbus, OH | 3.0 | 2.0 | 1195 | $2,600 | $2.18 | 43d | 1 | 0.15mi |
| 185 Clinton St Unit 1 Columbus, OH | 3.0 | 1.0 | 1166 | $1,550 | $1.33 | 3d | 1 | 0.15mi |
| 431 E Tompkins St Unit 433 Columbus, OH | 3.0 | 1.0 | 1200 | $1,595 | $1.33 | 7d | 1 | 0.20mi |
| 2584 Deming Ave Columbus, OH | 3.0 | 1.5 | 1350 | $2,000 | $1.48 | 16d | 1 | 0.21mi |
| 335 E Duncan St Columbus, OH | 3.0 | 1.0 | 1120 | $1,595 | $1.42 | 43d | 1 | 0.22mi |
| 169 E Duncan St Columbus, OH | 4.0 | 1.0 | 1364 | $1,595 | $1.17 | 43d | 1 | 0.30mi |
| 2658 Deming Ave Columbus, OH | 3.0 | 1.0 | 1120 | $1,695 | $1.51 | 43d | 1 | 0.31mi |
| 73 E Maynard Ave Columbus, OH | 5.0 | 2.0 | 1500 | $3,650 | $2.43 | 43d | 1 | 0.32mi |
| 2169 Indianola Ave Unit 2169 C Columbus, OH | 4.0 | 2.0 | 1200 | $3,400 | $2.83 | 43d | 1 | 0.38mi |
| 32-38 W Patterson Ave Unit 34 Columbus, OH | 3.0 | 1.0 | 900 | $1,950 | $2.17 | 43d | 1 | 0.46mi |
| 2137 Waldeck Ave Unit 2137 Columbus, OH | 3.0 | 1.0 | 1352 | $2,400 | $1.78 | 7d | 1 | 0.47mi |
| 2872 Indianola Ave Columbus, OH | 3.0 | 1.0 | 1000 | $1,799 | $1.80 | 43d | 1 | 0.64mi |
| 2869 Findley Ave Columbus, OH | 3.0 | 1.5 | 1247 | $2,100 | $1.68 | 7d | 1 | 0.68mi |
| 2566 Atwood Ter Columbus, OH | 3.0 | 1.0 | 979 | $1,500 | $1.53 | 23d | 1 | 1.00mi |
| 2767 Hiawatha St Columbus, OH | 3.0 | 1.0 | 896 | $1,475 | $1.65 | 7d | 1 | 1.07mi |
| 967 Duxberry Ave Columbus, OH | 3.0 | 1.0 | 864 | $1,100 | $1.27 | 43d | 1 | 1.07mi |
| 1669 Summit St Unit 1669 Columbus, OH | 4.0 | 3.0 | 1300 | $1,800 | $1.38 | 43d | 1 | 1.10mi |
| 72 Chittenden Ave Unit C Columbus, OH | 4.0 | 1.0 | 1050 | $3,400 | $3.24 | 43d | 1 | 1.18mi |
| 64 Chittenden Ave Unit 66 Columbus, OH | 4.0 | 3.0 | 1500 | $3,200 | $2.13 | 43d | 1 | 1.19mi |
| 115 W Pacemont Rd Columbus, OH | 3.0 | 1.0 | 1200 | $1,750 | $1.46 | 3d | 1 | 1.23mi |
| 780 E Brighton Rd Columbus, OH | 3.0 | 1.0 | 1086 | $1,500 | $1.38 | 7d | 1 | 1.25mi |
| 50 E 11th Ave Columbus, OH | 4.0 | 2.0 | 1000 | $3,500 | $3.50 | 43d | 4 | 1.25mi |
| 370 E 11th Ave Columbus, OH | 2.0–3.0 | 1.0–2.5 | 986 | $2,214 | $2.24 | 1d | 5 | 1.32mi |
| 1522 Indianola Ave Unit C Columbus, OH | 3.0 | 1.5 | 1270 | $1,950 | $1.54 | 23d | 1 | 1.32mi |
| 1529 N High St Columbus, OH | 1.0–3.0 | 1.0–2.0 | 771 | $4,107 | $5.32 | 23d | 1 | 1.36mi |
| 2176 Ontario St Columbus, OH | 4.0 | 2.0 | 1066 | $1,650 | $1.55 | 23d | 1 | 1.41mi |
| 121 W 9th Ave Columbus, OH | 2.0–3.0 | 1.0 | 1525 | $1,700 | $1.11 | 43d | 3 | 1.43mi |
| 1269 Minnesota Ave Columbus, OH | 3.0 | 1.0 | 1075 | $1,550 | $1.44 | 7d | 1 | 1.45mi |
| 54 W 8th Ave Columbus, OH | 3.0 | 2.0 | 1200 | $1,600 | $1.33 | 43d | 1 | 1.46mi |
Listing history 4 events
-
2026-04-28$150,000 Active 1075-char remark
-
2013-01-24soldstatus $26,000
-
2002-07-11soldstatus $85,000
-
1998-01-06soldstatus $35,000
ⓘ Source: listings_history table (triggers on properties + properties_extension) + one-shot
backfill from property_details.listing_events for pre-trigger history.
Tax reassessment forecast OH · Partial reset (capped growth)
- Current annual tax
- $5,435 · $453/mo
- Projected year-2 tax
- $5,435 · $453/mo
- Expected delta
- $0/yr ($0/mo · 0.0%)
ⓘ Screening estimate from a state-policy table — verify with the county assessor before closing.
Climate risk First Street
- Flood 1/10 Low FEMA zone X (unshaded) · 0% chance over 30 yrs
- Wildfire 1/10 Low
- Heat 3/10 Moderate 7 d/yr ≥100°F today · 18 d/yr by 30 yrs out
- Wind 2/10 Low 100% chance of damaging wind over 30 yrs
- Air quality 3/10 Moderate 2 unhealthy d/yr today · 4 by 30 yrs out
Nearby sold comps map
Loading sold comps map…
Walkable amenities ~0.75 mi
Loading nearby amenities…
Taxation est. · year 1
- Rental income
- $24,864
- − Mortgage interest
- −$8,402
- − Property taxes
- −$5,435
- − Insurance
- −$750
- − Repairs & maintenance
- −$1,989
- − Management
- −$1,989
- − Depreciation
- −$4,364
- Taxable income
- $1,935
- Est. tax owed @ 24.0%
- −$464
- After-tax cash flow
- $3,554/yr
For passive investors: Depreciation is non-cash, so a rental often shows a tax loss while cash-flowing — sheltering income. Rental losses are passive: they offset passive income freely, and up to $25,000/yr can offset ordinary (W-2) income if you actively participate and your MAGI is under $100k (phasing out to $0 by $150k); unused losses carry forward. On sale, claimed depreciation is recaptured at up to 25%, and gains may owe capital-gains tax (a 1031 exchange can defer both). Figures are a year-1 estimate at your 24.0% rate — not tax advice; consult a CPA.
Schools (NCES district)
- District
- Columbus City School District
- NCES district ID
- 3904380
- Math proficiency
- 15% ▼ -17.00%
- Reading proficiency
- 26% ▼ -12.00%
- Median HH income
- $38,483
- Composite
- 17.19/100
- National rank
- #9105
- State rank
- #626 of 656 in OH
Livability — Columbus
- Score
- 81/100
- State rank
- #97
- US rank
- #1491
Category grades
Schools grade is shown separately in the Schools card above.
Census & demographics
- Census place
- Columbus, OH
- County
- Franklin County · 1,351,780 people
- City population
- 612,189
- Metro
- Columbus, OH
- Population (ZIP)
- 20,854
- Household income
- $69,524
- Rent vs Own
- Severe rent burden
- 1426.0
Population outlook (Franklin County) Hauer SSP2
- Today (2025)
- 1,456,139 people
- By 2030
- 1,556,890 · +6.9%
- By 2040
- 1,757,349 · +20.7%
- By 2050
- 1,950,539 · +34.0%
- By 2075
- 2,376,171 · +63.2%
- By 2100
- 2,636,796 · +81.1%
Race, ethnicity, and origin ACS 2023
- Neighborhood character
- Predominantly White (75%)
- Race & ethnicity
- White 75% Asian 11% Two or more races 6% Black 5% Hispanic / Latino 4%
- Common ancestry
- Romanian 4% Italian 3% Slovak 3%
- Foreign-born
- 15% · China, Canada, South Korea
- Languages at home
- 83% English-only · Other Indo-European 5% Spanish 2% Chinese 2%
Political lean MEDSL · Franklin
- 2024 margin
- Strong D (+28.4) · D 63.7% · R 35.3% · Other 1.0%
- 2008→2024 swing
- +7.7pp toward D · 2008: 20.7pp · 2024: 28.4pp
- All cycles
- 2024: D+28.4 2020: D+31.4 2016: D+25.9 2012: D+21.7 2008: D+20.7
Not yet ingested
- Civics
- —
Market trends
- HPI YoY
- ▼ -513.39%
- Current HPI
- 245.448
- Rent YoY
- ▲ 0.59%
- Metro
- Columbus, OH
- State GDP YoY
- ▲ 1.98%
- F500 in state
- 48
Industry mix (Fortune 500 HQ in OH)
| Industry | F500 HQs | Revenue |
|---|---|---|
| Insurance | 3 | $145B |
|
||
| Industrial Machinery | 3 | $49B |
|
||
| Financial Services | 3 | $24B |
|
||
| Consumer Goods | 2 | $93B |
|
||
| Aerospace / Defense | 2 | $47B |
|
||
| Utilities | 2 | $33B |
|
||
Price history
+328.6% since first listed5 events — show timeline
- 2026-05-29 Pending — CBRMLS
- 2026-04-28 Listed $150,000 CBRMLS
- 2013-01-24 Sold (Public Records) $26,000 Public Records
- 2002-07-11 Sold (Public Records) $85,000 Public Records
- 1998-01-06 Sold (Public Records) $35,000 Public Records
Property tax history
+9.4%/yrLatest (2024): $5,435 · -1.5% YoY. Source: county tax records.
Cash-flow waterfall
monthlySold comps — $/sqft
last 12 mo · ≤1 miLoading sold comps…