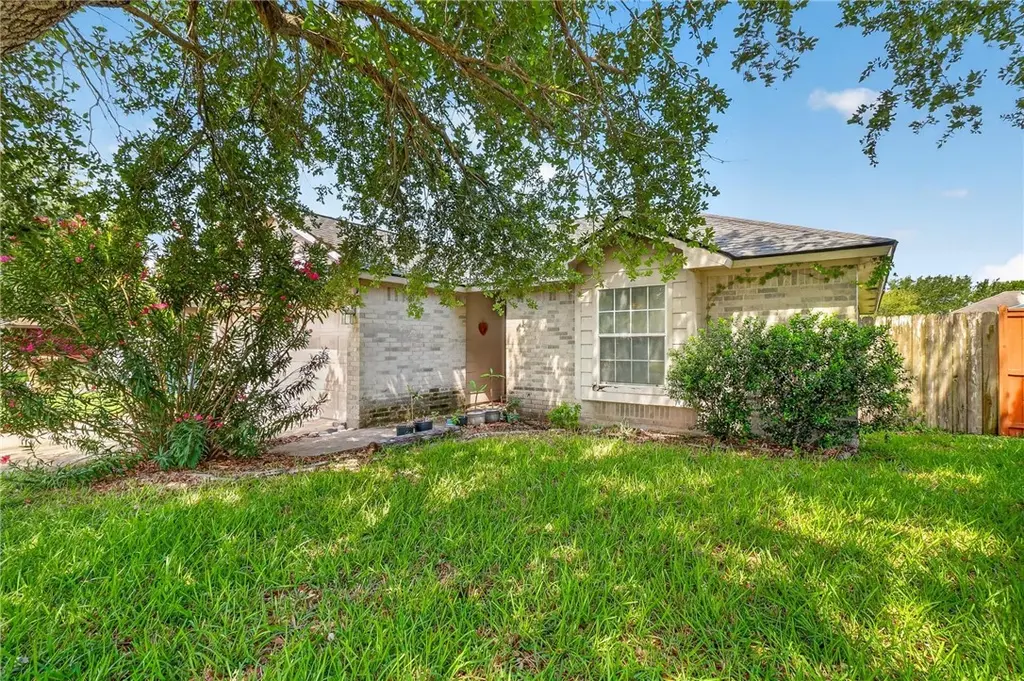
3017 Whistler Dr · Corpus Christi, TX
Flood risk 4/10 · Minor
- FEMA flood zone
- X (unshaded)
- Chance of flooding over 30 yrs
- 0.13%
- Est. flood insurance / yr
- $507 – $1,088
Fire risk 4/10 · Minor
- Est. fire insurance / yr
- $1,222 – $2,270
Heat risk 10/10 · Severe
- Hot days now (above 108°F)
- 7 days/yr
- Hot days in 30 yrs
- 27 days/yr
Wind risk 9/10 · Severe
- Chance of severe wind over 30 yrs
- 99.0%
Air-quality risk 1/10 · Minimal
- Unhealthy air days now
- 0 days/yr
- Unhealthy air days in 30 yrs
- 0 days/yr
Risk factors via First Street. Map © Google.
Why this score? — see what drove the C+ grade
The composite is a weighted blend of 9 inputs, each scored 0–100. Each bar is that input's sub-score; the figure is the points it added to the 100-point composite (weight × sub-score).
- Cash flow +20.4/30.0
- ARV discount +15.0/15.0
- 1% rule +6.6/10.0
- DSCR +6.5/10.0
- Livability +3.9/5.0
- Rent growth +3.0/5.0
- Schools +2.8/10.0
- Condition / age +2.5/5.0
- Appreciation +0.0/10.0
$165,000
🖨 Deal sheet (PDF) 📄 Offer letter ✓ Due diligence
Listing remarks MLS
Beautiful house in Victoria Park with large backyard for kids. House has open patio and hard wood floors in living room and kitchen. Must come and see to appreciate.
Key facts
- Spacious backyard
- Convenient access
- Solid layout
Tags
Property features AI
Finance
- HOA & community: Short term rentals allowed
Exterior
- Parking: Attached front-entry garage; 2 covered garage spaces
- Security: Smoke detector(s)
- Utilities: Public water; Public sewer; Sewer available; Water available
- Home design: Single-story; Brick construction; Shingle roof; Slab foundation
- Exterior features: Open patio; Wood fencing; Interior lot
Interior
- Kitchen: Dishwasher; Electric oven; Electric range; Garbage disposal
- Flooring: Carpet; Parquet
- Bathrooms: 2 full bathrooms
- Heating & cooling: Central heating (electric); Central air conditioning
- Interior features: Cable TV available; Ceiling fan(s)
- Laundry & utility: Washer hookup; Dryer hookup
Neighborhood map
What this means for you Summary
Snapshot
- This is a 3-bed/2.0-bath single-family listed at $165k.
Deal economics
- At list price, monthly cash flow is $215 ($3k/yr) — positive.
- The deal already cash-flows at list — no discount required.
- Meets the 1% rule at list price ($2k rent vs $165k).
- Cap rate 7.9% vs local median 3.6% in Corpus Christi — top-decile yield for the area; either an underpriced asset or a hidden risk that comps aren't pricing in. Stress-test before assuming the spread holds.
Location & tenants
- Location reads 78/100 on livability (#66 in TX, #2,404 nationally) — a middle-class / working-renter tenant base. Strengths: commute A+, cost of living A+, housing A+; Watch: crime F.
- Corpus Christi ISD (urban): math 31% / reading 35% proficiency, ranked #562 of 826 in TX (top 68%) — families likely to look elsewhere, expect single-tenant / working-renter base with shorter leases; 63% free/reduced lunch — lower-income household profile, screen leases tightly.
- Market conditions: Rents rising (+1.9%/yr); 610 active listings in the ZIP; 20 comparable units currently listed for rent nearby; rentals lingering (median 45d on market — plan ~5-8 weeks vacancy on turnover, expect pricing pressure); 60% of comp listings sitting > 30 days — soft ceiling on asking rent; solid renter incomes; 1,397 units permitted in Nueces County in 2024 (47 in 5+ unit buildings).
Forward outlook
- Local home prices are declining (-3.0%/yr); year-one equity from $1k of loan paydown is wiped out by about $5k of value loss. Plan a longer hold.
- Nueces County population projected at +36% by 2050 — long-run rental-demand tailwind backs the buy-and-hold thesis.
Negotiation context
- Only 2 days on market — expect competitive offers; lowballing is unlikely to land.
- 2 sale attempts since 18y ago with the ask held roughly flat each time — persistent listings suggest the price (not the market) is what's stuck; bring a comps-based counter.
- Current owner paid $64k; list at $165k implies a 159% gain — meaningful room to come down on a strong offer.
Risks & watch-outs
- Watch-outs: property tax is 2.6% of price.
- Climate carrying-cost: severe wind risk, 99% chance of damaging wind over 30y; extreme-heat days projected 7→27/yr by 2055 (HVAC capex compounding) — expect insurance premiums to compound above CPI over the hold.
Questions for the listing agent
- Property tax is high relative to price — has the assessment been appealed recently, and will the sale trigger a re-assessment?
- Is there a deadline driving the sale (1031 exchange, divorce, estate, relocation)? That informs how much negotiation room exists.
- Crime grade is F in this area — have there been break-ins, vandalism, or insurance claims at this property in the last 3 years? What carrier currently insures it and at what premium?
- What's the average days-on-market for RENTAL listings here right now (not sales)? A rising rental-DOM trend means longer vacancies and softer asking-rent achievability than the comps imply.
- What's the recent tenant-quality profile in this submarket — average credit score on applications, eviction rate, late-payment / NSF rate, and stable-employment percentage? A property-management company in the area should have these aggregated.
- How much new for-sale + rental construction is in the pipeline within 1–3 miles? Heavy new supply typically softens prices + rents 12–24 months out; constrained supply supports both.
Investment metrics
- 1% rule
- 1.16% ✓
- Cap rate
- 7.86%
- Cash-on-cash
- 5.60%
- DSCR
- 1.25
- GRM
- 7.2
CMA / ARV
- ARV (on-the-fly)
- $207,390
- Comps found
- 12
Show comp detail 12 sales within ~0.75 mi
| Address | Dist | Beds/Ba | Sqft | Sold | Price | $/sf | Match |
|---|---|---|---|---|---|---|---|
| 7910 Labrador Dr | 0.15mi | 3/2.0 | 1,144 (+3%) | 18mo | $234,900 | $205 | 74 |
| 3201 Keltic Dr | 0.13mi | 3/2.0 | 1,243 (+12%) | 3mo | $228,000 | $183 | 72 |
| 3021 Manitoulin Island Dr | 0.05mi | 3/2.0 | 1,223 (+10%) | 12mo | $219,900 | $180 | 72 |
| 3101 Saskatchewan Dr | 0.11mi | 3/2.0 | 1,222 (+10%) | 10mo | $199,900 | $164 | 71 |
| 3105 Whistler Dr | 0.05mi | 3/2.0 | 1,281 (+15%) | 8mo | $219,900 | $172 | 66 |
| 3033 Manitoulin Island Dr | 0.06mi | 3/2.0 | 1,256 (+13%) | 14mo | $239,000 | $190 | 65 |
| 7834 Calgary Dr | 0.09mi | 3/2.0 | 1,275 (+14%) | 13mo | $239,950 | $188 | 61 |
| 2321 Blue Star Dr | 0.69mi | 3/2.0 | 1,170 (+5%) | 4mo | $185,000 | $158 | 56 |
| 7473 Star Harbor Dr | 0.74mi | 3/2.0 | 1,154 (+4%) | 6mo | $225,000 | $195 | 55 |
| 7490 Star Harbor Dr | 0.74mi | 3/2.0 | 1,270 (+14%) | 8mo | $245,000 | $193 | 36 |
| 3045 Chapel Creek Dr | 0.60mi | 3/2.0 | 1,233 (+11%) | 22mo | $224,999 | $182 | 36 |
| 2314 White Star | 0.66mi | 3/2.0 | 1,237 (+11%) | 22mo | $230,000 | $186 | 32 |
Match score weights: distance 35% · size 25% · config 20% · recency 20%. Top-matched comps best support the ARV.
Projected returns pro-forma
-3.0% appreciation · 1.94% rent growth · sell at horizon
- IRR
- -8.9%
- Equity multiple
- 0.68×
- Total profit
- $-14,910
- Equity at exit
- $24,602
- IRR
- -1.0%
- Equity multiple
- 0.94×
- Total profit
- $-2,914
- Equity at exit
- $14,266
Cash invested: $46,200 (down + closing). Projections, not guarantees.
Landlord ↔ Tenant lean methodology
- Overall (STATE)
- 87 Strongly Landlord-Friendly
- State Texas
- 87 Strongly Landlord-Friendly · R+5
- County
- — inherits STATE
- City
- — inherits STATE
ZIP-level market 78414
- Home prices YoY
- -18.1%
- Rents YoY
- 1.9%
- Active inventory
- 610
- Price-to-rent
- 7.2×
Monthly cashflow live
- Estimated rent
- $1,910 high interval (Pro) →
- Mortgage (P&I)
- −$865
- Tax from tax record
- −$359 /mo · $4,309/yr
- Insurance
- −$69
- HOA
- −$0
- Vacancy / Maint / Mgmt
- −$401
- Net cashflow
- $215
Break-even live
Sensitivity live
| Price | -10% $309 | -5% $262 | +0% $215 | +5% $169 | +10% $122 |
|---|---|---|---|---|---|
| Rent | -10% $65 | -5% $140 | +0% $215 | +5% $291 | +10% $366 |
| Rate | -1.0pp $299 | -0.5pp $257 | base $215 | +0.5pp $173 | +1.0pp $129 |
UW: 25.0% down · 7.5% · 30yr · 1.5% tax · 5.0% vac · 8.0% maint · 8.0% mgmt
Financing live
Cash to close
- Down payment
- $41,250
- Closing costs
- $4,950
- Reserves months
- —
- Total cash needed
- —
Loan-product check · same deal, 3 products live
Conventional
25% down · 7.5% · 30yr
- Down + closing
- —
- Monthly P&I
- —
- Monthly cashflow
- —
- DSCR
- —
- Eligible?
- —
Personal DTI + credit; lowest rate.
DSCR
20% down · 8.5% · 30yr
- Down + closing
- —
- Monthly P&I
- —
- Monthly cashflow
- —
- DSCR
- —
- Eligible?
- —
No personal income docs; deal must DSCR.
Hard money
10% down · 12.0% · 12mo
- Down + closing
- —
- Monthly P&I
- —
- Monthly cashflow
- —
- DSCR
- —
- Eligible?
- —
Short-term bridge; refi at stabilization.
Rent comps 20 comps
| Address | Beds | Baths | Sqft | Rent | $/sqft | DOM | Units | Dist |
|---|---|---|---|---|---|---|---|---|
| 3009 Las Brisas St Corpus Christi, TX | 3.0 | 2.0 | 1487 | $2,000 | $1.34 | 14d | 1 | 0.20mi |
| 2842 Quebec Dr Corpus Christi, TX | 3.0 | 2.0 | 1453 | $2,200 | $1.51 | 44d | 1 | 0.27mi |
| 7510 Wooldridge Rd Corpus Christi, TX | 1.0–3.0 | 1.0–2.0 | 1148 | $2,335 | $2.03 | 44d | 1 | 0.61mi |
| 7252 The Mansions Dr Unit G4 Corpus Christi, TX | 2.0 | 2.0 | 1200 | $1,450 | $1.21 | 14d | 1 | 0.65mi |
| 7252 The Mansions Dr Unit H2 Corpus Christi, TX | 3.0 | 2.0 | 1479 | $1,850 | $1.25 | 44d | 1 | 0.65mi |
| 8033 Cormorant Dr Corpus Christi, TX | 3.0 | 2.0 | 1199 | $2,100 | $1.75 | 14d | 1 | 0.70mi |
| 7252 Mansions Dr Corpus Christi, TX | 2.0 | 2.0 | 1200 | $1,500 | $1.25 | 44d | 1 | 0.70mi |
| 7252 Mansions Dr Unit D3 Corpus Christi, TX | 2.0 | 2.0 | 1057 | $1,600 | $1.51 | 44d | 1 | 0.71mi |
| 2230 Spoonbill Dr Corpus Christi, TX | 3.0 | 2.0 | 1364 | $2,000 | $1.47 | 44d | 1 | 0.73mi |
| 7202 Mansions Dr Unit J3 1 Corpus Christi, TX | 2.0 | 2.0 | 1057 | $1,695 | $1.60 | 44d | 1 | 0.83mi |
| 3310 Rodd Field Rd Corpus Christi, TX | 1.0–2.0 | 1.0–2.0 | 847 | $1,629 | $1.92 | 14d | 35 | 0.98mi |
| 7430 Cessna Dr Corpus Christi, TX | 3.0 | 2.0 | 1370 | $2,000 | $1.46 | 44d | 1 | 1.05mi |
| 2805 Summer Ridge Dr Corpus Christi, TX | 3.0 | 2.0 | 1420 | $1,800 | $1.27 | 44d | 1 | 1.05mi |
| 1966 Ennis Joslin Rd Corpus Christi, TX | 2.0 | 2.0 | 986 | $1,767 | $1.79 | 14d | 53 | 1.11mi |
| 8206 Vetters Dr Corpus Christi, TX | 2.0 | 1.0 | 780 | $1,450 | $1.86 | 14d | 1 | 1.28mi |
| 1818 Rodd Field Rd Unit B2 Corpus Christi, TX | 2.0 | 2.0 | 1200 | $1,850 | $1.54 | 14d | 1 | 1.28mi |
| 2706 Grace Cir Unit B Corpus Christi, TX | 3.0 | 2.0 | 1369 | $2,095 | $1.53 | 22d | 1 | 1.29mi |
| 1901 Rodd Field Rd Unit 144 Corpus Christi, TX | 2.0 | 1.0 | 813 | $999 | $1.23 | 44d | 1 | 1.36mi |
| 1750 Merriman Ave Corpus Christi, TX | 2.0 | 1.0 | 795 | $799 | $1.01 | 44d | 3 | 1.38mi |
| 2921 Airline Rd Corpus Christi, TX | 1.0–2.0 | 1.0–2.0 | 982 | $1,664 | $1.69 | 44d | 1 | 1.48mi |
Listing history 3 events
-
2026-06-05statusdays on market $165,000 Pending 2 DOM
-
2026-06-03remarks 552-char remark
-
2026-06-03$165,000 Active 1 DOM
ⓘ Source: listings_history table (triggers on properties + properties_extension) + one-shot
backfill from property_details.listing_events for pre-trigger history.
Tax reassessment forecast TX · Resets to sale price
- Current annual tax
- $4,309 · $359/mo
- Projected year-2 tax
- $4,309 · $359/mo
- Expected delta
- $0/yr ($0/mo · 0.0%)
ⓘ Screening estimate from a state-policy table — verify with the county assessor before closing.
Climate risk First Street
- Flood 4/10 Moderate FEMA zone X (unshaded) · 13% chance over 30 yrs
- Wildfire 4/10 Moderate
- Heat 10/10 Extreme 7 d/yr ≥108°F today · 27 d/yr by 30 yrs out
- Wind 9/10 Extreme 99% chance of damaging wind over 30 yrs
- Air quality 1/10 Low 0 unhealthy d/yr today · 0 by 30 yrs out
Nearby sold comps map
Loading sold comps map…
Walkable amenities ~0.75 mi
Loading nearby amenities…
Taxation est. · year 1
- Rental income
- $22,915
- − Mortgage interest
- −$9,243
- − Property taxes
- −$4,309
- − Insurance
- −$825
- − Repairs & maintenance
- −$1,833
- − Management
- −$1,833
- − Depreciation
- −$4,800
- Taxable income
- $71
- Est. tax owed @ 24.0%
- −$17
- After-tax cash flow
- $2,568/yr
For passive investors: Depreciation is non-cash, so a rental often shows a tax loss while cash-flowing — sheltering income. Rental losses are passive: they offset passive income freely, and up to $25,000/yr can offset ordinary (W-2) income if you actively participate and your MAGI is under $100k (phasing out to $0 by $150k); unused losses carry forward. On sale, claimed depreciation is recaptured at up to 25%, and gains may owe capital-gains tax (a 1031 exchange can defer both). Figures are a year-1 estimate at your 24.0% rate — not tax advice; consult a CPA.
Schools (NCES district)
- District
- Corpus Christi ISD
- NCES district ID
- 4815270
- Math proficiency
- 31% ▼ -18.00%
- Reading proficiency
- 35% ▼ -7.00%
- Median HH income
- $45,672
- Composite
- 28.27/100
- National rank
- #6793
- State rank
- #562 of 826 in TX
Livability — Corpus Christi
- Score
- 78/100
- State rank
- #66
- US rank
- #2404
Category grades
Schools grade is shown separately in the Schools card above.
Census & demographics
- Census place
- Corpus Christi, TX
- County
- Nueces County · 296,836 people
- City population
- 296,836
- Metro
- Corpus Christi, TX
- Population (ZIP)
- 54,263
- Household income
- $98,771
- Rent vs Own
- Severe rent burden
- 1167.0
Population outlook (Nueces County) Hauer SSP2
- Today (2025)
- 418,037 people
- By 2030
- 447,123 · +7.0%
- By 2040
- 505,911 · +21.0%
- By 2050
- 567,522 · +35.8%
- By 2075
- 729,686 · +74.6%
- By 2100
- 847,087 · +102.6%
Race, ethnicity, and origin ACS 2023
- Neighborhood character
- Diverse neighborhood (Simpson 0.60)
- Race & ethnicity
- Hispanic / Latino 52% White 35% Two or more races 33% Asian 6% Black 3%
- Hispanic origin (detail)
- Mexican 46% Puerto Rican 1%
- Common ancestry
- Lithuanian 1% Slovak 1% Romanian 1%
- Foreign-born
- 9% · Canada, China, South Korea
- Languages at home
- 70% English-only · Spanish 24% Other Indo-European 2% Chinese 1%
Political lean MEDSL · Nueces
- 2024 margin
- R (+11.5) · D 43.8% · R 55.3%
- 2008→2024 swing
- -7.1pp toward R · 2008: -4.4pp · 2024: -11.5pp
- All cycles
- 2024: R+11.5 2020: R+2.9 2016: R+1.5 2012: R+3.2 2008: R+4.4
Not yet ingested
- Civics
- —
Market trends
- HPI YoY
- ▼ -40.16%
- Current HPI
- 182.3229
- Rent YoY
- ▲ 1.94%
- Metro
- Corpus Christi, TX
- State GDP YoY
- ▲ 3.95%
- F500 in state
- 110
Industry mix (Fortune 500 HQ in TX)
| Industry | F500 HQs | Revenue |
|---|---|---|
| Energy | 16 | $1,198B |
|
||
| Technology | 5 | $198B |
|
||
| Engineering / Construction | 4 | $72B |
|
||
| Energy Services | 3 | $60B |
|
||
| Utilities | 3 | $41B |
|
||
| Healthcare | 2 | $330B |
|
||
Price history
+159.3% since first listed5 events — show timeline
- 2026-06-01 Listed $165,000 CBMLS
- 2008-06-26 Sold (Public Records) — Public Records
- 2008-06-25 Sold (MLS) — CBMLS
- 2008-01-03 Listed $119,999 CBMLS
- 2001-12-26 Sold (Public Records) $63,640 Public Records
Property tax history
+3.9%/yrLatest (2025): $4,309 · +1.6% YoY. Source: county tax records.
Cash-flow waterfall
monthlySold comps — $/sqft
last 12 mo · ≤1 miLoading sold comps…