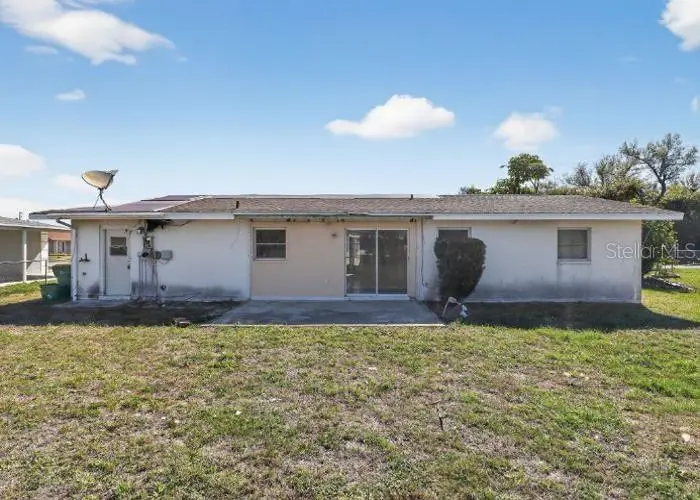
462 Ridgewood St NW · Port Charlotte, FL
Flood risk 9/10 · Severe
- FEMA flood zone
- AE
- Chance of flooding over 30 yrs
- 0.99%
- Est. flood insurance / yr
- $1,737 – $8,500
Fire risk 1/10 · Minimal
- Est. fire insurance / yr
- $947 – $1,759
Heat risk 10/10 · Severe
- Hot days now (above 107°F)
- 7 days/yr
- Hot days in 30 yrs
- 28 days/yr
Wind risk 10/10 · Severe
- Chance of severe wind over 30 yrs
- 99.0%
Air-quality risk 3/10 · Minor
- Unhealthy air days now
- 2 days/yr
- Unhealthy air days in 30 yrs
- 2 days/yr
Risk factors via First Street. Map © Google.
Why this score? — see what drove the B+ grade
The composite is a weighted blend of 9 inputs, each scored 0–100. Each bar is that input's sub-score; the figure is the points it added to the 100-point composite (weight × sub-score).
- Cash flow +30.0/30.0
- ARV discount +15.0/15.0
- DSCR +10.0/10.0
- 1% rule +9.8/10.0
- Schools +4.6/10.0
- Livability +3.2/5.0
- Condition / age +2.5/5.0
- Rent growth +2.2/5.0
- Appreciation +0.0/10.0
$113,300
🖨 Deal sheet (PDF) 📄 Offer letter ✓ Due diligence
Listing remarks
Under contract-accepting backup offers. Auction Property. AUCTION. This fixer upper will require your updates and features 2 beds, 2 baths, and sits on a large lot with an attached lanai. Home will need repairs to include roof, ceiling, HVAC and other cosmetic updates. Foundation issues reported - will need inspection and repairs. Property is sold as-is with NO property disclosure or inspection reports. Make this one your next project.
Key facts
- 0.23 acre lot
- Built 1973
- Listed 35 days
Property features AI
Finance
- Other: Unfurnished; No home warranty; Property type: Residential — Single Family Residence; Zoning: Residential
- Financial info: No investor or rental income details listed
- HOA & community: No HOA
Exterior
- Parking: No parking details listed
- Security: No security features listed
- Utilities: Public water; Public sewer; Electricity available; Natural gas available
- Home design: Single-family residence; One story; Northwest facing entry
- Construction: Block and concrete construction; Shingle roof; Slab foundation; Built area approximately 1,040 square feet
- Exterior features: Lot about 0.22 acres; Road surface: Other; No waterfront or water access
Interior
- Kitchen: No appliances listed
- Bedrooms: 2 bedrooms
- Flooring: Other flooring
- Bathrooms: 2 full bathrooms
- Heating & cooling: Other heating; Central air conditioning
- Interior features: No interior features listed
- Laundry & utility: Laundry features: Other
Neighborhood map
What this means for you Summary
Snapshot
- This is a 2-bed/2.0-bath single-family listed at $113k.
Deal economics
- At list price, monthly cash flow is $126 ($2k/yr) — positive.
- The deal already cash-flows at list — no discount required.
- Meets the 1% rule at list price ($2k rent vs $113k).
- Recommended offer: $110k (3.0% below list) — sets the bar for market timing.
- Cap rate 12.1% vs local median 4.4% in Port Charlotte — top-decile yield for the area; either an underpriced asset or a hidden risk that comps aren't pricing in. Stress-test before assuming the spread holds.
Location & tenants
- Location reads 65/100 on livability (#655 in FL) — a middle-class / working-renter tenant base. Strengths: cost of living A+, housing A+; Watch: schools D+, employment D, amenities F.
- Charlotte (suburban): math 54% / reading 54% proficiency, ranked #22 of 73 in FL (top 30%) — acceptable for families but not a draw, mixed tenant base, ~2y average lease.
- Market conditions: Rents soft (-1.4%/yr); 707 active listings in the ZIP; 40 comparable units currently listed for rent nearby; rentals at typical pace (median 22d on market — plan ~3-4 weeks tenant-placement turnaround); 4,585 units permitted in Charlotte County in 2024 (703 in 5+ unit buildings).
- This rent runs 33% of the median local income ($61k/yr) — at the standard rent-burdened threshold; future hikes will face affordability resistance.
Forward outlook
- Local home prices are declining (-3.0%/yr); year-one equity from $783 of loan paydown is wiped out by about $3k of value loss. Plan a longer hold.
- Charlotte County population projected at +24% by 2050 — long-run rental-demand tailwind backs the buy-and-hold thesis.
Negotiation context
- It's been on market 35 days — a 3% lower offer ($110k) is reasonable based on typical stale-listing flexibility.
Risks & watch-outs
- Watch-outs: flood insurance adds $427/mo.
- Climate carrying-cost: in FEMA flood zone AE (mandatory federal flood insurance); severe wind risk, 99% chance of damaging wind over 30y; extreme-heat days projected 7→28/yr by 2055 (HVAC capex compounding) — expect insurance premiums to compound above CPI over the hold.
Questions for the listing agent
- It's been on market 35 days. Have you received any prior offers? Is the seller open to a 3% concession, seller financing, or rate buy-down credit?
- Built in 1973 — when were the roof, HVAC, electrical panel, plumbing, and water heater last replaced?
- What's the actual annual flood-insurance premium (NFIP or private), and is the property in a SFHA with mandatory coverage?
- Is there a deadline driving the sale (1031 exchange, divorce, estate, relocation)? That informs how much negotiation room exists.
- Schools are D-rated, which usually means shorter tenancies and higher turnover. Who's the typical renter profile here, and what's been the actual vacancy rate?
- What's the average days-on-market for RENTAL listings here right now (not sales)? A rising rental-DOM trend means longer vacancies and softer asking-rent achievability than the comps imply.
- What's the recent tenant-quality profile in this submarket — average credit score on applications, eviction rate, late-payment / NSF rate, and stable-employment percentage? A property-management company in the area should have these aggregated.
- How much new for-sale + rental construction is in the pipeline within 1–3 miles? Heavy new supply typically softens prices + rents 12–24 months out; constrained supply supports both.
Investment metrics
- 1% rule
- 1.48% ✓
- Cap rate
- 12.15%
- Cash-on-cash
- 20.91%
- DSCR
- 1.93
- GRM
- 5.6
CMA / ARV
- ARV (on-the-fly)
- $184,080
- Comps found
- 12
Show comp detail 12 sales within ~0.75 mi
| Address | Dist | Beds/Ba | Sqft | Sold | Price | $/sf | Match |
|---|---|---|---|---|---|---|---|
| 525 Azalea Dr NW | 0.20mi | 2/2.0 | 1,066 (+2%) | 4mo | $170,000 | $159 | 83 |
| 130 Adams Ct NW | 0.51mi | 2/2.0 | 1,050 (+1%) | 3mo | $300,000 | $286 | 72 |
| 517 Reading St | 0.12mi | 2/2.0 | 936 (-10%) | 8mo | $135,000 | $144 | 71 |
| 3120 Pinetree St | 0.13mi | 2/2.0 | 1,154 (+11%) | 9mo | $159,000 | $138 | 68 |
| 635 W Tarpon Blvd NW | 0.46mi | 2/2.0 | 1,048 (+1%) | 12mo | $185,000 | $177 | 68 |
| 417 Cypress Ave NW | 0.22mi | 2/2.0 | 1,162 (+12%) | 14mo | $130,000 | $112 | 58 |
| 2505 Elkcam Blvd | 0.55mi | 3/2.0 (+1) | 988 (-5%) | 4mo | $50,000 | $51 | 58 |
| 526 Azalea Ave NW | 0.52mi | 2/2.0 | 968 (-7%) | 9mo | $190,000 | $196 | 57 |
| 509 Beal St NW | 0.41mi | 2/2.0 | 1,169 (+12%) | 13mo | $225,000 | $192 | 49 |
| 2562 Lakeshore Cir | 0.59mi | 3/2.0 (+1) | 1,094 (+5%) | 18mo | $246,500 | $225 | 44 |
| 2546 Ambrose Ln | 0.63mi | 3/1.0 (+1) | 1,050 (+1%) | 20mo | $225,000 | $214 | 44 |
| 2392 Elkcam Blvd | 0.74mi | 3/2.0 (+1) | 972 (-6%) | 18mo | $80,000 | $82 | 34 |
Match score weights: distance 35% · size 25% · config 20% · recency 20%. Top-matched comps best support the ARV.
Projected returns pro-forma
-3.0% appreciation · 0.0% rent growth · sell at horizon
- IRR
- -13.7%
- Equity multiple
- 0.53×
- Total profit
- $-14,945
- Equity at exit
- $16,893
- IRR
- -14.0%
- Equity multiple
- 0.35×
- Total profit
- $-20,477
- Equity at exit
- $9,796
Cash invested: $31,724 (down + closing). Projections, not guarantees.
Landlord ↔ Tenant lean methodology
- Overall (STATE)
- 87 Strongly Landlord-Friendly
- State Florida
- 87 Strongly Landlord-Friendly · R+3
- County
- — inherits STATE
- City
- — inherits STATE
ZIP-level market 33952
- Home prices YoY
- -4.8%
- Rents YoY
- -1.4%
- Active inventory
- 707
- Price-to-rent
- 5.6×
Monthly cashflow live
- Estimated rent
- $1,673 high interval (Pro) →
- Mortgage (P&I)
- −$594
- Tax from tax record
- −$127 /mo · $1,527/yr
- Insurance
- −$47
- Flood insurance flood zone
- −$427 /mo · $5,118/yr
- HOA
- −$0
- Vacancy / Maint / Mgmt
- −$351
- Net cashflow
- $126
Break-even live
Sensitivity live
| Price | -10% $190 | -5% $158 | +0% $126 | +5% $94 | +10% $62 |
|---|---|---|---|---|---|
| Rent | -10% $-6 | -5% $60 | +0% $126 | +5% $192 | +10% $258 |
| Rate | -1.0pp $183 | -0.5pp $155 | base $126 | +0.5pp $97 | +1.0pp $67 |
UW: 25.0% down · 7.5% · 30yr · 1.5% tax · 5.0% vac · 8.0% maint · 8.0% mgmt
Financing live
Cash to close
- Down payment
- $28,325
- Closing costs
- $3,399
- Reserves months
- —
- Total cash needed
- —
Loan-product check · same deal, 3 products live
Conventional
25% down · 7.5% · 30yr
- Down + closing
- —
- Monthly P&I
- —
- Monthly cashflow
- —
- DSCR
- —
- Eligible?
- —
Personal DTI + credit; lowest rate.
DSCR
20% down · 8.5% · 30yr
- Down + closing
- —
- Monthly P&I
- —
- Monthly cashflow
- —
- DSCR
- —
- Eligible?
- —
No personal income docs; deal must DSCR.
Hard money
10% down · 12.0% · 12mo
- Down + closing
- —
- Monthly P&I
- —
- Monthly cashflow
- —
- DSCR
- —
- Eligible?
- —
Short-term bridge; refi at stabilization.
Rent comps 40 comps
| Address | Beds | Baths | Sqft | Rent | $/sqft | DOM | Units | Dist |
|---|---|---|---|---|---|---|---|---|
| 401 Skylark Ln NW Port Charlotte, FL | 3.0 | 2.0 | 1167 | $1,650 | $1.41 | 22d | 1 | 0.15mi |
| 164 Tradewinds Dr NW Port Charlotte, FL | 2.0 | 1.0 | 750 | $1,350 | $1.80 | 22d | 1 | 0.30mi |
| 394 Ferris Dr NW Port Charlotte, FL | 3.0 | 2.0 | 842 | $1,395 | $1.66 | 22d | 1 | 0.32mi |
| 266 Rockwood St NW Port Charlotte, FL | 3.0 | 2.0 | 1400 | $1,850 | $1.32 | 14d | 1 | 0.34mi |
| 249 Seminole Blvd NW Port Charlotte, FL | 3.0 | 2.0 | 1389 | $1,750 | $1.26 | 22d | 1 | 0.38mi |
| 533 Crandall St NW Port Charlotte, FL | 3.0 | 2.0 | 1328 | $1,550 | $1.17 | 22d | 1 | 0.48mi |
| 2472 Picnic St Port Charlotte, FL | 2.0 | 2.0 | 990 | $1,575 | $1.59 | 22d | 1 | 0.53mi |
| 3006 Caring Way Port Charlotte, FL | 2.0 | 2.0 | 783 | $2,050 | $2.62 | 14d | 2 | 0.60mi |
| 3006 Caring Way Port Charlotte, FL | 1.0–2.0 | 1.0–2.0 | 708 | $2,500 | $3.53 | 22d | 3 | 0.60mi |
| 182 Chelsea Ct NW Port Charlotte, FL | 2.0 | 2.0 | 1389 | $2,200 | $1.58 | 22d | 1 | 0.60mi |
| 125 Cambridge Dr NW Unit NA Port Charlotte, FL | 2.0 | 1.0 | 1200 | $1,750 | $1.46 | 22d | 1 | 0.65mi |
| 2456 Elkcam Blvd Port Charlotte, FL | 2.0 | 2.0 | 1015 | $1,700 | $1.67 | 22d | 1 | 0.66mi |
| 2425 Caring Way Unit 205 Port Charlotte, FL | 2.0 | 2.0 | 900 | $1,400 | $1.56 | 22d | 1 | 0.68mi |
| 650 Hartford Dr NW Port Charlotte, FL | 2.0 | 2.0 | 1200 | $1,600 | $1.33 | 22d | 1 | 0.72mi |
| 20550 Edgewater Dr Port Charlotte, FL | 3.0 | 2.0 | 1176 | $1,900 | $1.62 | 22d | 1 | 0.77mi |
| 322 Lasayette Dr NE Port Charlotte, FL | 2.0 | 1.5 | 1140 | $1,475 | $1.29 | 22d | 1 | 0.78mi |
| 2300 Aaron St #114 Port Charlotte, FL | 2.0 | 2.0 | 869 | $1,250 | $1.44 | 22d | 1 | 0.78mi |
| 2395 Alda Ln Port Charlotte, FL | 2.0 | 2.0 | 1150 | $1,775 | $1.54 | 22d | 1 | 0.82mi |
| 3100 Harbor Blvd Port Charlotte, FL | 2.0 | 1.0–1.5 | 994 | $1,472 | $1.48 | 22d | 2 | 0.90mi |
| 21088 Edgewater Dr Port Charlotte, FL | 3.0 | 2.0 | 1346 | $3,000 | $2.23 | 14d | 1 | 0.91mi |
| 3126 Harbor Blvd Unit 3A Port Charlotte, FL | 2.0 | 2.0 | 1100 | $1,500 | $1.36 | 14d | 1 | 0.92mi |
| 21405 Olean Blvd Port Charlotte, FL | 1.0–2.0 | 1.0–2.0 | 708 | $1,445 | $2.04 | 22d | 2 | 0.93mi |
| 3602 Harbor Blvd Port Charlotte, FL | 2.0 | 2.0 | 1292 | $1,700 | $1.32 | 22d | 1 | 0.94mi |
| 342 Millport St NW Port Charlotte, FL | 3.0 | 2.0 | 1331 | $2,250 | $1.69 | 22d | 1 | 0.94mi |
| 334 Millport St NW Port Charlotte, FL | 3.0 | 2.0 | 1459 | $2,400 | $1.64 | 22d | 1 | 0.94mi |
| 326 Millport St NW Port Charlotte, FL | 3.0 | 2.0 | 1459 | $2,400 | $1.64 | 22d | 1 | 0.95mi |
| 21307 Gertrude Ave Port Charlotte, FL | 2.0 | 3.0 | 1170 | $1,650 | $1.41 | 22d | 1 | 0.96mi |
| 651 Chamber St NW Port Charlotte, FL | 3.0 | 2.0 | 1196 | $1,900 | $1.59 | 22d | 1 | 1.01mi |
| 21422 Kenyon Ave Port Charlotte, FL | 2.0 | 2.0 | 1149 | $1,400 | $1.22 | 22d | 1 | 1.05mi |
| 21440 Mallory Ave Port Charlotte, FL | 2.0 | 1.0 | 930 | $1,550 | $1.67 | 22d | 1 | 1.06mi |
| 525 Altoona St NW Port Charlotte, FL | 2.0 | 2.0 | 1002 | $1,750 | $1.75 | 22d | 1 | 1.08mi |
| 21322 Stillwater Ave Port Charlotte, FL | 2.0 | 1.0 | 1080 | $1,300 | $1.20 | 22d | 1 | 1.08mi |
| 21026 Glendale Ave Port Charlotte, FL | 2.0 | 1.0 | 812 | $1,400 | $1.72 | 22d | 1 | 1.12mi |
| 21155 Meehan Ave Port Charlotte, FL | 3.0 | 1.0 | 1060 | $1,300 | $1.23 | 22d | 1 | 1.13mi |
| 21061 Midway Blvd Port Charlotte, FL | 2.0 | 1.0 | 897 | $1,600 | $1.78 | 22d | 1 | 1.16mi |
| 3108 Whiting Ln Port Charlotte, FL | 2.0 | 1.0 | 828 | $1,350 | $1.63 | 22d | 1 | 1.20mi |
| 3281 Easy St Port Charlotte, FL | 3.0 | 2.0 | 1196 | $1,750 | $1.46 | 14d | 1 | 1.21mi |
| 21385 Gibralter Dr Port Charlotte, FL | 2.0 | 2.0 | 1172 | $1,650 | $1.41 | 22d | 1 | 1.23mi |
| 979 Roseway Ter NW Port Charlotte, FL | 3.0 | 1.5 | 1140 | $1,525 | $1.34 | 22d | 1 | 1.25mi |
| 979 Roseway Ter NW Unit 979 Port Charlotte, FL | 2.0 | 2.0 | 1140 | $1,750 | $1.54 | 22d | 1 | 1.25mi |
Listing history 3 events
-
2026-05-14status Pending
-
2026-04-29price $113,300
-
2026-04-08$121,900 Active
ⓘ Source: listings_history table (triggers on properties + properties_extension) + one-shot
backfill from property_details.listing_events for pre-trigger history.
Tax reassessment forecast FL · Resets to sale price
- Current annual tax
- $1,527 · $127/mo
- Projected year-2 tax
- $1,527 · $127/mo
- Expected delta
- $0/yr ($0/mo · 0.0%)
ⓘ Screening estimate from a state-policy table — verify with the county assessor before closing.
Climate risk First Street
- Flood 9/10 Extreme FEMA zone AE · 99% chance over 30 yrs
- Wildfire 1/10 Low
- Heat 10/10 Extreme 7 d/yr ≥107°F today · 28 d/yr by 30 yrs out
- Wind 10/10 Extreme 99% chance of damaging wind over 30 yrs
- Air quality 3/10 Moderate 2 unhealthy d/yr today · 2 by 30 yrs out
Nearby sold comps map
Loading sold comps map…
Walkable amenities ~0.75 mi
Loading nearby amenities…
Taxation est. · year 1
- Rental income
- $20,071
- − Mortgage interest
- −$6,347
- − Property taxes
- −$1,527
- − Insurance
- −$5,685
- − Repairs & maintenance
- −$1,606
- − Management
- −$1,606
- − Depreciation
- −$3,296
- Taxable income
- $5
- Est. tax owed @ 24.0%
- −$1
- After-tax cash flow
- $1,513/yr
For passive investors: Depreciation is non-cash, so a rental often shows a tax loss while cash-flowing — sheltering income. Rental losses are passive: they offset passive income freely, and up to $25,000/yr can offset ordinary (W-2) income if you actively participate and your MAGI is under $100k (phasing out to $0 by $150k); unused losses carry forward. On sale, claimed depreciation is recaptured at up to 25%, and gains may owe capital-gains tax (a 1031 exchange can defer both). Figures are a year-1 estimate at your 24.0% rate — not tax advice; consult a CPA.
Schools (NCES district)
- District
- Charlotte
- NCES district ID
- 1200240
- Math proficiency
- 54% ▼ -6.00%
- Reading proficiency
- 54% ▼ -1.00%
- Median HH income
- $44,864
- Composite
- 45.62/100
- National rank
- #2586
- State rank
- #22 of 73 in FL
Livability — Port Charlotte
- Score
- 65/100
- State rank
- #655
- US rank
- #13081
Category grades
Schools grade is shown separately in the Schools card above.
Census & demographics
- Census place
- Port Charlotte, FL
- County
- Charlotte County · 196,994 people
- City population
- 102,180
- Metro
- Punta Gorda, FL
- Population (ZIP)
- 35,231
- Household income
- $61,382
- Rent vs Own
- Severe rent burden
- 733.0
Population outlook (Charlotte County) Hauer SSP2
- Today (2025)
- 198,646 people
- By 2030
- 210,507 · +6.0%
- By 2040
- 230,857 · +16.2%
- By 2050
- 247,148 · +24.4%
- By 2075
- 281,777 · +41.8%
- By 2100
- 293,609 · +47.8%
Race, ethnicity, and origin ACS 2023
- Neighborhood character
- Predominantly White (76%)
- Race & ethnicity
- White 76% Hispanic / Latino 14% Two or more races 8% Black 6% Asian 2%
- Hispanic origin (detail)
- Mexican 2% Puerto Rican 3% Cuban 2%
- Common ancestry
- Lithuanian 2% Romanian 2% Italian 2%
- Foreign-born
- 12% · Canada, Vietnam
- Languages at home
- 85% English-only · Spanish 10% French/Haitian/Cajun 1% Russian/Polish/Slavic 1%
Political lean MEDSL · Charlotte
- 2024 margin
- Solid R (+34.0) · D 32.7% · R 66.7%
- 2008→2024 swing
- -26.7pp toward R · 2008: -7.2pp · 2024: -34.0pp
- All cycles
- 2024: R+34.0 2020: R+26.6 2016: R+27.8 2012: R+14.3 2008: R+7.2
Not yet ingested
- Civics
- —
Market trends
- HPI YoY
- ▼ -17.18%
- Current HPI
- 339.0932
- Rent YoY
- ▼ -1.35%
- Metro
- Punta Gorda, FL
- State GDP YoY
- ▲ 3.28%
- F500 in state
- 36
Industry mix (Fortune 500 HQ in FL)
| Industry | F500 HQs | Revenue |
|---|---|---|
| Industrial Technology | 2 | $29B |
|
||
| Insurance | 2 | $17B |
|
||
| Retail | 1 | $60B |
|
||
| Technology Distribution | 1 | $58B |
|
||
| Homebuilding | 1 | $35B |
|
||
| Technology Manufacturing | 1 | $35B |
|
||
Price history
-7.1% since first listed3 events — show timeline
- 2026-05-14 Pending — Stellar MLS as Distributed by MLS Grid
- 2026-04-29 Price Changed $113,300 Stellar MLS as Distributed by MLS Grid
- 2026-04-08 Listed $121,900 Stellar MLS as Distributed by MLS Grid
Property tax history
+2.1%/yrLatest (2025): $1,527 · +0.7% YoY. Source: county tax records.
Cash-flow waterfall
monthlySold comps — $/sqft
last 12 mo · ≤1 miLoading sold comps…