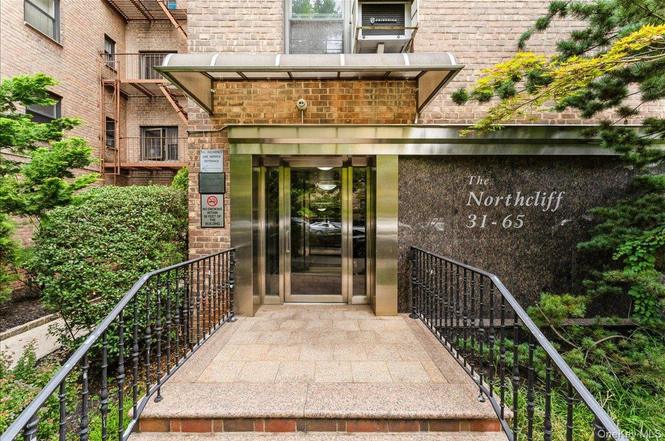
31-65 138th St Unit 1J · New York, NY
Flood risk 1/10 · Minimal
- FEMA flood zone
- X (shaded)
- Chance of flooding over 30 yrs
- 0.0%
- Est. flood insurance / yr
- $507 – $1,088
Fire risk 1/10 · Minimal
- Est. fire insurance / yr
- $691 – $1,283
Heat risk 6/10 · Moderate
- Hot days now (above 99°F)
- 7 days/yr
- Hot days in 30 yrs
- 15 days/yr
Wind risk 6/10 · Moderate
- Chance of severe wind over 30 yrs
- 27.0%
Air-quality risk 4/10 · Minor
- Unhealthy air days now
- 6 days/yr
- Unhealthy air days in 30 yrs
- 6 days/yr
Risk factors via First Street. Map © Google.
Why this score? — see what drove the C- grade
The composite is a weighted blend of 9 inputs, each scored 0–100. Each bar is that input's sub-score; the figure is the points it added to the 100-point composite (weight × sub-score).
- Cash flow +18.5/30.0
- ARV discount +7.5/15.0
- DSCR +5.8/10.0
- 1% rule +5.0/10.0
- Schools +5.0/10.0
- Livability +3.8/5.0
- Rent growth +3.2/5.0
- Condition / age +2.5/5.0
- Appreciation +0.0/10.0
$280,000
🖨 Deal sheet (PDF) 📄 Offer letter ✓ Due diligence
Listing remarks
Rare opportunity to own the largest one-bedroom layout in Linden Towers! This move-in ready J-line apartment features a sought-after eat-in kitchen with stainless steel appliances, updated flooring, a walk-in closet, and an expansive floor plan. Generous room sizes and a comfortable, functional layout provide exceptional space for everyday living and entertaining. Situated in a well-kept elevator building, residents benefit from landscaped grounds, on-site laundry, a live-in super, and available indoor/outdoor parking (short waitlist). The low monthly maintenance—which covers gas, electricity, heat, hot water, and property taxes—adds to the exceptional value. Ideally located in
Key facts
- Landscaped grounds
- Walk-in closet
- Expansive floor plan
Tags
Property features AI
Exterior
- Parking: Garage; Parking lot; Waitlist for parking
- Utilities: Public sewer; Cable available; Electricity connected; Natural gas connected; Water connected; Sewer connected
- Home design: Stock cooperative; Entry level: 1
- Construction: Brick construction
- Exterior features: Brick construction; Not waterfront
Interior
- Kitchen: Gas cooktop; Gas oven; Microwave; Refrigerator; Stainless steel appliances
- Bedrooms: 3 total rooms (includes one first-floor bedroom)
- Bathrooms: 1 full bathroom
- Heating & cooling: Oil heating; Steam heating; Wall/window air conditioning units
- Interior features: First-floor bedroom; First-floor full bath; Eat-in kitchen; Elevator access; No pets allowed
- Laundry & utility: Dedicated laundry room
Neighborhood map
What this means for you Summary
Snapshot
- This is a 1-bed/1.0-bath condo listed at $280k.
Deal economics
- At list price, monthly cash flow is $268 ($3k/yr) — positive.
- The deal already cash-flows at list — no discount required.
- To meet the 1% rule (rent ≥ 1% of price), the offer needs to be $279k (0.4% below list).
- Recommended offer: $279k (0.4% below list) — sets the bar for 1% rule.
- Cap rate 7.4% vs local median 2.6% in New York — top-decile yield for the area; either an underpriced asset or a hidden risk that comps aren't pricing in. Stress-test before assuming the spread holds.
Location & tenants
- Location reads 75/100 on livability (#268 in NY, #4,188 nationally) — a middle-class / working-renter tenant base. Strengths: amenities A+, commute A+, health & safety A; Watch: crime F, cost of living F.
- Zoned schools: Elm Tree Elementary School (math 27% / reading 52%, grade F, #1,444 of 2,108 statewide, top 71%, 806 students, 94% FRL); Is 227 Louis Armstrong (math 52% / reading 69%, grade B+, #153 of 729 statewide, top 21%, 1,528 students, 68% FRL); Midwood High School (math 94% / reading 96%, grade A+, #83 of 1,100 statewide, top 8%, 4,062 students, 73% FRL).
- Market conditions: Rents rising (+2.8%/yr); 661 active listings in the ZIP; 40 comparable units currently listed for rent nearby; rentals at typical pace (median 17d on market — plan ~3-4 weeks tenant-placement turnaround); 5,302 units permitted in Queens County in 2024 (4,918 in 5+ unit buildings).
- At $2,789/mo this rent would consume 51% of the median local household income ($66k/yr) (locally 4119% of renters already pay >50% of income on rent) — very limited rent-growth headroom before tenants either downsize or default.
Forward outlook
- Local home prices are declining (-3.0%/yr); year-one equity from $2k of loan paydown is wiped out by about $8k of value loss. Plan a longer hold.
- Queens County population projected at +16% by 2050 — long-run rental-demand tailwind backs the buy-and-hold thesis.
Negotiation context
- Only 6 days on market — expect competitive offers; lowballing is unlikely to land.
- 5 sale attempts since 14y ago with the ask held roughly flat each time — persistent listings suggest the price (not the market) is what's stuck; bring a comps-based counter.
Risks & watch-outs
- Climate carrying-cost: major wind risk, 27% chance of damaging wind over 30y; extreme-heat days projected 7→15/yr by 2055 (HVAC capex compounding) — expect insurance premiums to compound above CPI over the hold.
Questions for the listing agent
- Built in 1960 — when were the roof, HVAC, electrical panel, plumbing, and water heater last replaced?
- Any open or pending special assessments — roof, HVAC, plumbing, elevator, façade? What's the per-unit balance and payoff schedule, and is the seller paying it off at close or rolling it to the buyer?
- Is there a deadline driving the sale (1031 exchange, divorce, estate, relocation)? That informs how much negotiation room exists.
- Schools are B-rated — typically a magnet for longer-tenancy family renters. What's the average tenant stay here, and is there a school-zone premium baked into asking?
- Crime grade is F in this area — have there been break-ins, vandalism, or insurance claims at this property in the last 3 years? What carrier currently insures it and at what premium?
- What's the average days-on-market for RENTAL listings here right now (not sales)? A rising rental-DOM trend means longer vacancies and softer asking-rent achievability than the comps imply.
- What's the recent tenant-quality profile in this submarket — average credit score on applications, eviction rate, late-payment / NSF rate, and stable-employment percentage? A property-management company in the area should have these aggregated.
- How much new apartment / multifamily construction is in the pipeline within 1–3 miles? Heavy new supply (>2% of stock underway) typically softens rents 12–24 months out; light construction supports rent growth.
Investment metrics
- 1% rule
- 1.00% ✗
- Cap rate
- 7.44%
- Cash-on-cash
- 4.10%
- DSCR
- 1.18
- GRM
- 8.4
CMA / ARV
No comps found within radius.
Projected returns pro-forma
-3.0% appreciation · 2.78% rent growth · sell at horizon
- IRR
- -10.1%
- Equity multiple
- 0.63×
- Total profit
- $-28,874
- Equity at exit
- $41,749
- IRR
- -1.0%
- Equity multiple
- 0.93×
- Total profit
- $-5,506
- Equity at exit
- $24,209
Cash invested: $78,400 (down + closing). Projections, not guarantees.
Landlord ↔ Tenant lean methodology
- Overall (CITY)
- 0 Strongly Tenant-Friendly
- State New York
- 15 Strongly Tenant-Friendly · D+10
- County
- — inherits STATE
- City New York
- 0 Strongly Tenant-Friendly · D+34
ZIP-level market 11354
- Home prices YoY
- -33.9%
- Rents YoY
- 2.8%
- Active inventory
- 661
- Price-to-rent
- 8.4×
Monthly cashflow live
- Estimated rent
- $2,789 high interval (Pro) →
- Mortgage (P&I)
- −$1,468
- Tax est. 1.5%
- −$350 /mo · $4,200/yr
- Insurance
- −$117
- HOA
- −$0
- Vacancy / Maint / Mgmt
- −$586
- Net cashflow
- $268
Break-even live
Sensitivity live
| Price | -10% $462 | -5% $365 | +0% $268 | +5% $171 | +10% $75 |
|---|---|---|---|---|---|
| Rent | -10% $48 | -5% $158 | +0% $268 | +5% $378 | +10% $488 |
| Rate | -1.0pp $409 | -0.5pp $339 | base $268 | +0.5pp $195 | +1.0pp $122 |
UW: 25.0% down · 7.5% · 30yr · 1.5% tax · 5.0% vac · 8.0% maint · 8.0% mgmt
Financing live
Cash to close
- Down payment
- $70,000
- Closing costs
- $8,400
- Reserves months
- —
- Total cash needed
- —
Loan-product check · same deal, 3 products live
Conventional
25% down · 7.5% · 30yr
- Down + closing
- —
- Monthly P&I
- —
- Monthly cashflow
- —
- DSCR
- —
- Eligible?
- —
Personal DTI + credit; lowest rate.
DSCR
20% down · 8.5% · 30yr
- Down + closing
- —
- Monthly P&I
- —
- Monthly cashflow
- —
- DSCR
- —
- Eligible?
- —
No personal income docs; deal must DSCR.
Hard money
10% down · 12.0% · 12mo
- Down + closing
- —
- Monthly P&I
- —
- Monthly cashflow
- —
- DSCR
- —
- Eligible?
- —
Short-term bridge; refi at stabilization.
Rent comps 40 comps
| Address | Beds | Baths | Sqft | Rent | $/sqft | DOM | Units | Dist |
|---|---|---|---|---|---|---|---|---|
| 3132 Union St Unit 4G Flushing, NY | 1.0 | 1.0 | 650 | $2,400 | $3.69 | 9d | 1 | 0.16mi |
| 139-31 34th Ave Unit 3rd fl Flushing, NY | 2.0 | 1.0 | 900 | $2,500 | $2.78 | 26d | 1 | 0.17mi |
| 3132 Union St Flushing, NY | 1.0 | 1.0 | 625 | $2,400 | $3.84 | 20d | 1 | 0.18mi |
| 140-16 34th Ave Apt 1003 Flushing, NY | 2.0 | 2.0 | 1100 | $3,300 | $3.00 | 26d | 1 | 0.24mi |
| 14016 34th Ave Unit 1210 Flushing, NY | 2.0 | 1.0 | 900 | $3,000 | $3.33 | 8d | 1 | 0.24mi |
| 140-16 34th Ave Unit 308 Flushing, NY | — | 1.0 | 600 | $2,250 | $3.75 | 26d | 1 | 0.25mi |
| 140-16 34th Ave Unit 1113 Flushing, NY | 2.0 | 1.0 | 900 | $3,000 | $3.33 | 26d | 1 | 0.25mi |
| 140-16 34th Ave Unit 412 Flushing, NY | — | 1.0 | 600 | $2,250 | $3.75 | 8d | 1 | 0.25mi |
| 3371 Prince St Unit 7C Flushing, NY | 2.0 | 2.0 | 773 | $4,025 | $5.21 | 17d | 1 | 0.33mi |
| 3371 Prince St Unit 6K Flushing, NY | 2.0 | 2.0 | 768 | $4,000 | $5.21 | 17d | 1 | 0.33mi |
| 3371 Prince St Unit 8J Flushing, NY | 2.0 | 2.0 | 741 | $4,075 | $5.50 | 17d | 1 | 0.33mi |
| 3371 Prince St Unit 8F Flushing, NY | 2.0 | 2.0 | 716 | $4,050 | $5.66 | 17d | 1 | 0.33mi |
| 13702 Northern Blvd Flushing, NY | 1.0–2.0 | 1.0 | 850 | $2,600 | $3.06 | 9d | 2 | 0.34mi |
| 13416 35th Ave Unit 7E Flushing, NY | 2.0 | 2.0 | 681 | $3,300 | $4.85 | 26d | 1 | 0.37mi |
| 13812 Northern Blvd Unit 7F Flushing, NY | 1.0 | 1.0 | 600 | $2,500 | $4.17 | 13d | 1 | 0.38mi |
| 2621 Union St Flushing, NY | 1.0 | 1.0 | 800 | $1,800 | $2.25 | 20d | 1 | 0.39mi |
| 141-25 Northern Blvd Unit A14 Flushing, NY | 1.0 | 1.0 | 880 | $2,350 | $2.67 | 12d | 1 | 0.39mi |
| 145-18 34th Ave Unit 8A Flushing, NY | 1.0 | 2.0 | 700 | $2,400 | $3.43 | 3d | 1 | 0.44mi |
| 3641 Union St Unit 2B Flushing, NY | 2.0 | 1.0 | 968 | $3,100 | $3.20 | 26d | 1 | 0.44mi |
| 137-02 Northern Blvd Unit 6K Flushing, NY | 2.0 | 1.0 | 900 | $2,850 | $3.17 | 12d | 1 | 0.45mi |
| 137-02 Northern Blvd Unit 2F Flushing, NY | 1.0 | 1.0 | 800 | $2,550 | $3.19 | 1d | 1 | 0.45mi |
| 13675 37th Ave Unit 3H Flushing, NY | 1.0 | 1.0 | 750 | $3,500 | $4.67 | 1d | 1 | 0.47mi |
| 36-20 Parsons Blvd Unit 5D Flushing, NY | 2.0 | 1.0 | 900 | $2,600 | $2.89 | 16d | 1 | 0.49mi |
| 14238 37th Ave Unit 4C Flushing, NY | 2.0 | 2.0 | 820 | $2,800 | $3.41 | 26d | 1 | 0.49mi |
| 13835 39th Ave Flushing, NY | 2.0–3.0 | 2.0 | 1000 | $4,500 | $4.50 | 3d | 2 | 0.55mi |
| 13835 39th Ave Flushing, NY | 2.0 | 2.0 | 1014 | $4,350 | $4.29 | 26d | 2 | 0.55mi |
| 14424 37th Ave Unit 5B Flushing, NY | 2.0 | 1.0 | 560 | $2,800 | $5.00 | 26d | 1 | 0.57mi |
| 14489 38th Ave Unit 4C Flushing, NY | 1.0 | 1.0 | 790 | $2,400 | $3.04 | 26d | 1 | 0.65mi |
| 13327 39th Ave Unit 3N Flushing, NY | 1.0 | 1.0 | 720 | $3,600 | $5.00 | 26d | 1 | 0.68mi |
| 14809 Northern Blvd Flushing, NY | 2.0–3.0 | 2.0 | 1056 | $3,500 | $3.31 | 16d | 2 | 0.68mi |
| 3916 Prince St Flushing, NY | 1.0 | 1.0 | 530 | $2,900 | $5.47 | 17d | 2 | 0.69mi |
| 14943 35th Ave Flushing, NY | 1.0 | 1.0 | 775 | $2,450 | $3.16 | 4d | 2 | 0.77mi |
| 14943 35th Ave Flushing, NY | 1.0 | 1.0 | 750 | $2,400 | $3.20 | 3d | 1 | 0.77mi |
| 13101 40th Rd Unit 2P Flushing, NY | 1.0 | 1.0 | 761 | $3,300 | $4.34 | 26d | 1 | 0.80mi |
| 4022 College Point Blvd Flushing, NY | 1.0–2.0 | 1.0–2.0 | 983 | $3,200 | $3.25 | 26d | 2 | 0.81mi |
| 4028 College Point Blvd #912 Flushing, NY | 2.0 | 2.0 | 1083 | $4,200 | $3.88 | 26d | 1 | 0.81mi |
| 150-01 Northern Blvd Flushing, NY | 2.0 | 2.0 | 850 | $2,800 | $3.29 | 26d | 1 | 0.82mi |
| 40-10 149th St Fl 1 Flushing, NY | 2.0 | 1.0 | 900 | $2,200 | $2.44 | 16d | 1 | 0.83mi |
| 14427 Sanford Ave Unit 7G Flushing, NY | 2.0 | 1.0 | 655 | $3,500 | $5.34 | 26d | 1 | 0.85mi |
| 133-08 41st Rd Flushing, NY | 2.0 | 1.0 | 700 | $2,300 | $3.29 | 26d | 1 | 0.87mi |
HOA detail condo
- Monthly dues
- $0 · $0/yr
- Likely covers
- watergaselectriclandscaping
- Assessments
- None detected in remarks — confirm with the listing agent.
Listing history 5 events
-
2026-06-21days on market $280,000 Active 6 DOM
-
2026-06-18days on market $280,000 Active 3 DOM
-
2026-06-17days on market $280,000 Active 2 DOM
-
2026-06-15remarks 687-char remark
-
2026-06-15$280,000 Active 1 DOM
ⓘ Source: listings_history table (triggers on properties + properties_extension) + one-shot
backfill from property_details.listing_events for pre-trigger history.
Climate risk First Street
- Flood 1/10 Low FEMA zone X (shaded) · 0% chance over 30 yrs
- Wildfire 1/10 Low
- Heat 6/10 Major 7 d/yr ≥99°F today · 15 d/yr by 30 yrs out
- Wind 6/10 Major 27% chance of damaging wind over 30 yrs
- Air quality 4/10 Moderate 6 unhealthy d/yr today · 6 by 30 yrs out
Nearby sold comps map
Loading sold comps map…
Walkable amenities ~0.75 mi
Loading nearby amenities…
Taxation est. · year 1
- Rental income
- $33,464
- − Mortgage interest
- −$15,684
- − Property taxes
- −$4,200
- − Insurance
- −$1,400
- − Repairs & maintenance
- −$2,677
- − Management
- −$2,677
- − Depreciation
- −$8,145
- Taxable loss
- −$1,320
- Est. tax savings @ 24.0%
- +$317
- After-tax cash flow
- $3,533/yr
For passive investors: Depreciation is non-cash, so a rental often shows a tax loss while cash-flowing — sheltering income. Rental losses are passive: they offset passive income freely, and up to $25,000/yr can offset ordinary (W-2) income if you actively participate and your MAGI is under $100k (phasing out to $0 by $150k); unused losses carry forward. On sale, claimed depreciation is recaptured at up to 25%, and gains may owe capital-gains tax (a 1031 exchange can defer both). Figures are a year-1 estimate at your 24.0% rate — not tax advice; consult a CPA.
Schools (NCES district)
No district data.
Livability — New York
- Score
- 75/100
- State rank
- #268
- US rank
- #4188
Category grades
Schools grade is shown separately in the Schools card above.
Census & demographics
- Census place
- New York, NY
- County
- Queens County · 1,914,869 people
- City population
- 7,731,280
- Metro
- New York-Newark-Jersey City, NY-NJ-PA
- Population (ZIP)
- 53,028
- Household income
- $66,010
- Rent vs Own
- Severe rent burden
- 4119.0
Population outlook (Queens County) Hauer SSP2
- Today (2025)
- 2,546,320 people
- By 2030
- 2,643,059 · +3.8%
- By 2040
- 2,815,563 · +10.6%
- By 2050
- 2,944,423 · +15.6%
- By 2075
- 3,123,338 · +22.7%
- By 2100
- 3,098,688 · +21.7%
Race, ethnicity, and origin ACS 2023
- Neighborhood character
- Majority Asian (64%)
- Race & ethnicity
- Asian 64% White 15% Hispanic / Latino 14% Two or more races 6% Black 3%
- Hispanic origin (detail)
- Mexican 2% Puerto Rican 2% Dominican 2%
- Common ancestry
- Romanian 1% Italian 1%
- Foreign-born
- 66% · China, Canada, South Korea
- Languages at home
- 22% English-only · Chinese 43% Spanish 14% Korean 11%
Political lean MEDSL · Queens
- 2024 margin
- Strong D (+24.6) · D 62.3% · R 37.7%
- 2008→2024 swing
- -26.2pp toward R · 2008: 50.8pp · 2024: 24.6pp
- All cycles
- 2024: D+24.6 2020: D+45.2 2016: D+53.4 2012: D+58.5 2008: D+50.8
Not yet ingested
- Civics
- —
Market trends
- HPI YoY
- ▼ -131.64%
- Current HPI
- 257.0828
- Rent YoY
- ▲ 2.78%
- Metro
- New York-Newark-Jersey City, NY-NJ-PA
- State GDP YoY
- ▲ 2.60%
- F500 in state
- 92
Industry mix (Fortune 500 HQ in NY)
| Industry | F500 HQs | Revenue |
|---|---|---|
| Financial Services | 10 | $950B |
|
||
| Consumer Goods | 9 | $162B |
|
||
| Insurance | 4 | $225B |
|
||
| Telecommunications | 2 | $144B |
|
||
| Pharmaceuticals | 2 | $112B |
|
||
| Media / Entertainment | 2 | $69B |
|
||
Price history
+106.1% since first listed9 events — show timeline
- 2026-06-15 Listed $280,000 OneKey® MLS as Distributed by MLS Grid
- 2015-06-10 Listing Removed — OneKey® MLS as Distributed by MLS Grid
- 2014-06-04 Listed $169,000 OneKey® MLS as Distributed by MLS Grid
- 2013-07-19 Listing Removed — OneKey® MLS as Distributed by MLS Grid
- 2013-04-09 Listed $138,000 OneKey® MLS as Distributed by MLS Grid
- 2013-03-04 Listing Removed — OneKey® MLS as Distributed by MLS Grid
- 2012-08-15 Listed $135,888 OneKey® MLS as Distributed by MLS Grid
- 2012-08-07 Listing Removed — OneKey® MLS as Distributed by MLS Grid
- 2012-05-12 Listed $135,888 OneKey® MLS as Distributed by MLS Grid
Cash-flow waterfall
monthlySold comps — $/sqft
last 12 mo · ≤1 miLoading sold comps…